HAL Id: hal-01714097
https://hal.archives-ouvertes.fr/hal-01714097
Submitted on 21 Feb 2018
HAL is a multi-disciplinary open access
archive for the deposit and dissemination of
sci-entific research documents, whether they are
pub-lished or not. The documents may come from
teaching and research institutions in France or
abroad, or from public or private research centers.
L’archive ouverte pluridisciplinaire HAL, est
destinée au dépôt et à la diffusion de documents
scientifiques de niveau recherche, publiés ou non,
émanant des établissements d’enseignement et de
recherche français ou étrangers, des laboratoires
publics ou privés.
Effect of high cobalt concentration on hopping motion in
cobalt manganese spinel oxide (CoxMn3–xO4,x
≥ 2.3)
Hyuksu Han, Jae Seok Lee, Jeong Ho Ryu, Kang Min Kim, Jacob L. Jones,
Jiun Lim, Sophie Guillemet-Fritsch, Han Chan Lee, Sungwook Mhin
To cite this version:
Hyuksu Han, Jae Seok Lee, Jeong Ho Ryu, Kang Min Kim, Jacob L. Jones, et al..
Effect of
high cobalt concentration on hopping motion in cobalt manganese spinel oxide (CoxMn3–xO4,x
≥
2.3). Journal of Physical Chemistry C, American Chemical Society, 2016, 120 (25), pp.13667-13674.
�10.1021/acs.jpcc.6b01440�. �hal-01714097�
Open Archive TOULOUSE Archive Ouverte (OATAO)
OATAO is an open access repository that collects the work of Toulouse researchers and
makes it freely available over the web where possible.
This is an author-deposited version published in :
http://oatao.univ-toulouse.fr/
Eprints ID : 18097
To link to this article : DOI:10.1021/acs.jpcc.6b01440
URL :
http://dx.doi.org/10.1021/acs.jpcc.6b01440
To cite this version :
Han, HyukSu and Lee, Jae Seok and Ryu,
Jeong Ho and Kim, Kang Min and Jones, Jacob L. and Lim, Jiun
and Guillemet-Fritsch, Sophie and Lee, Han Chan and Mhin,
Sungwook Effect of high cobalt concentration on hopping motion in
cobalt manganese spinel oxide (CoxMn3–xO4,x≥ 2.3). (2016)
Journal of Physical Chemistry C, vol. 120 (n° 25). pp. 13667-13674.
ISSN 1932-7447
Any correspondence concerning this service should be sent to the repository
administrator:
staff-oatao@listes-diff.inp-toulouse.fr
Effect of High Cobalt Concentration on Hopping Motion in Cobalt
Manganese Spinel Oxide (Co
x
Mn
3−x
O
4
, x ≥ 2.3)
HyukSu Han,
†Jae Seok Lee,
‡Jeong Ho Ryu,
§Kang Min Kim,
∥Jacob L. Jones,
⊥Jiun Lim,
#Sophie Guillemet-Fritsch,
∇Han Chan Lee,
○and Sungwook Mhin
*
,○†Korea Institute of Industrial Technology, Gwahakdanji-ro 137-41, Gangneung-si, Gangwond-do 25440, Republic of Korea ‡Department of Materials Science and Engineering, University of Florida, Gainesville, Florida 32611, United States
§Department of Materials Science and Engineering, Korea National University of Transportation, Chungju, 380-702, Republic of
Korea
∥
National Institute of Advanced Industrial Science and Technology, Tsukuba, Ibaraki 305-8568, Japan
⊥
Department of Materials Science & Engineering, North Carolina State University, North Carolina 27695 Raleigh, United States
#
Department of Materials Science and Engineering, Ajou University, World cup-ro 206, Suwon-si, Gyeonggi-do 443-749, Republic of Korea
∇
CNRS, Institut Carnot CIRIMAT, UMR CNRS-UPS-INP 5085, Université Paul-Sabatier, 118 route de Narbonne, 31062 Toulouse Cedex 9, France
○
Korea Institute of Industrial Technology, Gaetbeol-ro 156, Yeonsu-gu, Incheon, 406-840, Republic of Korea
ABSTRACT: Hopping motions in cobalt manganese spinel oxides with high cobalt concentration (CoxMn3−xO4, 2.3 ≤ x ≤ 2.7) are investigated in order to
clarify the origin of unusual electrical behaviors as negative temperature coefficient (NTC) thermistors. Based on the resistance versus temperature (R−T) characteristics, hopping conduction mechanisms in MCO compounds (x = 2.3 and 2.5) are attributed to variable range hopping (VRH) motion with a parabolic distribution of the density of states (DOS) near the Fermi level. However, when Co content increases up to 2.7, transition in the hopping motion occurs from VRH to the nearest neighboring hopping (NNH) motion, which can be responsible for a huge increase of the resistance accompanied by decrease of the factor of thermal sensitivity (B value) in MCO compounds (x = 2.7). Also, hopping distance and activation energies for MCO (x = 2.3 and 2.5) compounds following VRH conduction are calculated as a function of temperature, indicating that higher B value observed in MCO (x = 2.5) compound is due to the larger hopping distance compared to that of MCO (x = 2.3) compound.
■
INTRODUCTIONMixed transition metal oxides with spinel structures (AB2O4, A,
B = Ni, Co, Mn, etc.) play an increasingly important role in a variety of applications such as electronics, energy storage devices, and medical treatments due to their exceptional electronic properties.1−5 To be specific, great attention has
been focused on spinel oxides for the use of negative temperature coefficient (NTC) thermistors6 thanks to its high absolute temperature coefficient of resistance (TCR, ∼ −4%/K) with moderate resistivity (10 < ρ (Ω·cm) < 103) at
room temperature.7
In the spinel crystal structure, oxygen ions are close-packed with face-centered cubic configuration, and one-eighth of the tetragonal A sites and one-half of the octahedral B sites are occupied by cations. The cations in A and B sites can have oxidation states of +2 to +3 and +2 to +4, respectively. Electrical conduction in spinel oxides mainly occurs via
hopping conduction process within different cations rather than electronic conduction.8The hopping conduction in spinel oxides is attributed to the mixed valence states of different cations. Thus, electrical properties of spinel oxides are greatly affected by cation distribution and oxidation states in the two crystallographic sites, A and B.3,7
Among a number of spinel oxides, the (Mn3−xCox)O4(0 ≤ x
≤3, MCO) system has been widely investigated for the NTC thermistor application given that the strong electron correlations in metal Mn can induce semiconductive character-istics with moderate resistivity at room temperature. Also, when Co content increases over 1, Co cations start to occupy octahedral B sites leading to significant change of cation
distribution in the crystal structure and thus different electrical behaviors. According to Rousset et al., MCO compounds with Co contents between 1.5 and 2.0 show the high factor of thermal sensitivity (∼4000 K, B value) and the moderate resistivity (102< ρ (Ω·cm) < 103) at room temperature, which
are the desired electrical properties for real applications as NTC thermistors.7 However, if Co content further increases up to
2.7, the B value dramatically dropped and huge increase of resistivity was observed. Although many researches have been performed on MCO compounds (1.5 ≤ x ≤ 2.0) suitable compositions for NTC applications, up to our knowledge, it still remains unclear why significant drop of B value accompanied by increase of the resistivity occurs for MCO compounds with Co content over 2.5.
Based on the results of neutron diffraction and the bond valence sum (BVS) calculations, it has been proposed that a double mixed valency for manganese (Mn3+/Mn4+) and cobalt
(Co2+/Co3+) are present in the cation distributions of MCO
compounds (1 ≤ x ≤ 3)7,9Thus, the cation distribution of Co-rich MCO compound can be described by
≤ ≤ < < + + − − ||| − − + + − x y Co [Co Co Mn Mn ]O , 1 3 (0 0.40) y x y x y y 2 2 1 33 4 42
where the square brackets indicate octahedral sites. Conduction process in Co-rich MCO compound is based on thermally activated hopping between mixed valency of cations (i.e., Mn3+/Mn4+and Co2+/Co3+). Also, charge transport occurs via
small polaron hopping in a localized real space due to the strong ionic character of the bonding in spinel crystal structure. This is in contrast to the conventional semiconductors where the delocalized charge carriers are described in momentum space.10
In this work, hopping conduction mechanisms in Co-rich MCO compounds are fully investigated with corresponding
analytical models in order to give insight onto the origin of unexpected behaviors of resistance and thermal sensitivity in MCO (x > 2.5). Co-rich MCO compounds (x = 2.3, 2.5, and 2.7) were prepared via solid state reaction, and structural-compositional studies were performed on the sintered ceramics via appropriate analysis techniques.
■
EXPERIMENTAL PROCEDUREOxide powders of Mn3O4 (99.9%, Junsei Chem. Japan) and
Co3O4 (99.9%, Junsei Chem. Japan) were prepared with
different stoichiometric amounts; Co2.3Mn0.7O4, Co2.5Mn0.5O4,
and Co2.7Mn0.3O4. After the oxide powders were mixed with
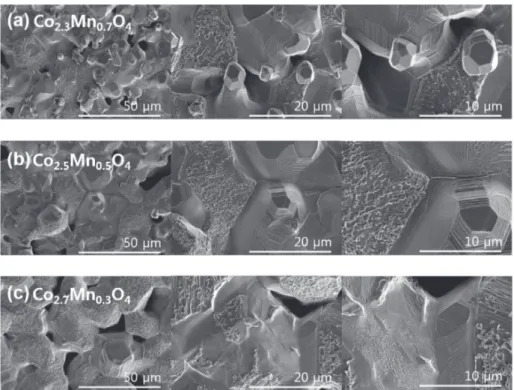
10% poly(vinyl alcohol) (PVA) solution as a binder in deionized water, spray drying was used to produce the spherical oxide powders with homogeneous particle size distribution. The dried powders were pressed to prepare pellets of 0.5 mm-thick and 2 cm in diameter. The pellets were heated to 873 at 5 K/min and left for an hour before heating to the sintering temperature (1,473 K) with heating rate of 5 K/min and held for 8h in a furnace. Subsequently, the pellets were cooled down to 1,173 K with cooling rate of 100 K/h and left for an hour before quenching to room temperature. Each sintered pellet was characterized by X-ray diffraction (XRD) for 30 min using Panalytical X’pert−pro MPD with Cu Kα radiation. The volume fraction of each phase was estimated using integration method for XRD data. The microstructure of each sample was investigated using scanning electron microscopy (SEM; Nova NanoSEM, FEI, USA). Thermogravimetric (TG) and differ-ential thermal analysis (DTA) of the powders after spray drying were also observed using TG-DTA (Setsys evolution TGA-DTA, Setaram, France). For resistance analysis in the temperature range between 300 and 353 K, silver electrode was screen-printed on the top of the sintered pellets, and, subsequently, heat treatment was performed at 853 K for 2 h. The thickness of the screen-printed electrode was about 20 um. Figure 1.SEM images of MCO samples with Co content of (a) 2.3, (b) 2.5, and (c) 2.7.
The pellets were diced to cuboid with electrodes (cuboid; 1 mm × 2 mm × 0.5 mm, and electrodes at left and right sides of the cuboid; 0.5 mm × 0.5 mm). Resistance of the cuboid between 300 and 353 K was measured using an LCR meter (IM3570, Hioki, Japan).
■
RESULTS AND DISCUSSIONFigure 1represents SEM images of sintered MCO samples by using starting powders prepared through spray drying. MCO starting powders have homogeneous round shape morphology with the average particle size of ∼20 μm. Spray drying is a rapid single step powder synthesis technique, which can eliminate solvent in a short time leading to homogeneous particle morphology. As shown inFigure 1, the grain sizes of sintered samples shows a relatively large variation (1 μm ∼ 30 μm). Also, lamella structures were observed for all the sintered MCO samples regardless of compositions. This lamella structure might be associated with twins, which can be generated by the cubic-tetragonal phase transformation during cooling.7 XRD
patterns of MCO samples were measured at room temperature, and the results are shown in Figure 2. It can be seen from
Figure 2 that MCO samples have a mixture of cubic and tetragonal phases. A crystal structure of MCO (x = 2.3) compound mainly consists of tetragonal spinel phase, and cubic spinel and CoO phases were copresented as secondary phases. However, a symmetry transition occurred from tetragonal to cubic phase as Co content increases over 2.5, and cubic spinel was the main phase for MCO (x = 2.7) sample.7The inset of
Figure 2 clearly shows the dominant phase for different compositions. Also, a diffraction peak intensity of CoO phase was increased as Co content increases, indicating that higher Co concentration might facilitate formation of CoO phase. In addition, MCO (x = 2.5) sample might have a crystal structure between those of two other compounds (x = 2.3 and 2.7). The volume percentage of tetragonal spinel, cubic spinel, and CoO phases in MCO samples were estimated using XRD data, and the results are summarized in Table S1 (please seeSupporting Information).
Thermal analysis (TG and DTA) were performed on MCO ceramics, and the results are presented inFigure 3. The initial
weight loss accompanied by an endothermic peak in the DTA curve was observed at the temperature range from room temperature to 573 K, which might be due to the desorption and volatilization of surface absorbed water and residual organics in the sample (Figure 3a,b). Also, there was no significant difference for the change of weight percentage within MCO samples in the temperature range between room temperature to 573 K. As increasing temperature further, mass of the samples started to gradually increase at temperature above 573 K, and then substantial weight gain occurred in the temperature range between 773 and 873 K accompanied by an endothermic peak (Figure 3a,b). This can be possibly attributed to the oxidation of Mn3+and Co3+cations on octahedral sites.
Moreover, it should be mentioned here that the MCO sample (x = 2.5) shows the lowest weight gain compared to the other two MCO compounds (x = 2.3 and 2.7). This might indicate that oxidation occurs less significantly in the MCO compound (x = 2.5) possibly due to the cation distribution for efficient charge compensation. In addition, weight loss with an exothermic peak in the DTA curve was observed for all samples as temperature increases from 973 to 1223 K, which might be due to the oxidation of Mn3+and Co2+to Mn4+and
Co3+, indicating the spinel phase formation of MCO
compounds. Furthermore, as temperature increases above 1400 K, abrupt weight loss was confirmed by TG data collected by all samples, and an exothermic peak was also presented in DTA curves (Figure 3a,b). This abrupt weight loss might be due to the decomposition of spinel phase at high temperature. It was observed at MCO compound (x = 2.5) that weight loss started at lower temperature and the percentage of weight loss was much larger than those of other two compounds. Moreover, TG/DTA data of MCO samples were measured during cooling from 1473 K to room temperature, and the results are shown in (Figure 3c,d). For all samples, weight was abruptly increased as temperature decreased from 1473 to 1073 K due to the reoxidation,11 and further weight change during cooling to room temperature was not observed. As can be seen inFigure 3c, the total weight loss of MCO (x = 2.5) was much larger compared to MCO (x = 2.3 and 2.7) samples, implying that MCO (x = 2.5) was less reoxidized during cooling possibly due to optimal cation distribution for the charge compensation. The cation distribution of MCO (x = 2.5) compound which is suitable for efficient charge compensation might lead to higher
B value (i.e., high thermal sensitivity) compared to those of
MCO compounds (x = 2.3 and 2.7). This will be further discussed below.
According to small polaron hopping theory, hopping conduction between cations with different valences can be regarded as macroscopic percolation systems consisting of a random resistor network.10In this model, the resistivity (ρ) is determined by resistors that are close to the percolation threshold (ξc) including both spatial and energy terms as
follows: ρ=ρ exp( )ξ 0 c (1) ξ ξ ε ≥ = r + a k T 2 ij ij ij c B (2)
where ρ0 is a constant related with physical properties of the
system, and rij, εijare the separation of the electrons in real and
energy space, respectively. kBis the Boltzmann constant, and a
is a localization length that can be generally approximated as Figure 2.XRD patterns of (a) (Co2.3Mn0.7)O4, (b) (Co2.5Mn0.5)O4,
and (c) (Co2.7Mn0.3)O4 measured for 2θ range from 10° to 40° at
room temperatuure. The inset shows evolution of cubic and tetragonal phases in MCO samples as Co content increases.
ionic radii of Mn3+for spinel manganese oxides due to the lack
of the exact rijvalues. Each term (i.e., real space and energy) in
eq 1competes with each other, and the hopping process might be constrained to nearest neighbors in real space when the spatial term dominates ξc. This type of hopping conduction is
referred to as nearest neighbor hopping (NNH) conduction.10 However, charge carriers can be hopped to a farther site than nearest neighbors if energetically favorable sites are available, and this hopping mechanism is referred to as variable range hopping (VRH) conduction. In the VRH model, donors and acceptors are separated in energy space, and the ξijvalue can be
lower than that of the NNH process. A general expression of resistivity for both cases can be described as follows:
ρ = α ⎜⎛ ⎟ ⎝ ⎞ ⎠ T CT T T ( ) exp p 0 (3) where C is a constant, and T0is characteristic temperature.12,13
For NNH, α = p = 1 and T0is only proportional to εij(T0= ε3/
kB, ε3is the activation energy for NNH conduction (EA,NNH)),
while α = 2p, and T0can be described as below for the case of
VRH,10,14 = ′ + + ⎛ ⎝ ⎜ ⎞ ⎠ ⎟ T k a g z 1 21.2 ( 1) z 0 B 3 1/( 1) (4) ε = ′ε g( ) g z (5)
where g(ε) is a parametrized density of state (DOS), and ε is the energy of electron with zero energy at the Fermi level. Also,
z is related to the p value as p = (z + 1)/(z + 4). Here, it is
important to note that the p value is close to 1/4 if the system has a uniform DOS near the Fermi level (i.e., the case of Mott’s VRH model), while a p value close to 1/2 implies that a parabolic distribution of DOS exists at the Fermi level. Furthermore, a p value near 1 indicates that the hopping process of the system might follow the NNH conduction mechanism rather than VRH. According to Shklovskii and Efros, the p value can be obtained by using the equation below.10,12,14 ρ = ≈ − − ⎜ ⎟ ⎛ ⎝ ⎞ ⎠ W T T p T T 1 d(ln ) d( ) p 1 0 (6) Thus, one can elucidate the hopping motion of a certain system by usingeq 6and determine whether VRH (p = 1/4 or 1/2) or NNH (if p ≈1) motions can provide the best description of the R−T data. Also, it should be noted here that for NTC ceramics, not only grain but also grain boundary can exhibit hopping conduction.15Thus, the grain boundary effect should be considered for the resistivity of MCO compounds. In order to investigate resistance of the grain and grain boundary separately, Nyquist plots of the impedance data were analyzed at different temperature. However, since MCO samples studied in this work have high concentration of cobalt, inductive loops in Nyquist plots appear for every sample, possibly due to high interference between magnetic and electric fields during Figure 3.(a) TG and (b) DTA plots of MCO samples during heating in the temperature range between 300 and 1500 K. (c) TG and (d) DTA plots of MCO samples during cooling from 1500 to 300 K.
measurements. This makes it difficult to calculate exact values of resistance for respective components by fitting the data. Therefore, in this work, bulk resistance data was used to investigate hopping motions in MCO compound since it includes both grain and grain boundary resistance.
Resistance of the MCO samples with different Co contents (2.3, 2.5, and 2.7) was measured as a function of temperature (300 K ∼ 353 K), and the result is shown inFigure 4. It can be
seen inFigure 4that the resistance of compounds increases as Co content increases. In addition, huge increase of resistance was observed when Co content increases from 2.5 to 2.7. The B value was calculated for each compound by using the following equation:7 = · = · ⎜ ⎟ ⎛ ⎝ ⎜ ⎞ ⎠ ⎟ ⎛ ⎝ ⎞ ⎠ R R E k T R B T exp exp 0 a B 0 (7) = · − · ⎛ ⎝ ⎜ ⎞ ⎠ ⎟ B T T T T R R ln 1 2 2 1 1 2 (8)
where B is the energetic constant (the factor of thermal sensitivity), which is directly related to the activation energy for hopping conduction (Ea). R, kB, and T are resistance, the
Boltzmann constant, and absolute temperature, respectively. The calculated B values for temperature range of 300−353 K are presented in the inset of Figure 4. As can be seen in the inset of Figure 4, MCO (x = 2.5) shows the highest B value (3818 K) compared to those of MCO samples; 3498 K and 3362 K for MCO with Co content of 2.3 and 2.7, respectively. These results are consistent with the previous results which indicate that the huge increase of resistance accompanied by decrease of B value occurred for MCO compound with Co content over 2.5.7
Furthermore, in order to investigate the effect of secondary phases on electrical property of MCO compound, we have performed high temperature XRD analysis and prepared phase-pure MCO ceramics using spark plasma sintering (SPS) technique. Based on the results of high temperature XRD as shown in Figure S1 (please see Supporting Information), sintering of MCO at high temperature inevitably leads to the formation of the mixture phase of cubic and tetragonal spinel with CoO phase. Formation of the secondary phase can be suppressed by employing a low-temperature sintering techni-que. In order to obtain phase-pure MCO ceramic, MCO
powders were calcined at relatively low temperature (900 °C) and subsequently sintered at 700 °C for 5 min using SPS technique. SPS has one of the advantages such as sintering of ceramics at low temperature thanks to mechanical pressure applied to the sample during sintering. In addition, the sample can be rapidly quenched to room temperature (less than 30 min). Thus, formation of the secondary phase during cooling can be minimized when SPS was used. As shown inFigure S2, SPS sintered MCO samples have phase-pure spinel structure without CoO phase. Moreover, the phase transformation of cubic to tetragonal spinel was successfully minimized for the SPS sintered MCO ceramics. Resistance of phase-pure MCO samples were measured at different temperature and B values were calculated for each sample (Figure S3). It can be seen in
Figure S3that for the same Co content, the B value of phase-pure MCO sample is comparable with that of MCO sample with CoO phase. Therefore, the secondary phase of CoO has a less significant effect on the electrical property of MCO compound, while Co contents in the MCO compound play an important role in determining hopping motion.
In order to investigate the origin of unexpected electrical behaviors in MCO compound with Co content of 2.7, hopping motion should be precisely determined for each compound by using appropriate analytical models, which were described above. First, p values for MCO compounds can be calculated from the ln(W) versus ln(T) plots (eq 6). It should be noted here that W values are sensitive to scatter in the original R−T data due to a differentiation method, which can result in poor linearity in the ln(W) versus ln(T) plot. Although ln(W) values of MCO samples showed rather poor linearity against ln(T), p values close to 0.5 (0.33 and 0.46) were calculated for MCO compound with Co content 2.3 and 2.5, respectively, while p value close to 1 was obtained for MCO (x = 2.7) sample. This result might imply that the hopping motion for MCO compounds (x = 2.3 and 2.5) occurs via VRH with a parabolic distribution of DOS at the Fermi level, while NNH motion prevails as the hopping conduction mechanism of MCO compounds with Co content of 2.7.
Figure 5represents ρ−T data of MCO compounds plotted by following VRH (p value = 0.5) for Co contents of 2.3 and 2.5 and NNH model for Co contents of 2.7, respectively. A good linearity in ln(ρ) versus 1/T plot was observed for MCO compound with Co content of 2.7 (Figure 5), indicating that Figure 4.DC resistance versus temperature plots of MCO samples for
the temperature range from 303 to 353 K.
Figure 5.Plot of ln(ρ/T) versus 1/T0.5for MCO (x = 2.3 and 2.5)
hopping conduction might proceed via NNH model. From the linear fit of ln(ρ) versus 1/T plot, the average characteristic temperature (T0) of 3303 K was extracted for MCO sample (x
= 2.7), and thus the activation energy (EA,NNH, T0= EA,NNH/kB)
of NNH conduction can be determined as 0.28 eV, which is comparable with the previously reported values for manganese spinel oxides.10,14
ln(ρ/T) versus 1/T0.5plots for the both of MCO samples
with Co content of 2.3 and 2.5 are also shown inFigure 5. It is clearly observed in Figure 5 that ln(ρ/T) plots have a linear relationship with 1/T for the both samples, which implies that hopping conduction occurs by following VRH hopping motion. One can calculate g′ values representing a lower limit of DOS near the Fermi level based on the linear fitting parameters (T0)
for ln(ρ/T) versus 1/T0.5plots and a value (∼0.7 Å) estimated
as the Mn3+/Mn4+ cation radii from a hard sphere model.10
Table 1summarizes the resistivity at 303 K (ρRT), g′, and T0for
MCO compounds with Co content of 2.3 and 2.5, respectively. For MCO (x = 2.7) sample, T0 and EA,NNHare also listed in
Table 1. Furthermore, it is important to note that for VRH conduction (p value <1), hopping distance and activation energy are not constant as a function of temperature, but it depends on temperature change.16−18 For conventional
semiconductors, localized electrons within band gap are activated from donor states or charge trap sites into the conduction band as temperature changes, which results in variation of activation energy. On the contrary, for the case of MCO compound, electrons are strongly localized at the lattice due to the nature of ionic bonding in the crystal structure, thus the variation of activation energy might change the maximum hopping distance as well. In order to investigate the maximum hopping distance at different temperatures, it is necessary to calculate the upper limit of DOS at the vicinity of Fermi level. According to Schmidt et al., the features of DOS for manganese spinel oxide can be represented as the parabolic distribution with upper and lower Hubbard bands, which are separated by a broad energy gap similar to the activation energy for NNH conduction (ε3, 0.28 eV for MCO compound) (Figure 6).14It
can be assumed that electron states within the upper and lower Hubbard bands can contribute to conduction process, since ε3
is associated with the polaron formation energy. Therefore, the upper limit of DOS near the Fermi level can be regarded as the DOS at 0.14 eV. g(0.14 eV) values are calculated as 1.07 × 10²¹
(eV−1·cm−3) and 6.13 × 10²⁰(eV−1·cm−3) by using eq 5for
MCO compounds with Co content of 2.3 and 2.5, respectively.
Then, one can calculate hopping distance and activation energy for VRH conduction (EA,VRH) as a function of temperature by
using the following equations:17,19
π
= · ·
R a1/4/[8 g(0.14eV)k TB ]1/4 (9) =
EA,VRH 0.5k T TB 00.5 0.5 (10)
Figure 7 shows the calculated hopping distance and activation energy at different temperature for MCO (x = 2.3
and 2.5) samples. It was found that for MCO (x = 2.3), R increases from 0.20 to 0.21 nm and EA,VRHdecreases from 0.33
to 0.31 eV as temperature decreases from 350 to 300 K. The similar trend was observed for MCO (x = 2.5) sample; R increases from 0.23 to 0.24 nm and EA,VRHdecreases from 0.36
to 0.34 eV at the same temperature range (350 to 300 K). The g(0.14 eV) values, hopping distance (RRT), and activation
energy for VRH conduction (EA@RT,VRH) at room temperature
are summarized inTable 1.
MCO (x = 2.3) shows lower ρRT value (645.8 Ω·cm)
compared to that of MCO sample (x = 2.5, 3680.4 Ω·cm), which might be due to lower EA@RT,VRH(0.31 eV) of MCO (x =
2.3) compound. Furthermore, higher B value of MCO (x = 2.5) than MCO (x = 2.3) (inset ofFigure 4) can be related with larger hopping distance (0.24 nm for MCO (x = 2.5) and 0.21 Table 1. ρRTand T0Values for MCO Samples
a
MCO
(x = 2.3) (x = 2.5)MCO (x = 2.7)MCO
ρRT(Ω·cm) 645.8 3680.4 25678.8
T0(K) 1.74 × 10⁵ 2.10 × 10⁵ 3.3 × 10³
EA,NNH(eV) N/Ab N/A 0.28
g′ (cm−3·eV−3) 5.50 × 10²² 3.12 × 10²² N/A
g(0.14eV) (cm−3·eV−1) 1.07 × 10²¹ 6.13 × 10²⁰ N/A
RRT(nm) 0.21 0.24 N/A
EA@RT,VRH(eV) 0.31 0.34 N/A
aThe activation energy of NNH conduction (E
A,NNH) is calculated for
MCO (x = 2.7) sample. The values of g′, g(0.14 eV), hopping distance (RRT, at room temperature), and activation energies of hopping
conduction (EA@RT,VRH, at room temperature) for MCO (x = 2.3 and
2.5) samples are calculated following VRH motion. bN/A: Not
available.
Figure 6. DOS versus electron energy for MCO spinel oxide represented as the parabolic distribution with upper and lower Hubbard bands.
Figure 7.Hopping distance and activation energies as a function of temperature for MCO (x = 2.3 and 2.5) samples following VRH conduction.
nm for MCO (x = 2.3), Figure 7), since larger maximum hopping distance means that there should be more available hopping sites at the vicinity of the cation resulting in a variety of path ways for conduction. The large number of possible hopping sites of MCO (x = 2.5) compound might be associated with the optimal cation distribution in the lattice which is in consistent with the results from thermal analysis (Figure 3). As Co contents increases up to 2.7 (MCO, x = 2.7), transition in hopping motion occurred from VRH to NNH resulting in huge increase of ρRT(25 678.8 Ω·cm); 2 orders of magnitude higher
than resistivity of MCO (x = 2.3). Moreover, high concentration of Co ions can significantly decreases concen-tration of available hopping sites (i.e., Mn3+/Mn4+ ions in B
sites), and thus results in decrease of B value. Thus, unexpected electrical behaviors in MCO compound (x > 2.5) might be due to NNH hopping motion and reduced concentration of Mn3+/
Mn4+ions. It can be concluded that for MCO compound, VRH
hopping motion with large hopping distance rather than NNH process is favored to achieve moderate resistivity and high B value at room temperature, which are desired properties of NTC materials for real applications.
■
CONCLUSIONCobalt manganese spinel oxides with high cobalt contents (CoxMn3−xO4, x = 2.3, 2.5, and 2.7) were prepared via solid
state route. Microstructure of sintered ceramics showed grain sizes of 1 μm ∼ 30 μm, and measured X-ray diffraction (XRD) data confirmed that CoxMn3−xO4 (MCO) samples were
crystallized in a mixture phases of cubic and tetragonal spinel structure. Also, according to thermal analysis data of MCO samples, less oxidation during cooling and heating occurred for MCO sample with Co content of 2.5 than those of MCO (x = 2.3 and 2.7) samples, which might be due to the cation distribution for efficient charge compensation in MCO (x = 2.5) sample. Resistance versus temperature characteristics of each MCO compounds were investigated to determine hopping motion in the compound. The results suggested that hopping conduction in MCO (x = 2.7) occurs through nearest neighboring hopping (NNH) motion, while variable range hopping (VRH) motion was determined as hopping con-duction mechanism for MCO (x = 2.3 and 2.5) samples. NNH motion of MCO (x = 2.7) sample might be responsible for high resistance of the compound compared to those of MCO samples (x = 2.3 and 2.5). Moreover, hopping distance and activation energies for MCO samples following VRH motion were calculated as a function of temperature. The results indicated that MCO (x = 2.5) has larger hopping distance than that of MCO (x = 2.3), which can possibly result in higher value for the factor of thermal sensitivity (B value).
■
ASSOCIATED CONTENT*
S Supporting InformationThe Supporting Information is available free of charge on the
ACS Publications websiteat DOI:10.1021/acs.jpcc.6b01440. High-temperature XRD of Co2.7Mn0.3O4 during heating
and cooling, XRD patterns for SPS sintered MCO ceramics with different Co contents, B value for phase-pure MCO ceramics, and volume faction of tetragonal spinel, cubic spinel, and CoO phases in MCO compounds with different Co contents (PDF)
■
AUTHOR INFORMATION Corresponding Author*Electronic mail: hyeleci@kitech.re.kr; Office: +82 31 8084 8641; Fax: +82 32 850 0230.
Notes
The authors declare no competing financial interest.
■
ACKNOWLEDGMENTSThis work (Grants No. C0298950) was supported by Business for Cooperative R&D between Industry, Academy, and Research Institute funded Korea Small and Medium Business Administration in 2015.
■
REFERENCES(1) Lavela, P.; Tirado, J. L. CoFe2O4and NiFe2O4Synthesized by
Sol−gel Procedures for Their Use as Anode Materials for Li Ion Batteries. J. Power Sources 2007, 172, 379−387.
(2) Salker, A. V.; Gurav, S. M. Electronic and Catalytic Studies on Co1−xCuxMn2O4 for CO Oxidation. J. Mater. Sci. 2000, 35, 4713−
4719.
(3) Rios, E.; Gautier, J. L.; Poillerat, G.; Chartier, P. Mixed Valency Spinel Oxides of Transition Metals and Electrocatalysis: Case of the MnxCo3−xO4System. Electrochim. Acta 1998, 44, 1491−1497.
(4) Saadi, S.; Bouguelia, A.; Trari, M. Photoassisted Hydrogen Evolution over Spinel CuM2O4 (M= Al, Cr, Mn, Fe and Co).
Renewable Energy 2006, 31, 2245−2256.
(5) Lavela, P.; Tirado, J. L.; Vidal-Abarca, C. Sol−gel Preparation of Cobalt Manganese Mixed Oxides for Their Use as Electrode Materials in Lithium Cells. Electrochim. Acta 2007, 52, 7986−7995.
(6) Yokoyama, T.; Meguro, T.; Shimada, Y.; Tatami, J.; Komeya, K.; Abe, Y. Preparation and Electrical Properties of Sintered Oxides Composed of Mn1. 5Co(0.25+X)Ni(1.25‑X)O4(0 ≤ X ≤ 0.75) with a Cubic
Spinel Structure. J. Mater. Sci. 2007, 42, 5860−5866.
(7) Rousset, A.; Tenailleau, C.; Dufour, P.; Bordeneuve, H.; Pasquet, I.; Guillemet-Fritsch, S.; Poulain, V.; Schuurman, S. Electrical Properties of Mn3‑xCoxO4 (0 ≤ x ≤ 3) Ceramics: An Interesting
System for Negative Temperature Coefficient Thermistors. Int. J. Appl.
Ceram. Technol. 2013, 10, 175−185.
(8) Elbadraoui, E.; Baudour, J. L.; Bouree, F.; Gillot, B.; Fritsch, S.; Rousset, A. Cation Distribution and Mechanism of Electrical Conduction in Nickel-copper Manganite Spinels. Solid State Ionics 1997, 93, 219−225.
(9) Bordeneuve, H.; Tenailleau, C.; Guillemet-Fritsch, S.; Smith, R.; Suard, E.; Rousset, A. Structural Variations and Cation Distributions in Mn3−xCoxO4(0≤ x≤ 3) Dense Ceramics Using Neutron Diffraction
Data. Solid State Sci. 2010, 12, 379−386.
(10) Schmidt, R.; Basu, A.; Brinkman, A. W. Small Polaron Hopping in Spinel Manganates. Phys. Rev. B: Condens. Matter Mater. Phys. 2005,
72, 115101.
(11) Bordeneuve, B.; Guillemet-Fritsch, S.; Rousset, A.; Schuurman, S.; Poulain, V. Structure and Electrical Properties of Single-phase Cobalt Manganese Oxide Spinels Mn3−xCoxO4Sintered Classically and
by Spark Plasma Sintering (SPS). J. Solid State Chem. 2009, 182, 396− 401.
(12) Shklovskii, B. I.; Efros, A. L. Electronic Properties of Doped
Semiconductors; Springer-Verlag: Berlin Heidelberg, 1984.
(13) Mansfield, R. Hopping Transport in Solids; Elsevier Science: Amsterdam, 1991.
(14) Schmidt, R.; Basu, A.; Brinkman, A. W.; Klusek, Z.; Datta, P. K. Electron-hopping Modes in NiMn(2)O(4+δ)Materials. Appl. Phys. Lett.
2005, 86, 073501.
(15) He, L.; Ling, Z. Studies of Temperature Dependent ac Impedance of a Negative Temperature Coefficient Mn-Co-Ni-O Thin Film Thermistor. Appl. Phys. Lett. 2011, 98, 242112.
(16) Zheng, H.; Weng, W. J.; Han, G. R.; Du, P. Y. Colossal Permittivity and Variable-range-hopping Conduction of Polarons in Ni0. 5Zn0.5Fe2O4Ceramic. J. Phys. Chem. C 2013, 117, 12966−12972.
(17) Han, H. S.; Davis, C.; Nino, J. C. Variable Range Hopping Conduction in BaTiO3 Ceramics Exhibiting Colossal Permittivity. J.
Phys. Chem. C 2014, 118, 9137−9142.
(18) Mott, N. F.; Davis, E. A. Electronic Processes in Non-Crystalline
Materials; Oxford University Press: Oxford, U.K., 2013.
(19) Zhang, L.; Tang, Z. J. Polaron Relaxation and Variable-range-hopping Conductivity in the Giant-dielectric-constant Material CaCu3Ti4O12. Phys. Rev. B: Condens. Matter Mater. Phys. 2004, 70,