HAL Id: hal-02361275
https://hal.archives-ouvertes.fr/hal-02361275
Submitted on 13 Nov 2019
HAL is a multi-disciplinary open access
archive for the deposit and dissemination of
sci-entific research documents, whether they are
pub-lished or not. The documents may come from
teaching and research institutions in France or
abroad, or from public or private research centers.
L’archive ouverte pluridisciplinaire HAL, est
destinée au dépôt et à la diffusion de documents
scientifiques de niveau recherche, publiés ou non,
émanant des établissements d’enseignement et de
recherche français ou étrangers, des laboratoires
publics ou privés.
Model driven programming of autonomous floats for
multidisciplinary monitoring of the oceans
Sébastien Bonnieux, Sébastien Mosser, Mireille Blay-Fornarino, Yann Hello,
Guust Nolet
To cite this version:
Sébastien Bonnieux, Sébastien Mosser, Mireille Blay-Fornarino, Yann Hello, Guust Nolet. Model
driven programming of autonomous floats for multidisciplinary monitoring of the oceans. OCEANS
2019 - Marseille, Jun 2019, Marseille, France. pp.1-10, �10.1109/OCEANSE.2019.8867453�.
�hal-02361275�
Model driven programming of autonomous floats
for multidisciplinary monitoring of the oceans
S´ebastien Bonnieux
I3S, Geoazur*Universit´e Cˆote d’Azur, CNRS,*OCA,*IRD
Valbonne, France bonnieux@i3s.unice.fr
S´ebastien Mosser
Universit´e du Qu´ebec `a Montr´ealMontr´eal, Canada mosser.sebastien@uqam.ca
Mireille Blay-Fornarino
I3SUniversit´e Cˆote d’Azur, CNRS Valbonne, France mireille.blay@unice.fr
Yann Hello
Geoazur
Universit´e Cˆote d’Azur, CNRS, OCA, IRD Valbonne, France
yann.hello@geoazur.unice.fr
Guust Nolet
GeoazurUniversit´e Cˆote d’Azur, CNRS, OCA, IRD Valbonne, France
nolet@geoazur.unice.fr
Abstract—Monitoring of the oceans with autonomous floats is of great interest for many disciplines. Monitoring on a global scale needs a multidisciplinary approach to be affordable. For this purpose, we propose an approach that allows oceanographers from different specialities to develop applications for autonomous floats. However, developing such applications usually requires expertise in embedded systems, and they must be reliable and efficient with regards to the limited resources of the floats (e.g., energy, processing power). We have followed a Model Driven Engineering approach composed of i) a Domain Specific Language to allow oceanographers to develop applications, ii) analysis tools to ensure that applications are efficient and reliable, iii) a composition tool to allow the deployment of different applications on a same float, and iv) a code generator that produce efficient and reliable code for the float. We present our approach with a biological and a seismological application. We validate it with technical metrics and an experiment.
Index Terms—Model Driven Engineering, Domain Specific Language, embedded system, constrained resources
I. INTRODUCTION
Autonomous floats [1] are instruments designed to monitor the oceans over long periods, as it is done for several years by the Argo project [2]. These instruments drift at several thousands of meters (e.g., 2000 meters) for several days (e.g., 10 days) to conduct measurements and transmit the collected data at the surface through satellite communication. Global acoustic monitoring of the oceans with autonomous floats is of great interests for the Passive Acoustic Monitoring (PAM) community [3] but efforts are spread among the different specialties such as i) biologists with cetacean click detection applications [4], ii) meteorologists with rainfall detection [5] or iii) seismologists with earthquake detection [6].
Large-scale experiments have already begun in the field of seismology [7]. However, acoustic monitoring of the oceans on a global scale cannot be done without a multidisciplinary
This work was funded by Region Sud and OSEAN S.A.S through a PhD grant (Emplois Jeunes Doctorants).
collaboration. Indeed, even if the cost of one float is low compared to other solutions (e.g., moored buoys), an array of floats at the global scale is still expensive.
Our approach is to bring different monitoring efforts to-gether with an adaptive float on which several applications can be installed. In this article, we focus on applications for passive acoustic monitoring of the oceans with a hydrophone, but a float can include other arbitrary sensors for physical, or chemical measurements, bringing together a broader commu-nity.
There are actually no standard applications in the PAM com-munity, each speciality has different needs that may change over time. But developing such applications by traditional means takes a lot of time and is expensive. Therefore, we want to give oceanographers, the capacity to write applications by themselves with a minimum of effort. Moreover, we want to give them the guarantee that applications will work correctly on the instrument, that they are reliable.
A float has typically four states of operations: the descent, the park, the ascent and the surface. It uses actuators to regulate it depth and uses communication devices at the surface. The applications define the depth and duration of a dive, and the measurements to realize and transmit by satellite. These have an impact on the battery lifetime and on the communication costs. Thus, we want to help oceanographers to take these properties into consideration such that they can produce efficient applications.
II. CHALLENGES
We illustrate our problem with an example: assume that two oceanographers, a geoscientist and a biologist, want to develop their own applications, the seismic application and the whales applications that will be installed together on the same instrument.
The seismic application consists of continuously listening to the acoustic signal received by the hydrophone during the
Fig. 1. Modeling of applications.
park state of the float. If a change is detected in the acoustic signal, an algorithm determines if the change corresponds to a seismic wave; then, depending on the level of confidence, the signal may be recorded for satellite transmission, and the application may command the float to ascend.
The whales application consists of listening to the acoustic signal during a short time at a fixed time interval (e.g., an acquisition of 5 minutes every 15 minutes). For each acqui-sition, an algorithm determines the probability of presence of whales that is further transmitted by satellite. This application is activated during the descent, park and ascent states of the float.
From this example, we identify three challenges. The first challenge is to allow oceanographers to develop applications for the float by themselves, without the help of embedded software experts (C1). Indeed, developing such applications requires skills in embedded software to program the micropro-cessor and to define a software architecture [8]. For example, the seismic and the whales applications must be implemented as tasks with appropriate execution priority and synchronisa-tion mechanisms to access data from the hydrophone.
The second challenge is to help the production of efficient and reliable applications (C2). For that purpose, we want to help oceanographers to consider the battery lifetime, the satellite communication costs and execution time constraints, indeed if an application does not respect these constraints, data from the hydrophone could be altered. Computing these properties requires specific knowledge and analysis methods
that are not in the domain of expertise of our developers, the oceanographers.
The third challenge is to allow several applications defined separately to be executed on the same instrument (C3). Since the applications operate concurrently, they must share the func-tionalities of the instrument. In the example, the applications must share the data coming from the hydrophone, as well as the processing time of the processor.
III. MODELS OF APPLICATIONS
A. Overview
To overcome these challenges, we propose a Model Driven Engineering (MDE) [9], [10], [11] approach, illustrated in figure 1 and described below:
(1) Developers describe applications using a Domain Spe-cific Language (DSL) [12] called MeLa, that stands for Mermaid Language, where Mermaid is the name of the float targeted by this contribution. The MeLa language responds to C1, by allowing oceanographers to express applications for the instrument. Applications expressed with the MeLa language are transformed into models with a specialized tool (i.e., the parser).
(2) These models are conform to a dedicated meta-model. To manage the dependency on the platform itself, that is the float, the application models use a platform model, itself conform to a meta-model. The dependency between these models is supported by the relation between the application meta-model and the platform meta-model. The platform model
contains information about available functions and sensors and the amount of resources they use (e.g., processing time or power consumption). Models and meta-models are the backbone for processing the applications.
(3) The analysis tool uses the application models and associated platform model to compute the battery lifetime, the satellite communication costs and verify real-time constraints of the applications. The results of the analysis are returned to the developer so that she can modify the application accordingly, this responds to C2.
(4) The composition tool aims to merge several applications into a single one, responding to C3. The developer can look at the composition results with the MeLa code generated from the model.
(5) To deploy these applications on the instrument, the platform specific code is generated from the model; this code follows an architecture defined in the platform meta-model. This part is linked to C1, by allowing the deployment of applications on the float, to C2, by producing efficient and reliable code, and to C3, by allowing the concurrent execution of applications.
In the next sections we present the MeLa DSL, then we describe the architecture of the generated code, and finally we give an overview of the analysis and composition methods implemented in the tools processing the applications. B. Introduction to MeLa
The goal of MeLa is to allow developers to write applica-tions using features of the instrument without having to worry about details of embedded software development.
Such features include: defining the depth and duration of a dive, choosing a sensor among those available, a procedure to acquire the data (e.g., continuously for the seismic application or during a short time for the whales application), the algo-rithms to process the data, selecting data to record for satellite transmission, or for a later recovery of the float, and requesting the float to ascend according to results of data processing.
The language does not allow for the definition of new pro-cessing algorithms; however, common propro-cessing algorithms such as filters or Fourier transforms are accessible at the level of the platform model in the form of a library of functions. C. Description of MeLa
We chose to describe the language through examples intro-duced in the motivation part. The MeLa code for those two applications is given in table I. An application written in MeLa consists of different parts1:
(1) A mission configuration, Mission (lines s2, w2)2, that
contains the park time and depth of the float.
(2) A coordinator, Coordinator (lines s7, w7), that defines politics of activation of acquisition modes. Acquisition modes can be executed according to the active state of the
1The parts are identified in the comments of the table (e.g., # 1.) 2Reference to line numbers are given with an s for the seismic application and a w for the whales application (e.g., s1, w1).
float (descent, park or ascent) and a period of execution can be given for short time acquisition (lines w9-w13).
(3) One or more acquisition modes. There are of two types, ContinuousAcqMode and ShortAcqMode (lines s12, w16). The first one corresponds to the continuous acquisition of the seismic application, the second one corresponds to the short acquisition of the whales application. For the first one the sensor is always active, whereas for the second one the sensor is stopped after the acquisition. The seismic application uses a continuous acquisition mode because it aims to detect the beginning of a seismic signal. The whales application does not have this constraint, and choosing a short acquisition mode allows to save the batteries. An acquisition mode is constituted of different parts:
(3.a) The Input (lines s15, w19) is associated to a sensor and a variable containing the data to process. In this contri-bution, we consider only periodic sensors (i.e., sensors that send samples periodically), in this case a hydrophone. The input variable, an array with a size chosen by the developer, receives the data from the sensors.
(3.b) The Variables (lines s20, w24) part contains a list of variables. They are only accessible from the acquisition mode to which they belong. There are several variable types available, for example, the type transmitFile allows to define a file transmitted through satellite.
(3.c) The sequences of instructions (lines s27, s36, w30) contains the instructions to process the data. The first sequence defined in an application (lines s27, w30) is executed each time the array defined in the Input is full. Sequences of instructions can be of two types, RealTimeSequence or ProcessingSequence. A real-time sequence (line s27) has an execution time constraint to guarantee the continuous acquisition of the acoustic signal. A processing sequence (lines s36, w30) has no execution time constraint, thus it can contain algorithms with a long execution time. A real-time sequence can call a processing sequence (line s32), but in that case the data possibly sent by the sensor are ignored, so that the input variable containing the data can be used.
(4) An instruction can be a function call or a condition. Functions allow to use algorithms (lines s29, w31), to record data (lines s40, w34, w36) or to request the float to ascend (line s44). Conditions allow to call different instructions depending on variable values. Conditions must be annotated with an average probability of execution (lines s31, w32). For example, we specify line s31, that the condition is true with an average of ten per weeks. This condition is true if a signal that could have a seismic origin is detected by the seisDetection algorithm. The @ stands for annotation. The annotations do not change the behaviour of the code but are used to estimate the energy consumption of applications and quantity of data recorded in memory for satellite trans-mission. It is up to the user to choose values in accordance with realistic expectations.
TABLE I
MELA CODE FOR THE SEISMIC AND WHALES APPLICATIONS.
Seismic application Whales application
1 # 1 . M i s s i o n c o n f i g u r a t i o n 2 M i s s i o n : 3 ParkTime : 10 d a y s ; 4 ParkDepth : 1500 m e t e r s ; 5 6 # 2 . C o o r d i n a t i o n o f a c q u i s i t i o n modes 7 C o o r d i n a t o r : 8 ParkAcqModes : 9 S e i s m i c ; 10 11 # 3 . D e f i n i t i o n o f a c o n t i n u o u s a c q u i s i t i o n mode 12 ContinuousAcqMode S e i s m i c : 13 14 # 3 . a . I n p u t 15 I n p u t : 16 s e n s o r : H y d r o p h o n e ; 17 d a t a : x [ 4 0 ] ; 18 19 # 3 . b . V a r i a b l e s 20 V a r i a b l e s : 21 i n t [ 2 4 0 0 ] l a s t m i n u t e ; 22 b o o l d e t e c t ; 23 f l o a t c r i t e r i o n ; 24 t r a n s m i t F i l e f ; 25 26 # 3 . c . S e q u e n c e s o f i n s t r u c t i o n s 27 RealTimeSequence d e t e c t i o n : 28 a p p e n d A r r a y ( l a s t m i n u t e , x ) ; 29 d e t e c t = s e i s D e t e c t i o n ( x ) ; 30 i f d e t e c t : 31 @ p r o b a b i l i t y = 10 p e r week 32 c a l l d i s c r i m i n a t e ; 33 e n d i f ; 34 e n d s e q ; 35 36 P r o c e s s i n g S e q u e n c e d i s c r i m i n a t e : 37 c r i t e r i o n = s e i s D i s c r i m i n a t i o n ( l a s t m i n u t e ) ; 38 i f c r i t e r i o n > 0 . 2 5 : 39 @ p r o b a b i l i t y = 4 p e r week 40 r e c o r d I n t A r r a y ( f , l a s t m i n u t e ) ; 41 e n d i f ; 42 i f c r i t e r i o n > 0 . 7 5 : 43 @ p r o b a b i l i t y = 1 p e r week 44 a s c e n t ( ) ; 45 e n d i f ; 46 e n d s e q ; 47 48 endmode ; 1 # 1 . M i s s i o n c o n f i g u r a t i o n 2 M i s s i o n : 3 ParkTime : 20 d a y s ; 4 ParkDepth : 1000 m e t e r s ; 5 6 # 2 . C o o r d i n a t i o n o f a c q u i s i t i o n modes 7 C o o r d i n a t o r : 8 DescentAcqModes : 9 Whales e v e r y 10 m i n u t e s ; 10 ParkAcqModes : 11 Whales e v e r y 3 h o u r s ; 12 AscentAcqModes : 13 Whales e v e r y 10 m i n u t e s ; 14 15 # 3 . D e f i n i t i o n o f a s h o r t a c q u i s i t i o n mode 16 ShortAcqMode Whales : 17 18 # 3 . a . I n p u t 19 I n p u t : 20 s e n s o r : H y d r o p h o n e ; 21 d a t a : x [ 1 0 2 4 ] ; 22 23 # 3 . b . V a r i a b l e s 24 V a r i a b l e s : 25 f l o a t p r e s e n c e ; 26 i n t t i m e s t a m p ; 27 t r a n s m i t F i l e f ; 28 29 # 3 . c . S e q u e n c e s o f i n s t r u c t i o n s 30 P r o c e s s i n g S e q u e n c e i d e n t i f y : 31 p r e s e n c e = w h a l e s D e t e c t i o n ( x ) ; 32 i f p r e s e n c e > 0 . 2 : 33 @ p r o b a b i l i t y = 1 p e r day 34 r e c o r d F l o a t ( f , p r e s e n c e ) ; 35 t i m e s t a m p = g e t T i m e s t a m p ( ) 36 r e c o r d I n t ( f , t i m e s t a m p ) ; 37 e n d i f ; 38 e n d s e q ; 39 40 endmode ; D. Platform model
Function prototypes and models of sensors are defined in the platform model. Each function prototype is defined by a name (i.e., the name of the function), a list of parameters types and a return type. They also contain information about their resource usage, like power consumption, memory usage or execution time (processor usage), that can depend on parameters passed to a function when it is called. Some information represent the capacity of a function to request the float to ascend. The models of sensors can contain specific information, for example, the model of the hydrophone contains its sampling period. Moreover the platform model contains information about available resources of the instrument. This information is used to compute energy consumption, cost of satellite transmission and execution time constraints.
The platform model also has the advantage to enable the use of different platform configurations without having to change the MeLa application. For example, if the processor used by
the float is changed, the MeLa code remains valid. It is up to experts in embedded software to create a new platform model with adapted code generation.
E. Code generation
The code for the platform is generated from the application models and the platform model. In this subsection we describe the correspondence between the MeLa language and the gen-erated code for which we have defined a suitable architecture. Before that, we describe in more detail the design of the instrument.
A Mermaid float contains two electronic boards, i) a con-trol board that manages the actuators, the localization and the satellite communication and ii) an acquisition board for accessing sensors and processing data. They can communicate such that the acquisition board can request the float to ascend and send data through satellite communication, and the control board can provide information about the state of the float.
Fig. 2. Code generation from MeLa applications.
The acquisition board is based on a single-core processor, and contains a real-time operating system with a priority based preemptive scheduling policy, allowing the applications defined with the MeLa language to be executed concurrently. The code generation from models is illustrated in Figure 2. The mission configuration is used to generate a configura-tion file containing commands for the control board (e.g., stage 1500m 10000min). The rest of the application is used to generate the code for the acquisition board. The coordinator is converted to a task containing a state machine (i.e., a model of computation) reacting to messages sent by the control board and managing the execution of acquisition modes. Each acquisition mode is converted to a processing task containing the sequences of instructions defined in the MeLa language. Moreover, a sensor task receiving data from sensors (one task for one sensor) is configured for each acquisition mode using the sensor. A sensor task handles the data sent by a sensor, fills the input variables of processing tasks using the sensor, and triggers their execution when their input variable is full. Global variables, not presented in the figure, are used to share data between tasks.
A priority of execution is assigned to each task. The highest priority is assigned to tasks with the shortest period, that is a rate-monotonic priority assignment [13]. For a continuous acquisition mode, the period of the task is the sampling period of the sensor multiplied by the size of the input variable. This priority is only used for the execution of the real-time sequence. The processing sequence of a continuous acquisition mode has a fixed low priority and is executed in background. For a short acquisition mode the period of the task corresponds to the periodicity defined in the coordinator.
For schedulability analysis, presented in the next section, we assume that tasks are independent. When possible, we
implement the functions such that tasks can be executed concurrently, without interfering. If not, the execution time of functions must be estimated to take possible interferences into account.
F. Analysis
The analysis computes properties of the applications from the information contained in the application models and the platform model. Since the models of applications are created from the MeLa language, results of analysis can be reported to the developer with a reference to the MeLa code.
To determine if the tasks are schedulable their worst case execution time is computed from the model. Then, knowing their period of execution, their processor utilization rate (e.g: 2%, 50%, 120%) is computed. Finally, we use the Liu and Layland utilization bound [13], a schedulability test for the rate monotonic scheduling algorithm. The Liu and Layland utilization bound gives the maximum processor utilization rate for a set of tasks (e.g., 100% for one task, 83% for two tasks) that guarantee the schedulability of tasks. This test is only valid if the scheduling algorithm is optimal, that is if the tasks have a deadline equal to their period, and if they are independent from each other. Both conditions are verified since we made the assumption in the preceding section that tasks are independent. The battery lifetime is estimated in several steps: i) power consumption of each acquisition mode is computed from each instruction, probabilities defined in conditions, sampling frequencies of sensors and periods defined in the coordinator, ii) power consumption of each state of the float is computed according to activated acquisition modes, input sensors used by acquisition modes, sleep time of the processor and actu-ators utilization for depth regulation (e.g: ascent or descent), iii) energy consumption of each state is computed from their power consumption and their duration, which depends on probabilities of ascent request for the park state, iv) the energy for each float cycle is obtained by summing up the energy of each state, including the surface step which consumes energy for satellite transmission, v) knowing the battery capacity, the duration of a cycle, and the consumption of each cycle, the battery lifetime can be estimated.
The last property to estimate is the satellite transmission cost. To this end, the quantity of data recorded in files of type transmitFile is computed from variables passed as parameters of recording functions.
The analysis results are displayed to the developer with more or less details. For example, if the processor utilization rate is above the Liu and Layland utilization bound, an error is displayed with the instruction having the strongest impact on processor utilization. The same can be done for the battery lifetime and the satellite transmission costs. This allows the developer to identify parts of the MeLa code that contribute the most to processor utilization, energy consumption or satellite transmission costs.
G. Composition
The composition of applications is done at the model level. To be composed, the mission configuration of the two
applica-TABLE II COMPOSED APPLICATION. 1 # 1 . M i s s i o n c o n f i g u r a t i o n 2 M i s s i o n : 3 ParkTime : 10 d a y s ; 4 ParkDepth : 1500 m e t e r s ; 5 6 # 2 . C o o r d i n a t i o n o f a c q u i s i t i o n modes 7 C o o r d i n a t o r : 8 DescentAcqModes : 9 Whales e v e r y 10 m i n u t e ; 10 ParkAcqModes : 11 S e i s m i c ; 12 Whales e v e r y 3 h o u r s ; 13 AscentAcqModes : 14 Whales e v e r y 10 m i n u t e ; 15 16 # 3 . A c q u i s i t i o n modes 17 ContinuousAcqMode S e i s m i c : 18 # C o n t e n t i d e n t i c a l t o t h e o r i g i n a l a p p l i c a t i o n 19 endmode ; 20 21 ShortAcqMode Whales : 22 # C o n t e n t i d e n t i c a l t o t h e o r i g i n a l a p p l i c a t i o n 23 endmode ;
tions must be the same. Acquisition modes of each application are copied into the composed application with their politics of activation defined in the coordinator. Concurrent execution of acquisition modes is handled at the implementation level with schedulable tasks. The MeLa code generated from the composition of the seismic and whales applications is shown in table II.
IV. VALIDATION
A. Introduction to validation
In this section, we show that our approach responds to the three challenges defined in the motivation section. We focus on technical metrics and present results of an experiment.
Tools and meta-models presented on figure 1 are imple-mented in Java. The syntax of the MeLa language and asso-ciated tooling are created with ANTLR [14]. The generated code has been deployed on an acquisition board in a controlled environment. The experimental setup is described below. B. Experimental setup
The seismic and whales applications are tested on a test bench (figure 3). The acquisition board (1) is powered with a 9 V alkaline battery (2). A computer (3) emulates seismic and whales signals, sent to the acquisition board with an audio sound card (4). It is also used to monitor the execution of applications through a serial communication port (5), and record the voltage of the battery with an Arduino board (6).
Seismic events are emulated with a 1 Hz signal, or 2 Hz for major events triggering the ascent of the float. Each event has a fixed duration of 30 seconds. We generate four events every hour. One of these events is randomly chosen to be a major event. The algorithm to detect seismic events seisDetection (line s29 in table I) is implemented as an absolute average of the last forty samples send by the hydrophone, and stored in the input variable (line s17). The average is compared to a threshold. When the value of the
Fig. 3. Experimental setup.
average pass under the threshold, the detect boolean is set to true(detection on the falling edge of the average). This trig-gers the execution of the processing sequence that identifies if the signal has a seismic origin. The seisDiscrimination algorithm is implemented as a Fourier transforms processing the last minute of signal (the lastminute variable). This algorithm returns a criterion which represents the level of confidence of the seismic origin of the signal. If the spectrum amplitude at 1 Hz or 2 Hz is above a threshold, the criterion is set respectively to 0.5 and 0.9. If the criterion is above 0.25, the last minute of signal is recorded, and if the criterion is above 0.75, the application requests an ascent (lines s38, s42). Whales events are emulated with a frequency of 10 Hz and a lower amplitude than seismic events so that the signals do not interfere with the detection of seismic events. As for the seismic application, whales events have a fixed time of 30 seconds. The whalesDetection algorithm is also implemented using a Fourier transform, processing the signal acquired during a short time. If the spectrum amplitude at 10 Hz is above a threshold, the algorithm returns a probability of presence equal to 1, triggering the recording of the value and of a timestamp (line w32).
The seismic application is executed continuously during the park state and the whales application is executed every 30s during the descent, park and ascent state. The behavior of the float is simulated by the acquisition board. We define a park time of one hour, shortened if the seismic application request to ascend. The ascent time and the descent time are fixed to 2 minutes and the surface time to 1 minute.
C. Functional validation
The two applications have been tested, first independently, and then after composition to verify if both applications behave as expected. The applications have worked correctly, seismic and whales events have been recorded. This shows that the language can be used to develop applications for the float (C1)
TABLE III
MELA CODE COMPARED TO GENERATED CODE.
MeLa code C 1 ContinuousAcqMode S i m p l e : 2 3 I n p u t : 4 s e n s o r : H y d r o p h o n e ; 5 d a t a : x [ 1 0 ] ; 6 7 V a r i a b l e s : 8 i n t y ; 9 10 RealTimeSequence : 11 y = mean ( x , 1 0 ) ; 12 e n d s e q ; 13 14 endmode ; 1 / / S e n s o r t a s k− h y d r o p h o n e . c 2 v o i d h y d r o p h o n e t a s k ( v o i d * p a r a m e t e r s ){ 3 w a i t E x t I n t ( a d c o n v e r t e r . d r d y e i n t i d ) ; 4 x s i m p l e f i l l −>d a t a [ x s i m p l e f i l l −>i ] = r e a d s a m p l e ( ) ; 5 x s i m p l e f i l l −>i += 1 ; 6 i f ( x s i m p l e f i l l −>i s F u l l ) { 7 i f ( x s i m p l e f i l l == &x s i m p l e b u f f 1 ) { 8 x s i m p l e p r o c e s s = &x s i m p l e b u f f 1 ; 9 x s i m p l e f i l l = &x s i m p l e b u f f 2 ; 10 } e l s e { 11 x s i m p l e p r o c e s s = &x s i m p l e b u f f 2 ; 12 x s i m p l e f i l l = &x s i m p l e b u f f 1 ; 13 } 14 s e m a p h o r e S i g n a l ( s i m p l e S e m a p h o r e ) ; 15 } 16 } 17 18 / / G l o b a l v a r i a b l e s − g l o b a l . c 19 i n t 3 2 a r r a y t * x s i m p l e f i l l ; 20 i n t 3 2 a r r a y t * x s i m p l e p r o c e s s ; 21 i n t 3 2 t x s i m p l e 1 [ 1 0 ] ; 22 i n t 3 2 a r r a y t x s i m p l e b u f f 1 = { x s i m p l e 1 , 0 , 1 0 , f a l s e } ; 23 i n t 3 2 t x s i m p l e 2 [ 1 0 ] ; 24 i n t 3 2 a r r a y t s i m p l e x b u f f 2 = { x s i m p l e 2 , 0 , 1 0 , f a l s e } ; 25 26 / / P r o c e s s i n g t a s k− s i m p l e t a s k . c 27 s t a t i c i n t 3 2 t y ; 28 v o i d s i m p l e t a s k ( v o i d * p a r a m e t e r s ){ 29 w h i l e ( 1 ) { 30 s e m a p h o r e W a i t ( s i m p l e S e m a p h o r e ) ; 31 y = mean ( x s i m p l e p r o c e s s , 1 0 ) ; 32 } 33 }
and that several applications can be deployed on the same float and share its functionalities (C3).
D. Reduction of expertise
When an application is written in MeLa, the developer does not have to consider the control board and the acquisition board. The development of acquisition modes does not require to think about embedded software concerns, for example defining tasks, their initialization, their execution priority, the way they are started and stopped or the synchronization between tasks receiving data from sensors and tasks processing the data. Thus, the MeLa language hides several embedded software concerns.
Table III illustrates the reduction of expertise given by the MeLa language compared to the generated code. This table presents the generation of an acquisition mode into a sensor task and a processing task, as shown in figure 2. For that purpose, we use a simple application that reads data from the hydrophone and computes an average. The Input part of the MeLa code generates the sensor task. This task waits for data from the hydrophone. When the hydrophone is ready to send data, it sends a signal to the processor (a hardware interrupt) that triggers the execution of the sensor task (line c3)3.
The input variable (line m5) is generated as two array of data (lines c19-c24). One is filled by the sensor task (line c4), while the other one is processed by the processing
3Reference to line numbers are given with an m for the MeLa code and a cfor the C code (e.g., m1, c1).
task (line c31). When the x_simple_fill array is full (line c6), the array is switched with x_simple_process (lines c7-c13) and the execution of the processing task is triggered with a signal (line c14). The RealTimeSequence part of the acquisition mode is converted in a processing task (lines c28-c33), that is waiting for the sensor task (line 30). The Variables part is converted to local variables contained in the task (line 27). In the application written in MeLa, the developer only defines the input sensor, the input variable, and the algorithm to use. She can focus on the behavior of applications rather than on embedded software concerns.
Another way to estimate the reduction expertise is to compare the amount of code to write in MeLa, with the amount of generated code, that would be written manually. Looking at the total number of lines of the composed application, one has to write 90 lines of code in MeLa, while 600 lines must be written to develop the application with the C language.
By hiding embedded software concerns and reducing the amount of code to write, the MeLa language allows oceanogra-phers to develop applications for the float by themselves (C1). Moreover, generating a code tailored for the MeLa applications helps to produce efficient and reliable applications (C2). For example, in MeLa the sensors are automatically shut down when they are not used. In C, this behavior must be written by the developer.
TABLE IV
MODEL ESTIMATIONS COMPARED TO MEASUREMENTS. Application Battery lifetime Recorded data
Estimation Measure Estimation Measure Seismic 14 h 15 h 35 kB/h 36 kB/h Whales 22 h 20 h 79 B/h 72 B/h Composed 14 h 13 h 35 kB/h 32 kB/h
E. Analysis validation
In this subsection we show that analysis results are con-sistent with experiments so that they can be used to produce efficient and reliable applications (C2). We compare the esti-mation from the model with measurement performed on the acquisition board. We do this comparison for the seismic and the whales applications independently and for the composition of both applications.
For the model estimation, probabilities defined in the ap-plications must be coherent with the expected behavior of the deployed applications. Thus, for our experimental setup, the probability to detect and record a seismic event is set to 4 per hour (lines s31, s39 in table I), and the probability of ascent request is set to 1 per hour (line s43). For the whales application, the probability of presence of whales is set to 10 per hour (line w33).
We measure the battery lifetime by measuring the voltage of the battery. When the voltage passes under 6 V the battery is considered as discharged. Instead of giving a cost for satellite transmission, we measure the size of files that would have been transmitted. We do not measure the utilization of the processor since the processor utilization is too low in our experiment to be measured efficiently.
Results for the battery lifetime in hours, and amount of recorded data in bytes and kilobytes per hour, are presented in table IV. The seismic and composed applications have similar power consumption. This is because both seismic and whales applications use the same sensor and the sensor is always switched on for the seismic application. For the whales application alone, the sensor is regularly switched off, giving more autonomy.
Differences of 10% are observed between estimations and measurements of the battery lifetime. For recorded data, the estimations fit well with measurements because probabilities annotated in the applications are consistent with the reality. The precision of these estimations are enough to detect if an application will drain the battery rapidly (e.g., 3 years instead of 5 years), or if the amount of transmitted data will exceed the budget limits (e.g., 20 MB instead of 10 MB).
F. Produce efficient applications
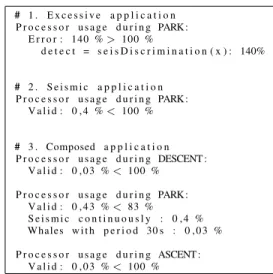
In table V we show different results of scheduling analysis for three applications.
(1) The excessive application can be viewed as a first attempt of the seismic application. For this attempt, the discrimination algorithm is put in the real-time sequence, and the input vari-able is set to a size of 1 instead of 40 (i.e., data: x[1];).
TABLE V
SCHEDULING ANALYSIS RESULTS
# 1 . E x c e s s i v e a p p l i c a t i o n P r o c e s s o r u s a g e d u r i n g PARK : E r r o r : 140 % > 100 % d e t e c t = s e i s D i s c r i m i n a t i o n ( x ) : 140% # 2 . S e i s m i c a p p l i c a t i o n P r o c e s s o r u s a g e d u r i n g PARK : V a l i d : 0 , 4 % < 100 % # 3 . Composed a p p l i c a t i o n P r o c e s s o r u s a g e d u r i n g DESCENT : V a l i d : 0 , 0 3 % < 100 % P r o c e s s o r u s a g e d u r i n g PARK : V a l i d : 0 , 4 3 % < 83 % S e i s m i c c o n t i n u o u s l y : 0 , 4 % Whales w i t h p e r i o d 30 s : 0 , 0 3 % P r o c e s s o r u s a g e d u r i n g ASCENT : V a l i d : 0 , 0 3 % < 100 %
The analysis displays an error to the developer telling him that the processor usage is above the maximum allowable and showing the responsible instruction. At this point some guidelines are necessary to help the developer to edit the application. There are only three possible choices, i) put the algorithm in a processing sequence and use a detection algorithm to trigger the processing sequence, ii) increase the size of the input variable to give more time to the processing, but it can also increase the processing time, iii) chose another algorithm in the library.
(2) The second analysis result is for the seismic application of our example. The developer has followed the first and second guidelines, such that the processor usage is reduced to almost zero.
(3) The third result is for the composed application. One can notice that the maximum processor usage is 83% which corresponds to the Liu and Layland utilization bound for 2 tasks.
In addition to guarantee that applications will work correctly on the instrument, the analysis results allow a developer to try different configurations. For example, she can try to record the raw acoustic signals containing the presence of whales and see the impact on battery lifetime and satellite transmission costs. Thus, the analysis results help the developers to produce efficient and reliable applications (C2).
V. LIMITATIONS AND PERSPECTIVES
The MeLa language has a limited expressiveness. For ex-ample, the politics of acquisition managed by the coordinator are limited to few concepts (i.e., periodic or continuous), a developer could want to use other kinds of sensors or to choose the sampling frequency of a hydrophone. However, the approach is flexible enough to add new features to the language.
The ability for applications to adapt to the environment and to have complex interactions with the float is currently
missing. For example, when a whale is detected, the monitor-ing period, the sensor samplmonitor-ing frequency or the algorithm parameters could be changed. Additionally, an application could ask the float to go to a specific depth or block any depth regulation during a certain amount of time. Several approaches exist to handle the adaptation of applications running concurrently on a same device with possible conflicts between them [15] but they must be adapted to our problem. Additional analysis capabilities could be added with new models of analysis. For example, analysis of volatile mem-ory usage could be added. Moreover, more precise analysis methods could improve accuracy of estimations. However, the main limit for accuracy lies in the definition of probabilities of execution by the developers. These probabilities are important to estimate the quantities of recorded data or the battery lifetime, but the developer may enter wrong information to the model, so that estimations will also be wrong. Simulation, based on experimental data recovered from experiments, could give accurate estimation; moreover, simulation could be used for functional validation of applications. Probabilities could also be measured on the instrument, after deployment, and then be used to correct the model.
The MeLa language is specific for programming the instru-ment, but is not conceived to create new algorithms. Thus, capabilities to design algorithms for the float could be added to MeLa. The algorithms could be organized in different categories with specific constraints, for example detection algorithms should behave as an impulse function to trigger the execution of processing sequences. Moreover, capabilities to develop Deep Learning algorithms could be added. They are well suited for classification problems, but deploying them on a constrained device is challenging [16].
Finally, the MeLa language could be extended to other domains of applications by adding features to handle actuators or displaying devices that have specific constraints. This would allow the development of a wide range of applications in the embedded software domain while keeping the efficiency and reliability demonstrated this article.
VI. STATE OF THE ART
We compare our work with approaches related to the development of embedded software.
Programming languages like Scilab-Xcos4 and
Matlab-Simulink5 are widely used in different domains and focus on
development of algorithms and modeling of physical systems. Code for embedded systems can be generated from these algo-rithms but they do not incorporate models used in embedded systems such as tasks, thus they cannot be used to develop entire applications.
Low-level programming languages such as C or Ada, and real-time operating systems [17], allow to develop applications that use the platform efficiently [18], but they need a specific expertise to be used. Our contribution generates such a code
4https://www.scilab.org/ 5https://www.mathworks.com/
to be implemented on the platform. Analysis of applications developed with these languages rely on tools that generate models from the code. The models can be annotated with tailored measurements [19], [20], or relies on generic models of processors [21]. The tools need a specific expertise to be used [22], our approach separates developers concerns from analysis, allowing them to focus on their applications.
Some operating systems for embedded systems consider resource consumption at runtime [23], [24]. They target energy harvesting systems (e.g., systems with solar panels). These systems have energy budget that changes over time (e.g., there is less energy during cloudy days). To handle this, the quality of algorithms is degraded depending on the available energy of the system at execution time. The floats do not have such constraints since they do not incorporate energy harvesting systems. Moreover, in these approaches the developer does not have an estimation of resource consumption during the development of applications.
Modeling languages like UML-MARTE [25] or AADL [26] are conceived for modeling different kinds of embedded systems, software and hardware included. They offer generic concepts for these domains. They are often used for the design of systems from high-level specifications that are refined several times until the implementation. Modeling languages offer high level abstractions that are too generic for our developer. Moreover, analysis tools on which they rely, like UPPAAL [27] or TimeSquare [28], require a specific expertise to be used.
DSL like CPAL [29] and MAUVE [30] are dedicated to programming cyber-physical systems and robots with a component-based approach. In these languages developers define components with desired inputs and outputs and a state machines to describe their internal behavior. Our acquisition modes can be viewed as components tailored for acquisition of data from sensors, thus, we offer a more specific abstraction to developers. For these languages it is up to the developer to measure the execution times of components and to put this information in the developed application. In our approach this information is hidden to developers in a platform model allowing them to focus on their applications. Moreover these approaches do not consider energy consumption or recording of data, which are critical for our instrument.
VII. CONCLUSIONS
In this paper, we have proposed a Model Driven Engineering approach to allow oceanographers from different specialities to develop applications for an autonomous float. We have presented a Domain Specific Language to allow them to develop their own applications without the help of experts in embedded systems. Estimation of battery lifetime, costs of satellite transmission and verification of execution time constraints helps the developers to write reliable and efficient applications. The application models can be composed such that several applications developed independently can be in-stalled on the same instrument. We have validated the approach with technical metrics and an experiment on a test bench.
In the long term, we envision a float that can be repro-grammed at distance. This, associated with the MeLa language would allow to use the float as a real experimental platform where developers could try several applications. But, this requires adapted over-the-air programming methods that save the use of the satellite communication, which is challenging because of the very high latency of this kind of network (about one second).
REFERENCES
[1] W. J. Gould, “From swallow floats to argothe development of neutrally buoyant floats,” Deep Sea Research Part II: Topical Studies in Oceanog-raphy, vol. 52, no. 3, pp. 529 – 543, 2005, direct observations of oceanic flow: A tribute to Walter Zenk.
[2] D. Roemmich, G. Johnson, S. Riser, R. Davis, J. Gilson, W. Brech-ner Owens, S. Garzoli, C. Schmid, and M. Ignaszewski, “The argo pro-gram observing the global ocean with profiling floats,” Oceanography, vol. 22, 06 2009.
[3] M. F. Baumgartner, K. M. Stafford, and G. Latha, Near Real-Time Underwater Passive Acoustic Monitoring of Natural and Anthropogenic Sounds. Cham: Springer International Publishing, 2018, pp. 203–226. [4] H. Matsumoto, C. R. Jones, H. Klinck, D. K. Mellinger, R. P. Dziak, and C. Meinig, “Tracking beaked whales with a passive acoustic profiler float.” The Journal of the Acoustical Society of America, vol. 133 2, pp. 731–40, 2013.
[5] B. B. Ma and J. Nystuen, “Passive acoustic detection and measurement of rainfall at sea,” Journal of Atmospheric and Oceanic Technology - J ATMOS OCEAN TECHNOL, vol. 22, pp. 1225–1248, 08 2005. [6] A. Sukhovich, S. Bonnieux, Y. Hello, J. O. Irisson, F. J. Simons, and
G. Nolet, “Seismic monitoring in the oceans by autonomous floats,” in Nature communications, 2015.
[7] G. Nolet, Y. Hello, S. van der Lee, S. Bonnieux, M. J. C. Ruiz, N. A. Pazmino, A. Deschamps, M. M. Regnier, Y. Font, Y. J. Chen, and F. J. Simons, “Imaging the gal´apagos mantle plume with an unconventional application of floating seismometers,” in Scientific Reports, 2019. [8] H. Gomaa, Real-Time Software Design for Embedded Systems.
Cam-bridge University Press, 2016.
[9] G. Mussbacher, D. Amyot, R. Breu, J.-M. Bruel, B. H. C. Cheng, P. Collet, B. Combemale, R. B. France, R. Heldal, J. H. Hill, J. Kienzle, M. Sch¨ottle, F. Steimann, D. R. Stikkolorum, and J. Whittle, “The rele-vance of model-driven engineering thirty years from now,” in MoDELS, 2014.
[10] D. C. Schmidt, “Guest editor’s introduction: Model-driven engineering,” Computer, vol. 39, pp. 25–31, 2006.
[11] S. Kent, “Model driven engineering,” in Proceedings of the Third International Conference on Integrated Formal Methods, ser. IFM ’02. London, UK, UK: Springer-Verlag, 2002, pp. 286–298.
[12] M. Fowler, Domain Specific Languages, 1st ed. Addison-Wesley Professional, 2010.
[13] C. L. Liu and J. W. Layland, “Scheduling algorithms for multiprogram-ming in a hard-real-time environment,” J. ACM, vol. 20, pp. 46–61, 1973.
[14] T. J. Parr and R. W. Quong, “Antlr: A predicated- ll(k) parser generator,” Softw., Pract. Exper., vol. 25, pp. 789–810, 1995.
[15] K. Kakousis, N. Paspallis, and G. A. Papadopoulos, “A survey of software adaptation in mobile and ubiquitous computing,” Enterprise Information Systems, vol. 4, no. 4, pp. 355–389, 2010.
[16] N. D. Lane, S. Bhattacharya, A. Mathur, P. Georgiev, C. Forlivesi, and F. Kawsar, “Squeezing deep learning into mobile and embedded devices,” IEEE Pervasive Computing, vol. 16, no. 3, pp. 82–88, 2017. [17] P. Gaur and M. P. Tahiliani, “Operating systems for iot devices: A critical
survey,” 2015 IEEE Region 10 Symposium, pp. 33–36, 2015. [18] R. Pereira, M. Couto, F. Ribeiro, R. Rua, J. Cunha, J. P. Fernandes, and
J. Saraiva, “Energy efficiency across programming languages: how do energy, time, and memory relate?” in SLE, 2017.
[19] P. Iyenghar and E. Pulverm¨uller, “A model-driven workflow for energy-aware scheduling analysis of iot-enabled use cases,” IEEE Internet of Things Journal, vol. 5, pp. 4914–4925, 2018.
[20] T. B. la Fosse, J.-M. Mottu, M. Tisi, J. Rocheteau, and G. Suny´e, “Characterizing a source code model with energy measurements,” in MeGSuS@ESEM, 2018.
[21] C. Ferdinand and R. Heckmann, “ait: Worst-case execution time pre-diction by static program analysis,” in Building the Information Society, R. Jacquart, Ed. Boston, MA: Springer US, 2004, pp. 377–383. [22] C. M. Woodside, G. Franks, and D. C. Petriu, “The future of software
performance engineering,” Future of Software Engineering (FOSE ’07), pp. 171–187, 2007.
[23] K. Lorincz, B.-r. Chen, J. Waterman, G. Werner-Allen, and M. Welsh, “Resource aware programming in the pixie os,” in Proceedings of the 6th ACM Conference on Embedded Network Sensor Systems, ser. SenSys ’08. New York, NY, USA: ACM, 2008, pp. 211–224.
[24] J. Sorber, A. Kostadinov, M. Garber, M. Brennan, M. D. Corner, and E. D. Berger, “Eon: A language and runtime system for perpetual sys-tems,” in Proceedings of the 5th International Conference on Embedded Networked Sensor Systems, ser. SenSys ’07. New York, NY, USA: ACM, 2007, pp. 161–174.
[25] O. M. Group, “Uml profile for marte: Modeling and analysis of real-time embedded systems,” 2011. [Online]. Available: https://www.omg.org/spec/MARTE/
[26] P. Feiler, D. Gluch, and J. Hudak, “The architecture analysis & design language (aadl): An introduction,” p. 145, 02 2006.
[27] K. G. Larsen, P. Pettersson, and W. Yi, “Uppaal in a nutshell,” Inter-national Journal on Software Tools for Technology Transfer, vol. 1, pp. 134–152, 1997.
[28] J. DeAntoni and F. Mallet, “Timesquare: treat your models with logical time,” in TOOLS, 2012.
[29] N. Navet and L. Fejoz, “Cpal: high-level abstractions for safe embedded systems,” in DSM@SPLASH, 2016.
[30] N. Gobillot, C. Lesire, and D. Doose, “A design and analysis method-ology for component-based real-time architectures of autonomous sys-tems,” Journal of Intelligent and Robotic Systems, pp. 1–16, 2018.