HAL Id: hal-02298423
https://hal.archives-ouvertes.fr/hal-02298423
Submitted on 26 Sep 2019HAL is a multi-disciplinary open access
archive for the deposit and dissemination of sci-entific research documents, whether they are pub-lished or not. The documents may come from teaching and research institutions in France or abroad, or from public or private research centers.
L’archive ouverte pluridisciplinaire HAL, est destinée au dépôt et à la diffusion de documents scientifiques de niveau recherche, publiés ou non, émanant des établissements d’enseignement et de recherche français ou étrangers, des laboratoires publics ou privés.
Redox paradox of vanadium in Tavorite LiVPO4F1-yOy
Edouard Boivin, Antonella Iadecola, François Fauth, Jean-Noël Chotard,
Christian Masquelier, Laurence Croguennec
To cite this version:
Edouard Boivin, Antonella Iadecola, François Fauth, Jean-Noël Chotard, Christian Masquelier, et al.. Redox paradox of vanadium in Tavorite LiVPO4F1-yOy. Chemistry of Materials, American Chemical Society, 2019, 31 (18), pp.7367-7376. �10.1021/acs.chemmater.9b01987�. �hal-02298423�
1
The redox paradox of Vanadium in Tavorite LiVPO
4F
1-yO
y.
Edouard Boivin a,b,c, Antonella Iadecola c, François Fauth d,Jean-Noël Chotard b,c,e, Christian Masquelier b,c,e and Laurence Croguennec a,c,e,1
a CNRS, Univ. Bordeaux, Bordeaux INP, ICMCB, UMR CNRS 5026, F-33600 Pessac, France. b Laboratoire de Réactivité et de Chimie des Solides, UMR CNRS 7314,
Université de Picardie Jules Verne, F-80039 Amiens Cedex 1, France.
c RS2E, Réseau Français sur le Stockage Electrochimique de l’Energie, FR CNRS 3459,
F-80039 Amiens Cedex 1, France.
d CELLS - ALBA synchrotron, E-08290 Cerdanyola del Vallès, Barcelona, Spain. eALISTORE-ERI European Research Institute, FR CNRS 3104, F-80039 Amiens Cedex 1, France.
Abstract:
Vanadyl-type defects in vanadium oxy-fluoride phosphates confer interesting properties to these materials as positive electrodes in Li-ion or Na-ion batteries. The influence of defects concentration on the phase diagram and redox mechanisms in LiVPO4F1-yOy Tavorite
phases has been investigated by combining operando Synchrotron X-ray powder diffraction (SXRPD) and X-ray absorption spectroscopy (XAS). Operando X-ray absorption near edge structure (XANES) reveals the activation of the V4+=O/V5+=O redox couple during the first step
of the charge, and then upon further Li+ extraction the activation of the V3+/V4+ redox couple
in fluorine-rich environments. This result, although surprising, is in full agreement with the operating voltages of the end-member phases, as LixVIII,IVPO4F operates at higher voltage than
LixVIV,VPO4O. The unexpected succession of these redox couples is observed for the first time
in the same material. The small volume changes undergone by the materials upon electrochemical operation were proposed to be at the origin of the better performance observed for the mixed valence samples: “freezing” of the framework is observed all along the activation of the V4+=O/V5+=O redox couple in a solid solution type domain.
2
Introduction
The increasing mobility of populations and the need to fight against global warming with the development of sustainable energies are two reasons for which electrochemical energy storage is one of the major topics for scientific research, both at the academic and industrial levels. Lithium-ion batteries are already largely used as an energy source for mobile devices such as smartphones, laptops, etc. Nevertheless, for applications such as electric and hybrid vehicles, the energy density delivered by these batteries cannot currently compete with fossil energy (limited autonomy in particular). Polyanionic compounds (phosphates, sulphates) are interesting positive electrode materials for lithium-ion batteries due to the higher working potential for the Mn+/M(n+1)+
redox couple, in comparison to that observed in oxides 1 and, for some of them, higher chemical and thermal stability2. Among them, LiVIIIPO
4F
and LiVIVPO
4O Tavorite-type compounds are competitive with the already commercialized
LiFePO4. Indeed, operating on the V3+/V4+ redox couple, LiVPO4F delivers an energy density of
655 Wh/kg 3, whereas LiVPO
4O delivers 615 Wh/kg involving the V4+=O/V5+=O (often called
(VO)2+/(VO)3+) redox couple 4 (against 586 Wh/kg for LiFePO
4 5). Moreover, it would be
possible to increase the energy density by playing with the ability of vanadium to be stabilized in a large range of oxidation states (V2+/V3+/V4+/V5+) although the difference between insertion
and extraction voltages might be too high to be exploited for real applications 6. Kang and
coworkers have proposed to reduce this voltage difference by substituting partially O2- for F
-in LiVPO4F and compositions such as LixVPO4F1-yOy were shown to deliver ca. 800 Wh/kg in an
extended voltage window, with the exchange of 1.6 electrons/vanadium between 2.0 - 4.5 V
vs. Li+/Li based on the activation of the V3+/V4+ and V4+=O/V5+=O redox couples 7. However,
the activation of V3+/V4+/V5+ redox in this material seems to be detrimental to the long life
performance, with ~50% of capacity fading after 15 cycles at the cycling rate of C/20 (i.e. one charge performed in 20 hours).
Beyond the possibility of multi-electrons systems offered by LiVPO4F1-yOy
compositions, we have already demonstrated 8 that vanadyl-type defects are valuable for the
electrochemical performance of LiVPO4F, in a similar way than the carbon coating or particles’
size reduction can be. The in-depth structural description of LiVPO4F1-yOy pristine compounds
are summarized in Figure 1, where both the long range and local structures are provided by XRD and XAS respectively 8.The cationic (i.e. V3+/V4+) and anionic (i.e. O2-/F-) distribution along
the propagation direction of the chains of vanadium octahedra (i.e. [001] direction, see Figure 1a) were shown: (i) not to be ordered (no superstructure identified), (ii) to be associated with significant constrains identified through a strong anisotropic broadening of the diffraction lines and (iii) to a significant deviation of the cell parameters from the Vegard’s law. Such findings suggest the formation of crystalline domains being locally different in oxygen/fluorine
3
composition, and thus in vanadyl bond concentration with a strong local impact on the structure. As X-ray diffraction is a long range characterization technique, it allowed for only an average description of centro-symmetric vanadium octahedra (Figure 1b). The presence of local vanadyl-type distortions in LiVPO4F1-yOy was confirmed thanks to V K-edge XAS
experiment, that highlights the occurrence of different VO4(F,O)2 local environments. The
mixed fluorine/oxygen V4+ octahedra (V4+O
4(O1F1)) are shrunk versus the pure oxygen
environment for V4+, V4+O
4(O1O1), and the V3+ octahedral environments V3+O4(O,F)2 (Figure
1c). This leads to an average shortening of the cell parameters related to the propagation direction of the chains of octahedra and would explain the offset from the Vegard’s law. This behavior has been assigned to the competition between the ionicity of the V3+-F bond and the
covalency of the V4+=O (vanadyl) bond which strongly impacts the crystal field and the
configuration of the vanadium’s orbitals, and makes difficult their full statistical miscibility. It appears that an optimal vanadyl-type bond concentration exists around y = 0.35 in LiVPO4F1-yOy, with improved reversible capacity and rate capability compared to the end
member phases, LiVPO4F and LiVPO4O. The phase diagram as well as the redox mechanisms
observed during lithium deintercalation from LiVPO4F1-yOy have been scrutinized in details and
are reported in this paper with special emphasis on the impact of the vanadyl-type bonds concentration.
4
Experimental part
Operando synchrotron radiation diffraction measurements were performed at the MSPD
beamline9 of the ALBA synchrotron with an operating wavelength of 0.9535(1) Å. Figure S1a
given in supplementary information shows the comparison between the patterns of LiVPO4F0.45O0.55 recorded in situ (i.e. in the electrochemical cell 10) and in a sealed capillary.
The in situ pattern contains a series of additional contributions arising from the battery Figure 1: Summary of the structural description of the pristine materials provided in ref. 8. (a) The structure of LiVPO4F0.45O0.55 highlighting the disordered cationic (V3+/V4+) and anionic (O2-/F-) distributions along the
chains of octahedra. (b) Schematic representation of the environment of the two crystallographically different vanadium sites V(1) and V(2) with their corresponding BVS values. (c) The local environments of vanadium observed by XAS with their corresponding BVS values and probability of appearance
5
components and Li3V2(PO4)3 impurity. Indeed, during operando experiments performed in
transmission mode, the beam is going through all the layers of the battery, generating narrow Bragg peaks from lithium (negative electrode), beryllium (two windows, one on both sides of the cell stacking), and aluminum (current collector), as well as broad contributions from the polytetrafluoroethylene (PTFE) used as binder and from the Whatman separators. The comparison between the two patterns allows identifying the 2θ regions where these additional peaks appear and to exclude them in order to achieve a structural determination of the electrode material during the operando experiment. All the diffraction data collected were thus analyzed by Rietveld refinement in classical or in sequential mode of the Fullprof software11. Moreover, due to the setup constraints, the electrode used for this operando
diffraction experiment had to be self-supported and the use of PTFE as binder was thus preferred with an electrode loading of 70/20/10 (active material/carbon/PTFE). Due to small differences in the electrode loading, the electrochemical signature obtained in the in situ cell differs slightly compared to the one obtained in coin cell; Figure S1b illustrates these differences. A fully delithiated sample was measured ex situ: the self-supported electrode was recovered from a Swagelok cell after cycling at C/200 rate until 4.6 V vs. Li+/Li, washed with
dimethyl carbonate (DMC), dried under vacuum, introduced and sealed under Argon in a 0.4 mm diameter capillary.
Operando X-ray absorption spectroscopy measurements were performed at the Vanadium
K-edge in transmission mode on the ROCK beamline12 at SOLEIL synchrotron (France). A
Si(111) channel-cut quick-XAS monochromator at 5.5 KeV was used, with an energy resolution of 0.6 eV (E/E≈10-4). 0.2 eV was used as energy sampling around the edge position to convert
the original nexus data format to the txt one. The intensity of the monochromatic X-ray beam was measured by three consecutive ionization detectors. Self-supported PTFE-based films, whose loading had to be adjusted according to the absorption coefficient (i.e. a ratio of 50/45/5 for active material, carbon and PTFE respectively), were used and cycled at C/15 in the potential window 3.0 - 4.45 V vs. Li+/Li. The electrode formulation with a high percentage
of carbon leads to a voltage profile close to the one obtained in GITT (Galvanostatic Intermittent Titration Technique) equilibrium conditions (Figure S1b, grey dots) whereas the lower capacity and larger polarization obtained in coin cell (blue line) and in the XRD in situ cell (black line), is probably due to kinetic limitation induced by a higher loading (80 and 70% of active material). Successive spectra were collected every 15 minutes during 5 minutes leading to 56 spectra. The energy calibration was established with the simultaneous absorption measurement of a vanadium metal foil. The data were treated using the Athena software13 for the energy calibration and normalization. The XAS data set was used as input
for the Principal Component Analysis (PCA), revealing that 3 components were necessary to describe the evolution of the XAS spectra during the charge. Then, the principal components were reconstructed using the multivariate curve resolution–alternating least-squares
(MCR-6
ALS) analysis14,15. Finally, the EXAFS oscillations of the reconstructed components were fitted
using the Artemis software13. Fourier transforms of the k² weighted EXAFS oscillations were
carried out in the k range from 2.7 - 12.7 Å-1. Fitting was performed in the R range from 1 –
2.05 Å. EXAFS amplitudes and phase shifts were calculated by FEFF7. Except for the radial distance (Ri) and the Debye–Waller factor (σi²), all the other parameters were kept constant:
the coordination number of each V-X bond (N=6 oxygen as O2- and F- are similar X-ray
scatterers), the energy reference shift (E0=0 eV), and the attenuation factor (S0²=1).
Results and discussion
Phase diagram as observed by Synchrotron X-ray powder diffraction
Figure 2a shows the SXRPD patterns recorded operando during lithium extraction from LiVPO4F0.45O0.55 and that of the fully delithiated composition VPO4F0.45O0.55 obtained ex situ.
As suggested by the electrochemical data given in Figure S1b (blue line), the full delithiation isn’t achieved operando. Indeed, the last pattern recorded corresponds to the composition Li~0.2VPO4F0.45O0.55 and appears obviously significantly different from the one obtained ex situ
for the fully delithiated material. However, already at this state of charge, the end member VPO4F0.45O0.55 could be identified and had thus started to grow in a two-phase region. Indeed,
as shown in Figure 2b that compares the patterns of the specific compositions LiVPO4F0.45O0.55,
Li0.75VPO4F0.45O0.55, Li0.45VPO4F0.45O0.55, Li0.35VPO4F0.45O0.55, Li0.25VPO4F0.45O0.55 and
VPO4F0.45O0.55, the most intense peaks characteristic of VPO4F0.45O0.55 are detected, for
instance at 2θ = 17.7°. Except from the peaks associated to the minor impurity (Li3-xV2(PO4)3)
and to the contributions from the in situ cell (Lithium, Beryllium, Aluminum, PTFE and separator), no additional peaks have been detected suggesting that no Lithium/vacancy ordering takes place within the tunnels of the Tavorite structure.
7
Figure 2: (a) SXRPD patterns obtained operando during lithium extraction from LiVPO4F0.45O0.55. The
material corresponding to the red pattern has been obtained ex situ. (b) Selected SXRPD patterns at specific compositions. At the very beginning of the charge, the Bragg peaks related to the electrochemically active Li3V2(PO4)3 impurity disappear (as highlighted at 14.3° by *)16. This is in good
agreement with the small shoulders seen on the voltage profile at 3.7 and 4.1V vs. Li+/Li on charge (as
shown in Figure S1b).
During the removal of the first 0.55 Li+, anisotropic weak shifts of the initial Bragg peaks
were observed together with the appearance of a second minor phase. The a and b parameters of the main phase slightly decrease (0.13 and 0.08% respectively) while the c parameter slightly increases (0.23%), leading to a very small unit-cell volume change for LixVPO4F0.45O0.55 (0.03% for the exchange of 0.55 electrons, see Figure 3a). The results of the
Rietveld refinement performed for LiVPO4F0.45O0.55 and Li0.45VPO4F0.45O0.55 are compared in
Figure S2 and Table S1 in supplementary information. The two structures appear to be very similar, as expected for the two end members of a LiVPO4F0.45O0.55 - Li0.45VPO4F0.45O0.55 solid
8
distances ranging between 1.93(4) Å and 2.25(3) Å for Li0.45VPO4F0.45O0.55 vs. 1.88(4) Å and
2.31(3) Å for LiVPO4F0.45O0.55, the V-X distances along the chains remaining constant (from
1.952(9) Å to 1.953(9) Å in average on the two vanadium sites).
Figure 3: Evolution of the cell volumes (a) and weight fractions (b) of the phases appearing along the reaction path. For (b) the values without error bar are associated to refinement with fixed cell parameters. The three domains are identified: a solid solution one for LixVPO4F0.45O0.55 (0.45 ≤ x ≤ 1) in
blue, an apparent biphasic domain in orange between Li0.45VPO4F0.45O0.55 and Li0.25VPO4F0.45O0.55, and a
second apparent biphasic domain between Li0.25VPO4F0.45O0.55 and VPO4F0.45O0.55.
Further delithiation leads to the disappearance of the Li0.45VPO4F0.45O0.55 phase
according to a pseudo-biphasic mechanism, as highlighted in Figure 2b, at the benefit of the Li0.25VPO4F0.45O0.55 one which has a significantly smaller cell volume, as shown in Figure 3a.
The Rietveld refinement of Li0.25VPO4F0.45O0.55 is not trivial due to: (i) the presence of two
additional phases next to it, the first being Li0.45VPO4F0.55O0.45 and the second one identified
as VPO4F0.55O0.45 by comparison with the composition obtained ex situ (see Figure S3 and
9
diffraction lines and (iii) the small amount of Li+ ions remaining in the structure which doesn’t
allow to determine their position. Nevertheless, V-X distances along the chains could be determined to be of 1.946(7) Å in Li0.25VPO4F0.45O0.55.
As the full delithiation was not achieved operando despite the appearance of VPO4F0.45O0.55 at the very end of the experiment, the SXRPD pattern of the fully delithiated
material was recorded from a sample prepared ex situ in a standard electrochemical cell in conditions theoretically close to the equilibrium (10 µA/cm², at a rate of C/200). Despite these soft electrochemical lithium extraction conditions, the SXRPD pattern reveals a complex line profile with a strong anisotropic broadening that can be taken into account considering - next to the main “phase” - a secondary “phase” whose most easily identified diffraction lines would be at 16.2, 16.6, 17.9 and 30.0° (as highlighted by arrows in inset of Figure 4a). As shown in Figure 4b, the experimental pattern could beexplained considering the presence of two VPO4F1-yOy and VPO4F1-y’Oy’ “phases” (see Table S3 for more information). The composition of
these two “phases” could be estimated to be close to the major VPO4F0.43O0.57 for VPO4F1-yOy,
and to minor VPO4F0.24O0.76 for VPO4F1-y’Oy’ from the linear variation of the V/Z values
determined from the end members VPO4F and VPO4O (i.e. 80.42(1) Å3 and 81.98(1) Å3
respectively 16,17). The first one is characterized by a cell volume such as V/Z is equal to 81.09(1)
Å3, whereas the second one is characterized by a V/Z of 81.60(8) Å3. The description of the
end member by two phases does not mean that we assume a phase separation during the lithium deintercalation reaction, or even the presence of extended crystalline domains that we could have not identified for the pristine materials. These two “phases” are in fact associated to local domains of slightly different average compositions, one being richer in fluorine and thus in ionic V4+-F bonds and the other being richer in oxygen and thus in covalent
V5+=O bonds. Locally, at the interface between the two types of domains, strains are observed
due to the competition between these ionic and covalent bonds around vanadium atoms. These strains are less obvious, and thus less observed, for the pristine compositions as the difference in cell volumes is only 1.9% between LiVPO4F and LiVPO4O whereas it is 2.8%
between their fully deintercalated counterparts. The Rietveld refinement of the structure of the main “phase” VPO4F1-yOy was performed considering the VPO4F-type model described in
the C2/c space group (Figure 4)18, with constant distances along the chains (d(V-X) = 1.94(1)
Å), whereas the structure of the minor “phase” VPO4F1-y’Oy’ was performed within the Cc space
group, similar to that used to describe VPO4O, allowing an alternation between a short bond
10
Figure 4: Rietveld refinements performed for the composition VPO4F0.45O0.55 : (a) considering a single
phase described in the C2/c space group and (b) considering the contribution of two “phases”, the major one VPO4F1-yOy and the minor one VPO4F1-y’Oy’, the latter being described in the Cc space group. The corresponding Bragg positions are plotted as red and blue marks, respectively.
The evolution of the weight fractions of the intermediate phases identified during the deintercalation process is given in Figure 3b. This figure reveals, among others, that the extraction mechanisms (monophasic or biphasic) cannot be clearly defined. Indeed, during the “apparent biphasic processes”, the volume change observed for each phase is in the same order of magnitude than that measured during the monophasic mechanism. The disordered O2-/F- distribution in the starting phase induces local inhomogeneous delithiation, in
relationship with the local composition being either rich in oxygen or rich in fluorine. This phenomenon is seen, in average, as a combination between monophasic and biphasic reactions whereas it could actually correspond to a multitude of successive local biphasic reactions out of the equilibrium state.
11
Similar operando SXRPD experiments were performed for two other compositions, LiVPO4F0.35O0.65 and LiVPO4F0.25O0.75, in order to investigate the influence of the vanadyl-type
defects’ concentration on the phase diagrams observed during lithium extraction. The diffraction patterns obtained for LiVPO4F0.25O0.75 are given as example in Figure S4, and
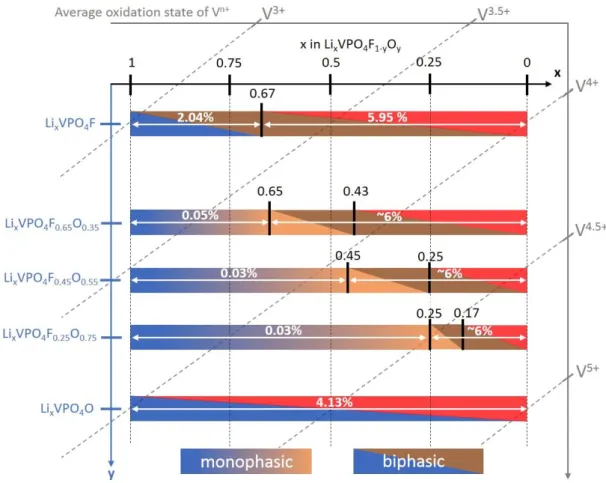
Figure 5 summarizes the phase diagrams obtained for five different compounds LiVPO4F1-yOy
(y = 0, 0.35, 0.55, 0.75 and 1).
Figure 5: Schematic phase diagrams observed by X-ray diffraction for the LixVPO4F1-yOy system. The
“demixing/strains effect” observed at the end of the charge isn’t represented. The diagonal lines represent the average oxidation state of vanadium in the material. The volume variations are also reported in %.
They reveal a similar structural evolution with an apparent solid solution process at the beginning of the charge for 0 < y < 1, whose composition domain depends on the amount of V4+ in the starting material. Indeed, this mechanism is observed in Li
xVPO4F1-yOy for 1 x
0.25, 1 x 0.45 and 1 x 0.65 for y = 0.75, y = 0.55 and y = 0.35 respectively, i.e. until Δx = y. Therefore, it could correspond to the activation of the V4+=O/V5+=O redox couple, before
the activation of the V3+/V4+ redox couple in vanadyl-free environments (V3+O
4F2 or V3+O4FO).
Moreover, as observed for LixVPO4F0.45O0.55, the structural changes observed during this
12
function of the state of charge for the three samples studied: ca. +0.03%, -0.03% and -0.05% for y = 0.75, 0.55 and 0.35 in LixVPO4F1-yOy respectively. The subsequent lithium
deintercalation occurs according to two consecutive pseudo biphasic processes involving the intermediate phases for x ~ 0.17 in LixVPO4F0.25O0.75 and x ~ 0.43 in LixVPO4F0.65O0.35 as
highlighted in Figure 5. This phase transition seems to present some similarities with the one observed at the Li0.67VPO4F composition for LiVPO4F. Indeed, whatever the oxidation state of
vanadium in the starting material, the phase transition appears at a V3+/V4+ ratio
approximately equal to 2. Nevertheless, even using bright SXRPD source, we weren’t able to identify the superstructure peaks observed in the Li0.67VPO4F 19 phase for the LixVPO4F1-yOy
samples. Its limitation to the local rich-fluorine domains makes it much more difficult to be detected.
The partial substitution of oxygen for fluorine in LiVPO4F1-yOy leads to smaller volume
changes along the lithium extraction compared to the ones observed for the LixVPO4F16 (~6%
vs. 8.0%), but remains higher to the one observed for LixVPO4O (i.e. 4.1%)17. Although smaller
volume changes are observed upon electrochemical cycling for LiVPO4O, the local structural
modifications involved by the oxidation of V4+=O to V5+=O are strong, from a distorted
vanadium octahedron to a pyramid with an elongation of the “anti-vanadyl” V5+--O bond and
shortening of the V-O bonds belonging to the square plane. The weaker structural changes for the LixVPO4F1-yOy samples compared to the end-member phases (LixVPO4F, LixVPO4O) seem to
be at the origin of their improved electrochemical performance. Moreover, as (i) the structure seems to be frozen during the first step of the lithium deintercalation reaction (i.e. within the solid solution domain until Δx = y in LixVPO4F1-yOy) and (ii) the further lithium deintercalation
to reach the fully delithiated state leads to similar volume changes (~6%) whatever the F-/O
2-substitution ratio, the vanadyl-type bonds’ concentration for optimized electrochemical performance could arise from the balance between these two processes (i) and (ii). Indeed, for oxygen-rich materials (characterized by a wide solid solution domain) the structure undergoes major structural modifications in a narrow composition range (ΔV/V ~6% for Δx = 0.25 in LixVPO4F0.25O0.75) whereas for the fluorine-rich materials (showing a narrow solid
solution domain), these changes are spread on a large composition range (ΔV/V ~6% for Δx = 0.65 in LixVPO4F0.65O0.35). For the latter, softer structural changes are observed and they could
be at the origin of the better rate capability and cycling stability of fluorine-rich solid solutions materials8.
Operando SXRPD allowed to get an overall picture of the structural modifications upon
charge occurring in LiVPO4F1-yOy as positive electrode materials in lithium batteries. In the case
of a disordered O2-/F- distribution and considering the lightness of lithium, the description of
13
of the composition domains successively observed allows to make hypotheses about the redox mechanisms: activation of the V4+=O/V5+=O redox couple in the monophasic domains
and of the V3+/V4+ redox couple during the following biphasic reactions. A close inspection of
the redox mechanisms and of the local environmental changes around vanadium was done using XAS in order to get a thorough understanding of these phenomena.
The redox paradox around vanadium
Operando XAS spectra were recorded at V K-edge during the charge of the Li //
LiVPO4F0.45O0.55 cell in the 3.0 - 4.45 V vs. Li+/Li voltage range (Figure 6a). The vanadium K-edge
XANES spectrum of the pristine material exhibits several features. The main absorption edge corresponds to the 1s → 4p dipole-allowed transition. Its rather linear shift towards higher energies from LiVPO4F0.45O0.55 to VPO4F0.45O0.55 (i.e. from 5481.9 to 5484.9 eV at half jump,
Figure S6a) is consistent with an increase of the vanadium oxidation state during the charge. The weaker pre-edge contribution located between 5465 and 5473 eV (inset of Figure 6a) arises from the theoretically forbidden 1s to 3d transition which becomes allowed due to the distortion of the local environment around vanadium (i.e. vanadyl-type distortion). The assignment of the pre-edge peaks is complex and some Tavorite-type references were required: we ascribe the peak observed at 5468.0 eV to V3+ (as for LiVIIIPO
4F), at 5469.2 and
5470.7 eV to V4+=O and V5+=O contributions respectively (as shown in Figure S7b for LiVIVPO 4O
and VVPO 4O).
The parallel evolution of the pre-edge intensity and of the edge position is reported in Figure S6a. The position of the edge shifts almost linearly during the oxidation of vanadium whereas the global pre-edge intensity increases strongly until the spectrum 31 (i.e. Li0.45VPO4F0.45O0.55) and then stagnates. This evolution suggests that the whole set of data
cannot be described as a simple linear combination of the initial and final spectra. Therefore, the complete data set was analyzed using Principal Component Analysis (PCA) combined with multivariate curves resolution alternating least-squares method (MCR-ALS)14,15 as previously
used in similar other operando XAS studies20,21. The variance plot obtained from PCA (Figure
S6b) indicates that about 99.74% of the variance of the XAS spectra can be described using the combination of three principal components. Although operando SXRPD has identified at least 4 distinct phases required to describe the phase diagram observed upon Lithium extraction, the addition of a fourth component would only explain 0.05% and could constitute
14
an over interpretation of the signal. Therefore, the residual part has been considered as the experimental noise.
Figure 6: (a) V K-edge XANES spectra recorded during charge of LiVPO4F0.45O0.55 and in inset the
enlargement of the pre-edge region. The colored spectra (#1, #31, #41 and #56) correspond to the specific compositions obtained by SXRPD experiment. (b) The reconstructed components obtained using MCR-ALS analysis. (c) The evolution of the relative amount of each component as a function of the scan number is superimposed to the voltage profile obtained during the operando experiment (black line).
15
The three reconstructed components are displayed in Figure 6b with the evolution of their relative amount along the electrochemical reaction in Figure 6c. These components can be described as follows: component#1 corresponds to the pristine material LiVPO4F0.45O0.55
and component#3 to the fully delithiated one VPO4F0.45O0.55. Since component#2 never
reaches 100% of the relative amount, it cannot be identified with an experimental spectrum. However, as its maximum contribution corresponds to the Li0.45VPO4F0.45O0.55 composition,
this component can be assigned to the phase identified at the end of the solid solution domain observed by operando SXRPD (i.e. when Δx = y in LixVPO4F1-yOy). Comparing the absorption
energy for each component, it evolves linearly as a function of the oxidation state of vanadium. The pre-edges of the reconstructed components show three main contributions observed at 5468.0, 5469.2 and 5470.7 eV with different relative intensities along lithium extraction. Between component#1 and component#2, the decrease of the V4+=O contribution
(i.e. 5469.2 eV) is clearly accompanied by an increase of the V5+=O contribution (i.e. 5470.7
eV), revealing the activation of the V4+=O/V5+=O redox couple during the first part of the
lithium extraction as suggested by operando SXRPD. For component#3, a slight decrease of the V3+ contribution (i.e. 5468.0 eV) is observed, with in fact almost no modification of the
pre-edge versus that observed for the component#2.
Therefore, the V3+/V4+ redox couple seems to be activated at higher voltage compared
to the V4+=O/V5+=O one, leading to the formation of a mixed valence V3+/V5+ phase at the end
of the first vanadium oxidation step (i.e. Li0.45(V3+0.45V5+0.55)PO4F0.45O0.55). This result, although
surprising, is in full agreement with the operating voltages of the end-member phases. Indeed, the V4+=O/V5+=O redox couple is observed in Li
xVPO4O at a lower potential than the V3+/V4+
redox couple in LixVPO4F (i.e. 3.95 V for V4+=O/V5+=O in LixVPO4O and 4.24 V for V3+/V4+ in
LixVPO4F)3: the covalency of the vanadyl bond acts as a “reverse inductive effect”, decreasing
significantly the potential of the V4+=O/V5+=O redox couple.
The local structure as a support of the proposed redox mechanism
The Fourier transforms of k²-weighted EXAFS spectra of the reconstructed components and their corresponding fits are given in Figure S8. The model used to describe the starting material, already reported in ref. 8, is built on 3 populations of bonds around vanadium with different probabilities depending on the F-/O2- substitution ratio (i.e. y in LiVPO
4F1-yOy). During
electrochemical cycling, new environments are expected to be generated. Thus, an additional degree of freedom has been considered to fit separately the bond lengths belonging to the square plane of the octahedra (i.e. (iv) in Figure 7 and Table S4) and those being perpendicular
16
(i.e. (i), (ii) and/or (iii) in Figure 7 and Table S4). Therefore, we assumed a 6-fold coordination for vanadium with the following constraints:
(i) the number of Vn+=O (n > 3) vanadyl bonds was fixed to the number of V4+ in the
starting material,
(ii) the “anti-vanadyl” V4+--O and V5+--O bonds are formed only by vanadium involved
in a vanadyl bond and having an oxygen as antagonist ligand,
(iii) all other Vn+-X bonds along the propagation direction of the octahedra have been
considered to be equivalent,
(iv) all the Vn+-O bonds (with n = 3, 4 or 5) belonging to the square plane of VO
4X2 have
also been considered to be equivalent.
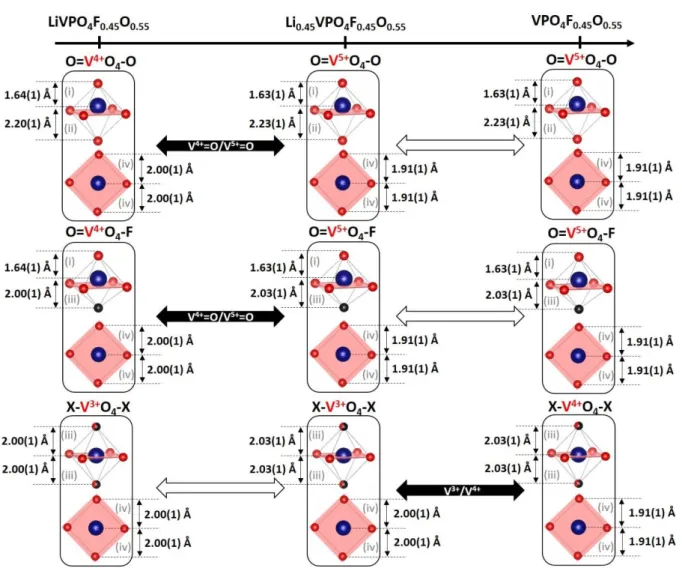
Figure 7: Schematic representation of the evolution of the local environments around vanadium upon
electrochemical cycling. The starting material, LiVPO4F0.45O0.55, contains 3 different vanadium
environments (O=V4+O
4-O, O=V4+O4-F and X-V3+O4-X, represented from the top to the bottom)
characterized by 4 kinds of bond distances: (i), (ii), (iii) and (iv) (see text) evolving upon Li extraction (from the left to the right). The redox couples involved during each step are mentioned in the black arrows while the white arrows indicates the absence of electrochemical activity.
17
This leads to 5 parameters to refine (4 different populations of bond lengths and a common Debye Waller factor for all of them) for 7 independent parameters (2.Δk.ΔR/π~7). For the composition studied, LiVPO4F0.45O0.55, the coordination [0.55 + 0.20 + 1.25 + 4] for (i)
vanadyl V4+=O, (ii) “anti-vanadyl” V4+--O , (iii) apical Vn+-X and (iv) equatorial Vn+-O respectively
has been used. This model provides, for the fit of the component#1, a similar description than the model provided in ref. 8 : the vanadyl bond V4+=O (x0.55) is at 1.64(1) Å, both Vn+-O (x4)
and Vn+-X (x1.25) bonds are at 2.00(1) Å and the V4+--O (x0.20)bonds are at 2.20(1) Å with a
common Debye Waller factor of 0.005 Ų. The average distances around vanadium obtained from SXRPD and EXAFS are in very good agreement. Indeed, the refinement of the SXRPD pattern of the pristine material leads to an average vanadium-ligands distance of 1.972(6) Å in centrosymmetric vanadium octahedra and for EXAFS, the <dV-L>EXAFS is equal to 1.97(1) Å.
The EXAFS model is further supported by the resulting BVS value which is very close to the theoretical one, on the contrary to the one provided from distances calculated from SXRPD (i.e. 3.6(1) for EXAFS vs. 3.26(1) in average on the two vanadium sites for SXRPD vs. 3.55 theoretically). The comparison between distances obtained from SXRPD and EXAFS experiments and associated BVS values are provided in Table S4.
During the first step of charge, we found that the oxidation of V4+=O to V5+=O entities
occurs without any significant modification of the V-O/F distances along the propagation direction of the chains of octahedra (i.e. (i)/(ii), and (i)/(iii)). In the meantime, a significant shortening of the equatorial V-O bonds (i.e. (iv)) is observed (from 2.00(1) Å to 1.95(1) Å in average (Table S4 and Figure 7)). The distortion of the PO4 network compensates for this
shortening leading to an enlargement of the Li diffusion channels and thus to the “freezing” of the average cell volume. The values of the average distances obtained from EXAFS are in good agreement with those calculated from SXRPD (<dV-L>SXRPD = 1.96(1) Å and <dV-L>EXAFS =
1.95(1) Å) and, again, the BVS value determined for vanadium in component#2 (i.e. Li0.45VPO4F0.45O0.55) thanks to EXAFS distances (3.9(1) vs. 4.10 theoretically) is closer to the
theoretical one, versus that calculated from SXRPD distances (i.e. 3.65(8)). For component#3, namely VPO4F0.45O0.55, only the bonds belonging to the square plane undergo a significant
shortening from 1.95(1)Å to 1.91(1)Å whereas the other ones remain quasi unchanged conferring a BVS value for vanadium of 4.3(1) (instead of 4.55 theoretically).
As illustrated in Figure 7, the EXAFS analysis reveals that all along the lithium deintercalation, the competition between the ionicity of the Vn+-F bonds and the covalency of
the Vn+=O bonds constrains the system along the [001] direction related to the vanadyl
distortion. Indeed, the (i) Vn+=O, (ii) Vn+--O and (iii) Vn+-F distances don’t evolve significantly,
18
significant shortening (about 2.5 %) despite only a tiny contraction of the related cell parameters (i.e. a and b with variation of 0.05% and 0.18% respectively) is detected by XRD.
Conclusion
Operando XAS experiments conducted during lithium deintercalation from LixVPO4F1-yOy,
reveal the activation of the V4+=O/V5+=O redox couple during the first step of the charge and then that
of the V3+/V4+ redox couple in fluorine rich environment. This result, although surprising, is in full
agreement with the experimental operating voltages of the end-member phases, LiVPO4F and
LiVPO4O, and is observed for the first time in the same mixed-valence starting material. Operando
SXRPD reveals that the first step corresponds to a wide monophasic domain during which the average structure seems to be frozen. The fit of the EXAFS oscillations has shown that the structural immobilization persists at the local scale for the bond lengths along the propagation direction of the chains of octahedra, and that a shortening of the equatorial V-O distances is observed. This study nicely illustrates the complementarity between operando XAS and XRD allowing an in-depth description of crystallographic features combined to that of the electronic states of vanadium in relation with the electrochemical performance. These studies are foreseen to unlock the multi-electron redox in Alkali ion battery cathodes.
Associated Content
* Supporting InformationThe Supporting Information is available free of charge on the ACS Publications website via the internet
at http://pubs.acs.org. The supporting information gathers all the details of the analyses performed
on the Synchrotron X-ray diffraction data and X-ray absorption spectroscopy data, recorded ex situ and in situ during the cycling of the batteries.
Acknowledgment
The authors thank Rénald David (LRCS) for the synthesis of the LiVPO4F1-yOy materials,
Thibault Broux (ICMCB/LRCS) for his support with the chemometric analysis, and Tahya Bamine (ICMCB) and Dany Carlier (ICMCB) for fruitful discussions on the local structures observed in these materials. The authors thank also ALBA (Barcelona, Spain) for Synchrotron X-ray diffraction experiments on the MSPD beamline and SOLEIL (Gif-sur-Yvette, France) for
19
X-ray spectroscopy experiments on the ROCK beamline (financed by the French National Research Agency (ANR) as a part of the "Investissements d'Avenir" program, reference: ANR-10-EQPX-45; proposal number 20160282). The authors also acknowledge FEDER, the Région Hauts-de-France and the RS2E Network for the funding of EB’s PhD thesis, as well as the financial support of Région Nouvelle Aquitaine and of the French National Research Agency (STORE-EX Labex Project ANR-10-LABX-76-01 and HIPOLITE Progelec project ANR-12-PRGE-0005-02).
20
References
(1) Manthiram, A.; Goodenough, J. B. Lithium Insertion into Fe2(SO4)3 Frameworks. J. Power
Sources 1989, 26, 403–408.
(2) Masquelier, C.; Croguennec, L. Polyanionic (Phosphates, Silicates, Sulfates) Frameworks as Electrode Materials for Rechargeable Li (or Na) Batteries. Chem. Rev. 2013, 113 (8), 6552–6591.
(3) Ateba Mba, J.M; Masquelier, C.; Suard, E.; Croguennec, L. Synthesis and Crystallographic Study of Homeotypic LiVPO4F and LiVPO4O. Chem. Mater. 2012, 24,
1223–1234.
(4) Shi, Y.; Zhou, H.; Seymour, I. D.; Britto, S.; Rana, J.; Wangoh, L. W.; Huang, Y.; Yin, Q.; Reeves, P. J.; Zuba, M.; Chung, Y.; Omenya, F.; Chernova, N.; Zhou, G.; Piper, F.J.; Grey, C.P.; Whittingham, M.S. Electrochemical Performance of Nanosized Disordered LiVOPO4. ACS Omega 2018, 3, 7310–7323.
(5) Huang, H.; Yin, S.-C.; Nazar, L. F. Approaching Theoretical Capacity of LiFePO4 at Room
Temperature at High Rates. Electrochem. Solid-State Lett. 2001, 4 (10), 170–172. (6) Barker, J.; Gover, R. K. B.; Burns, P.; Bryan, A. A Symmetrical Lithium-Ion Cell Based on
Lithium Vanadium Fluorophosphate, LiVPO4F. Electrochem. Solid-State Lett. 2005, 8 (6),
285–287.
(7) Kim, M.; Lee, S.; Kang, B. High Energy Density Polyanion Electrode Material ; LiVPO4O 1-xFx (x ≈ 0.25) with Tavorite Structure. Chem. Mater. 2017, 29 (11), 4690–4699.
(8) Boivin, E.; David, R.; Chotard, J. N.; Bamine, T.; Iadecola, A.; Bourgeois, L.; Suard, E.; Fauth, F.; Carlier, D.; Masquelier, C.; Croguennec, L. LiVPO4F1-yOy Tavorite-Type
Compositions: Influence of the Vanadyl-Type Defects’ Concentration on the Structure and Electrochemical Performance. Chem. Mater. 2018, 30 (16), 5682–5693.
(9) Fauth, F.; Peral, I.; Popescu, C.; Knapp, M. The New Material Science Powder Diffraction Beamline at ALBA Synchrotron. Powder Diffr. 2013, 28, 360–370.
(10) Leriche, J. B.; Hamelet, S.; Shu, J.; Morcrette, M.; Masquelier, C.; Ouvrard, G.; Zerrouki, M.; Soudan, P.; Belin, S.; Elkaïm, E.; et al. An Electrochemical Cell for Operando Study of Lithium Batteries Using Synchrotron Radiation. J. Electrochem. Soc. 2010, 157 (5), 606–610.
(11) Rodriguez-carvajal, J. Recent Advances in Magnetic Structure Determination by Neutron Powder Diffraction. Phys. B 1993, 192, 55–69.
(12) Briois, V.; La Fontaine, C.; Belin, S.; Barthe, L.; Moreno, T.; Pinty, V.; Carcy, A.; Girardot, R.; Fonda, E. ROCK : The New Quick-EXAFS Beamline at SOLEIL. J. Phys. Conf. Ser. 2016,
712, 1–6.
(13) Ravel, B.; Newville, M. ATHENA, ARTEMIS, HEPHAESTUS: Data Analysis for X-Ray Absorption Spectroscopy Using IFEFFIT. J. Synchrotron Radiat. 2005, 12, 537–541. (14) Jaumot, J.; de Juan, A.; Tauler, R. MCR-ALS GUI 2.0: New Features and Applications.
Chemom. Intell. Lab. Syst. 2015, 140, 1–12.
(15) Jaumot, J.; Gargallo, R.; Juan, A.; Tauler, R. A Graphical User-Friendly Interface for MCR-ALS: A New Tool for Multivariate Curve Resolution in MATLAB. Chemom. Intell. Lab.
Syst. 2005, 76, 101–110.
(16) Ateba Mba, J. M.; Croguennec, L.; Basir, I.; Barker, J.; Masquelier, C. Lithium Insertion or Extraction from / into Tavorite-Type LiVPO4F : An In Situ X-Ray Diffraction Study. J.
21
(17) Bianchini, M.; Ateba-Mba, J. M.; Dagault, P.; Bogdan, E.; Carlier, D.; Suard, E.; Masquelier, C.; Croguennec, L. Multiple Phases in the ε-VPO4O–LiVPO4O–Li2VPO4O
System: A Combined Solid State Electrochemistry and Diffraction Structural Study. J.
Mater. Chem. A 2014, 2, 10182–10192.
(18) Ellis, B. L.; Ramesh, T. N.; Davis, L. J. M.; Goward, G. R.; Nazar, L. F. Structure and Electrochemistry of Two-Electron Redox Couples in Lithium Metal Fluorophosphates Based on the Tavorite Structure. Chem. Mater. 2011, 23, 5138–5148.
(19) Boivin, E. PhD Thesis: Crystal Chemistry of Vanadium Phosphates as Positive Electrode Materials for Li-Ion and Na-Ion Batteries, University of Picardie Jules Verne, 2017. (20) Broux, T.; Bamine, T.; Simonelli, L.; Stievano, L.; Fauth, F.; Ménétrier, M.; Carlier, D.;
Masquelier, C.; Croguennec, L. VIV Disproportionation Upon Sodium Extraction From
Na3V2(PO4)2F3 Observed by Operando X-Ray Absorption Spectroscopy and Solid State
NMR. J. Phys. Chem. C 2017, 121, 4103–4111.
(21) Fehse, M.; Iadecola, A.; Sougrati, M. T.; Conti, P.; Giorgetti, M.; Stievano, L. Applying Chemometrics to Study Battery Materials: Towards the Comprehensive Analysis of Complex Operando Datasets. Energy Storage Mater. 2019, 18, 328–337.