Correlation Maps Allow Neuronal Electrical
Properties to be Predicted from Single-cell
Gene Expression Profiles in Rat Neocortex
Maria Toledo-Rodriguez1,2, Barak Blumenfeld2, Caizhi Wu3, Junyi Luo3, Bernard Attali4, Philip Goodman5 and
Henr y Markram1
1Brain and Mind Institute, EPFL, Lausanne 1015, Switzerland, 2Department of Neurobiology, Weizmann Institute of Science, Rehovot 76100, Israel, 3Cold Spring Harbor Laboratory, 1 Bungtown Road, Cold Spring Harbor, NY 11724, USA, 4Department of Physiology, Medical School, Tel Aviv University, Tel Aviv 69978, Israel and 5Department of Internal Medicine, University of Nevada, Reno, NV 89557, USA
The computational power of the neocortex arises from interactions of multiple neurons, which display a wide range of electrical proper-ties. The gene expression profiles underlying this phenotypic diver-sity are unknown. To explore this relationship, we combined whole-cell electrical recordings with single-whole-cell multiplex RT-PCR of rat (p13–16) neocortical neurons to obtain cDNA libraries of 26 ion chan-nels (including voltage activated potassium chanchan-nels, Kv1.1/2/4/6, Kvβ1/2, Kv2.1/2, Kv3.1/2/3/4, Kv4.2/3; sodium/potassium permeable hyperpolarization activated channels, HCN1/2/3/4; the calcium acti-vated potassium channel, SK2; voltage actiacti-vated calcium channels, Caα1A/B/G/I, Caβ1/3/4), three calcium binding proteins (calbindin, parvalbumin and calretinin) and GAPDH. We found a previously unreported clustering of ion channel genes around the three calcium-binding proteins. We further determined that cells similar in their expression patterns were also similar in their electrical properties. Subsequent regression modeling with statistical resampling yielded a set of coefficients that reliably predicted electrical properties from the expression profile of individual neurons. This is the first report of a consistent relationship between the co-expression of a large profile of ion channel and calcium binding protein genes and the electrical phenotype of individual neocortical neurons.
Keywords: cortex, electrophysiology, ion channel, neuron, single-cell RT-PCR
Introduction
A major challenge in the post-genomic era is to determine the relevance of specific gene expression patterns on behavior. Neurons, the building blocks of the nervous system, display a variety of complex electrical behaviors that result from the orchestrated activity of a large number of different ion chan-nels (reviewed in, for example, Johnston and Wu, 1995; Sakmann and Neher, 1995; Hille, 2001). However, it is very difficult to quantify the causal relationship between the expres-sion of specific genes and the electrical function of the neuron because there are numerous complex non-linear steps between genome, proteome, and electrical phenotype. These include the amounts of mRNA transcribed, the amounts of protein translated from the mRNAs, post-translational modifications, heteromerization of ion channel subunits, ion channel modula-tion by auxiliary subunits, different protein turnover rates and targeting via different anchoring proteins. Furthermore, the electrical phenotype also depends on where the active channel is localized on the neuron and on the specific morphology of the neuron.
Only a few studies have established strong evidence for a causal relationship between the expression of a single ion channel gene and the electrical behavior using, for example,
dynamic clamp in hippocampal neurons (Lien and Jonas, 2003), antisense oligonucleotides in hippocampal neurons (Du et al., 2000), transfection with dominant negative mutants in cerebellar granule cells (Shibata et al., 2000), single-cell pharmacology and transfection of HEK cells (Baranauskas et al., 2003) and modeling combined with immunohistochemical and pharmacological approaches in neocortical interneurons (Erisir et al., 1999).
More commonly, attempts have been made to correlate the frequency of detecting an expressed gene in a specific cell with an electrophysiological feature (Yan and Surmeier, 1996; Martina et al., 1998; Plant et al., 1998; Song et al., 1998; Lien et al., 2002). In some cases it has been possible to establish a correlation between the expression of specific ion channel subunits and an aspect of electrical behavior (Martina et al., 1998; Plant et al., 1998; Seifert et al., 1999; Liss et al., 2001; Lien et al., 2002). However, causal relationships have often been much more difficult to establish. This difficulty probably results from the enormous complexity. Since a large number of ion channel genes may be expressed in different combinations to generate the electrical behavior, a first essential step is to establish quantitatively the degree to which profiles of expressed genes are correlated to the electrical behavior.
Although there are several published reports of the simulta-neous expression of a large number of receptors using single-neuronal RT-PCR (Porter et al., 1998; Cauli et al., 2000), a maximum of only five ion channel genes were simultaneously investigated. Mermelstein et al. (1999) studied the expression of Caα1A and its four auxiliary subunits Caβ1–4 from acutely dissociated cortical pyramidal neurons; Franz et al. (2000) studied the co-expression of the four Na+/K+ channels HCN1–4 in layer V pyramidal neurons; and Foehring et al. (2000) reported the expression of Caα1E from acutely dissociated neocortical pyramidal neurons.
The detection of specific mRNA transcripts from a single cell is a technical challenge due to the minute quantities of mRNA in a single neuron. There are several strategies to overcome this limitation. The most straightforward strategy is to use the entire cell’s cytoplasm to test the expression of a single gene (Martina et al., 1998). A second strategy is to split the cell’s cytoplasm into as many reactions as genes to be tested before amplifying each gene independently (Surmeier et al., 1996; Yan and Surmeier, 1996). A third strategy, useful when the genes of interest show a high degree of sequence similarity, is to design a single pair of degenerated primers located in regions identical or nearly identical for all the genes (Plant et al., 1998; Lien et al., 2002). Subsequently, the identity of each gene can be determined by: (i) differences in the size of the
PCR products; (ii) use of specific restriction enzymes that cut only one amplified PCR product (Plant et al., 1998); (iii) Southern blot using gene specific probes (Lien et al., 2002); or (iv) second PCR using gene specific nested primers (Lien et al., 2002). A fourth method is non-specific pre-amplification of all the neuron’s mRNA before the gene specific PCR, using ampli-fication methods based on either PCR (Brady et al., 1990; Dulac and Axel, 1995; Dixon et al., 1998; Lin et al., 1999) or T7 mRNA polymerase (Eberwine et al., 1992; Ginsberg and Che, 2002). Although T7 mRNA amplification is routine when starting from micrograms of mRNA or cDNA, it remains techni-cally challenging when starting from the picogram-levels of mRNA, available from single neurons. Although a few studies attempted cDNA microarray analysis on single-cell aspirates (Chiang and Melton, 2003; Kamme et al., 2003; Tietjen et al., 2003), the success rate was very low and this method is there-fore not yet practical for profiling of a large number of indi-vidual neurons.
Finally, a fifth strategy to detect specific mRNA transcripts from a single-cell is based on gene specific pre-amplification employing multiplex-PCR (Edwards and Gibbs, 1994; Cauli et al., 1997; Wang et al., 2002). Unfortunately, the number of genes that can be simultaneously investigated using multiplex, although large, is still limited. The main limitation of multiplex PCR is interference among the multiple primers used for ampli-fying the different genes, requiring a lengthy calibration procedure in which the optimal combination and relative concentrations of primers and temperatures must be deter-mined (Edwards and Gibbs, 1994).
A major drawback of all single-cell gene expression approaches is the false negative rate (genes expressed but not detected). The best current solution to this problem is to obtain a large dataset and perform statistical modeling on a population of neurons. In this study, we determined the profiles of genes expressed by 203 neocortical neurons charac-terized electrically using patch clamp recordings combined with the single-cell multiplex RT-PCR method (Lambolez et al., 1992; Monyer and Jonas, 1995; Monyer and Lambolez, 1995; Sucher and Deitcher, 1995; Cauli et al., 1997, 2000; Wang et al., 2002; Fig. 1). Neurons were screened for the expression of one house-keeping gene (GAPDH), three Ca2+ binding proteins (CaBPs) and 26 ion channel genes for which the biophysical properties have been established in the literature. We then used statistical modeling approaches to determine the correla-tions between profiles of gene expression and profiles of elec-trical properties and tested the validity of the derived correlation maps. This approach revealed the relationship between electrical phenotype and a modest but physiologically relevant subset of the neuronal transcriptome.
Materials and Methods Slice Preparation
Slicing procedure was described previously (Gupta et al., 2000; Markram et al., 1997). In brief, Wistar rats (13–16 days old) were rapidly decapitated and neocortical slices (sagittal, 300 µm thick) were sectioned on a vibratome (Microslicer; DSK, Japan). Slices were incubated for 30 min at 34°C and then at room temperature until transferred to the recording chamber. The extra-cellular solution contained (mM): 125 NaCl, 2.5 KCl, 25 glucose, 25 NaHCO3, 1.25 NaH2PO4, 2 CaCl2 and 1 MgCl2. Neurons in somatosensory cortex were visually identified using infrared differential interference contrast microscopy.
Electrical Recording
This was performed as previously described (Markram et al., 1997; Gupta et al., 2000; Wang et al., 2002). In brief, somatic whole-cell recordings (pipette resistance 1–3 MΩ) were made. Signals were sampled at intervals of 10–400 µs, filtered at 3, 10 or 30 kHz, digitized using an ITC-18 interface (Instrutech, Great Neck, NY) and stored on the computer hard disk for off-line analysis (Igor Wavemetrics, Lake Oswego, OR). Voltages were recorded with pipettes containing RNAse-free (mM) 100 K+ gluconate, 20 KCl, 4 ATP–Mg, 10 phospho-creatine, 0.3 GTP, 10 Hepes (pH 7.3, 310 mosmol/l, adjusted with sucrose) and 0.5% biocytin (Sigma). Neurons were filled with biocytin by diffusion during the 20–30 min recordings. Strengths of current injection were normalized across all cells according to the minimal step current required to reach AP threshold. Somatic current injec-tions to reach threshold ranged from 30 to 150 pA.
Analysis of Electrophysiological Recordings
Intrinsic properties: input resistances were approximated by linear regression of voltage deflections from holding potential (–70 ± 1 mV) in response to 2 s current steps of four to eight different amplitudes after reaching steady state. Membrane time constants were deter-mined by fitting a mono-exponential to the decay phases of hyper-polarizing delta-pulses (1 ms duration, voltage deflections of <10 mV), or from fitting a mono-exponential to the rising phases of the voltage traces used for determining the input resistances. AP analysis was performed on the first and second APs elicited by supra-threshold depolarizations. Values of the AP amplitude, duration, half duration (time from AP half amplitude to the same voltage during offset), rise time and fall time (duration from peak to the offset — when Vm reaches that of onset) were determined by averaging three to five values. Values of the fAHP were determined by averaging three to five traces. Maximum rise and fall rates were obtained as peak values after differentiating the single AP.
Histological Procedures and Morphological Identification These were performed as previously described in (Markram et al., 1997; Gupta et al., 2000). In brief, after recording, slices were fixed for 24 h in cold 0.1 M phosphate buffer (PB, pH 7.4) containing 2% paraformaldehyde, 1% glutaraldehyde and 0.3% saturated picric acid, then rinsed several times in PB and transferred into phosphate-buffered 3% H2O2 for 30 min. After rinsing in PB, slices were incu-bated overnight at 4°C in biotinylated horseradish peroxidase conju-gated to avidin (2% A, 2% B and 1% Triton-100, ABC-Elite; Vector Labs, Peterborough, UK). Sections were then washed several times in PB, developed with diaminobenzadine, washed and then mounted. Subse-quently neurons were morphologically classified according to the axonal morphology (reviewed in, for example, Toledo-Rodriguez et
al., 2002).
Cytoplasm Harvesting and Single-Cell Reverse Transcription These procedures were performed as previously described (Cauli et
al., 1997; Wang et al., 2002). In brief, at the end of the recording, cell
cytoplasm was aspirated into the recording pipette under visual control by applying gentle negative pressure. Only cells in which the seal was intact throughout the recording and whose nucleus was not harvested were further processed. The electrode was then withdrawn from the cell to form an outside-out patch that prevented contamina-tion as the pipette was removed. The tip of the pipette was broken and the contents of the pipette expelled into a test tube by applying positive pressure. mRNA was reverse transcribed using an oligo-dT primer (25 ng/ul) and 100 U of MMLV reverse transcriptase (Gibco, BRL). After 50 min incubation at 42°C, the cDNA was frozen and stored at –20°C before further processing.
Multiplex PCR
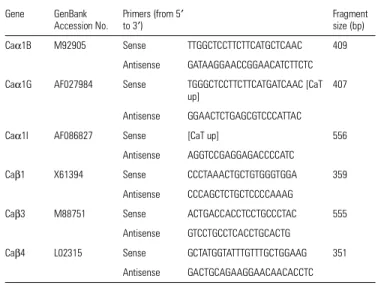
Multiplex-PCR conditions were optimized using total RNA purified from rat neocortex, so that a PCR product could be detected from (250 pg–1 ng) of total RNA without contamination caused by non-specific amplification. For the lists of the primer pairs included into the different multiplexes, the name and accession number of the genes amplified and the length of the PCR product, see Table 1. Three different multiplex-PCR reactions were performed for testing the
expression of 30 mRNA species from each cell. The genes co-ampli-fied in each of three multiplex-PCR reactions were Pool I → (CB, PV, CR and GAPDH), Pool II → (Kv1.1, Kv1.2, Kv1.6, Kv2.1, Kv2.2, Kv3.1, Kv3.2, Kv4.2, Kvβ1, Kvβ2, HCN1 and HCN2) and Pool III → (Kv1.4, Kv3.3, Kv3.4, Kv4.3, HCN3, HCN4, Caα1A, Caα1B, Caα1G, Caα1I, Caβ1, Caβ3, Caβ4 and SK2). Pool 1 was already calibrated to give PCR products for each gene with even intensity (Cauli et al., 1997; Wang et
al., 2002). Pools 2 and 3 were calibrated to give PCR products for each
gene with even intensity starting from 1 ng of brain total mRNA. During calibration different combinations of genes were distributed between the two pools (2 and 3) and different primer pairs were tested until an even amplification of all genes included in the pool was obtained.
The first amplification round consisted of 10 min hot start at 95°C followed by 25 cycles (94°C for 40 s, 56°C {Pools I and II} or 58°C {Pool III} for 40 s and 72°C for 1 min) performed with a program-mable thermocycler (Eppendorf, Germany). For each pool all genes were simultaneously amplified in a single tube containing 1/10 (Pool I) or 2/5 (Pools II and III) of the RT product, 100 nM of each of the primers, 2 µM of each dNTP (Promega) and 5 U of HotStarTaq DNA Polymerase (Qiagen, Hilden, Germany) in a final volume of 100 µl. A second round of PCR consisted of 40 cycles (94°C for 40 s, 56°C {Pools I and II} or 58°C {Pool III} for 40 s and 72°C for 1 min) was performed. In this case, each gene was individually amplified in a separate test tube containing: 1 µM of its specific primers, 2 µl of the first PCR product (template), 2 µM of each dNTP and 5 U of HotStarTaq DNA Polymerase, in a final volume of 20 µl. The products of the second PCR were analyzed in 1.5% agarose gels using ethidium bromide. Amplification specificity was randomly verified by restric-tion analysis.
Controls for the RT-PCR
For each PCR amplification, controls for contaminating artifacts were performed using sterile water instead of cDNA. A control for non-specific harvesting of surrounding tissue components was randomly employed by advancing pipettes into the slice and retrieving without seal formation and suction. Both types of controls gave negative results throughout the study. Amplification of genomic DNA could be excluded by the intron-overspanning location of many of the primers Table 1
PCR primers used in this study Gene GenBank Accession No. Primers (from 5′ to 3′) Fragment size (bp) CBa M27839 Sense AGGCACGAAAGAAGGCTGGAT 432 Antisense TCCCACACATTTTGATTCCCTG PVa M12725 Sense AAGAGTGCGGATGATGTGAAGA 389 Antisense ATTGTTTCTCCAGCATTTTCCAG CRa X66974 Sense CTGGAGAAGGCAAGGAAAGGT 311 Antisense AGGTTCATCATAGGGACGGTTG
GAPDH M17701 Sense GCCATCAACGACCCCTTCAT 315
Antisense TTCACACCCATCACAAACAT Kv1.1c M26161 Sense CCGCCGCAGCTCCTCTACT 209 Antisense CAAGGGTTTTGTTTGGGGGCTTTT Kv1.2c X16003 Sense GAAAAGTAGAAGTGCCTCTACCATAA 458 Antisense TTGATATGGTGTGGGGGCTATGA Kv1.4c X16002 Sense CTGGGGGACAAGTCAGAGTATCTA 434 Antisense ACTCTCCTCGGGACCACCT Kv1.6 X17621 Sense GGGAACGGCGGTCCAGCTA 351 Antisense GTGCATCTCATTCACGTGACTGAT Kv2.1d X16476 Sense CAACTTCGAGGCGGGAGTC 229 Antisense TCCAGTCAACCCTTCTGAGGAGTA Kv2.2d M77482 Sense ACCAGGAGGTTAGCCAAAAAGACT 446 Antisense AGGCCCCTTATCTCTGCTTAGTGT Kv3.1d X62840 Sense CCAACAAGGTGGAGTTCATCAAG 640 Antisense TGGTGTGGAGAGTTTACGACAGATT Kv3.2d X62839 Sense ACCTAATGATCCCTCAGCGAGTGA 302 Antisense CAAAATGTAGGTGAGCTTGCCAGAG Kv3.3 M84211 Sense GAGACCCCCGTCCCAATG 179 Antisense CGGGGGAAGGGGCATAGTC Kv3.4c X62841 Sense TCAGGCACACGGGACAGAAAC 418 / 522 Antisense GGGCAGAGGACTTGGGAGACATA Kv4.2c S64320 Sense CCGAATCCCAAATGCCAATGTG 265 Antisense CCTGACGATGTTTCCTCCCGAATA
Kv4.3 U42975 Sense GGGCAAGACCACGTCACTCA 296 / 386
Antisense CTGCCCTGGATGTGGATGGT
Kvβ1c X70662 Sense AAGGGAGAAAACAGCAAAACAAGC 170
Antisense TGGCACCAAGGTTTTCAATGAGTT
Kvβ2 X76724 Sense ACAGTGGCATCCCACCCTACT 283
Antisense GTGGACGATGGAGGACGACAAT HCN1 AF247450 Sense CCTCAAATGACAGCCCTGAATTG 405
Antisense TCGGTGTGGAACTACCAGGTGT
HCN2 AF247451 Sense CTCTCCGGCAACGCGTGTG 211
Antisense AGTCCCTGCGGTCCGGACT
HCN3 AF247452 Sense TGCCCCTCTCCCCTGATTC 335
Antisense TTCCAGAGCCTTTGCGCCTA
HCN4 AF247453 Sense AACCTGGGGGCTGGACAGA 462
Antisense CTGGGCAGCCTGTGGAGAG
SK2 U69882 Sense GCATGTGCACAACTTCATGATGGA 461
Antisense CGCTCAGCATTGTAGGTGACATG Caα1Ab M64373 Sense GAGCGGCTGGATGACACAGAAC 420
Antisense CTGGCGACTCACCCTGGATGTC
Table 1
Continued
These include: the voltage activated K+ channels (Kv1.1/2/4/6, Kvβ1/2, Kv2.1/2, Kv3.1/2/3/4,
Kv4.2/3); the K+/Na+ permeable hyperpolarization activated channels (HCN1/2/3/4); the Ca2+
activated K+ channel (SK2); the voltage activated Ca2+ channels (Caα1A/B/G/I, Caβ1/3/4); the
Ca2+ binding proteins calbindin (CB), parvalbumin (PV) and calretinin (CR) and the ubiquitously
expressed protein GAPDH. R = A or G; K = G or T; Y = C or T. aCauli et al. (1997); bGlasgow et al.
(1999); cSong et al. (1998); dBaranauskas et al. (1999); eAranda-Abreu et al. (1999).
Gene GenBank
Accession No. Primers (from 5′to 3′) Fragment size (bp) Caα1B M92905 Sense TTGGCTCCTTCTTCATGCTCAAC 409
Antisense GATAAGGAACCGGAACATCTTCTC Caα1G AF027984 Sense TGGGCTCCTTCTTCATGATCAAC [CaT
up]
407 Antisense GGAACTCTGAGCGTCCCATTAC
Caα1I AF086827 Sense [CaT up] 556
Antisense AGGTCCGAGGAGACCCCATC
Caβ1 X61394 Sense CCCTAAACTGCTGTGGGTGGA 359
Antisense CCCAGCTCTGCTCCCCAAAG
Caβ3 M88751 Sense ACTGACCACCTCCTGCCCTAC 555
Antisense GTCCTGCCTCACCTGCACTG
Caβ4 L02315 Sense GCTATGGTATTTGTTTGCTGGAAG 351 Antisense GACTGCAGAAGGAACAACACCTC
and by the fact that the cell nucleus was never harvested. Moreover controls in which the RT was omitted were performed giving negative results.
Pre-processing Expression and Electrical Data
Electrophysiological measurements were considered outliers if the value was six or more standard deviations from corresponding mean each of the 61 electrophysiological parameters. These outliers comprised only ∼1% of all measurements. Missing values were ignored in computing means and standard deviations and deleted pairwise for correlation analysis (below). For all analyses described below, each electrophysiological parameter was z-normalized (mean of zero and unit standard deviation) in order to provide a common scale of comparison.
The Operator
The operator consists of a family of multivariate linear regression models, one for each of the 61 z-normalized electrophysiological vari-ables, fit by minimizing the least squares error (SYSTAT, Richmond, CA; R Statistical System, v. 1.6.2, http://www.r-project.org). We used 10-fold cross-validation to estimate mean prediction error and to obtain scatter plots of actual-versus-estimated values. To test the statis-tical significance of the operator, we compared its prediction error to a distribution of errors obtained by generating 500 random cell-wise g-Profile permutations, each of which was used to fit and cross-validate a complete operator. To determine the most independent subsets of
predictor genes, we applied a bounds-and-branch exhaustive search for best subsets (LEAPS algorithm; R Statistical System; Miller, 2002). Searching for best subsets comprising 1–29 genes was computation-ally feasible for full model and bootstrapped modelling. We found no changes in best subset distributions when increasing from 400 to 800 bootstrap replications. Genes that survived the bootstrap test are defined as appearing in at least 80% of bootstrapped searches. Results
Gene Expression Profiles
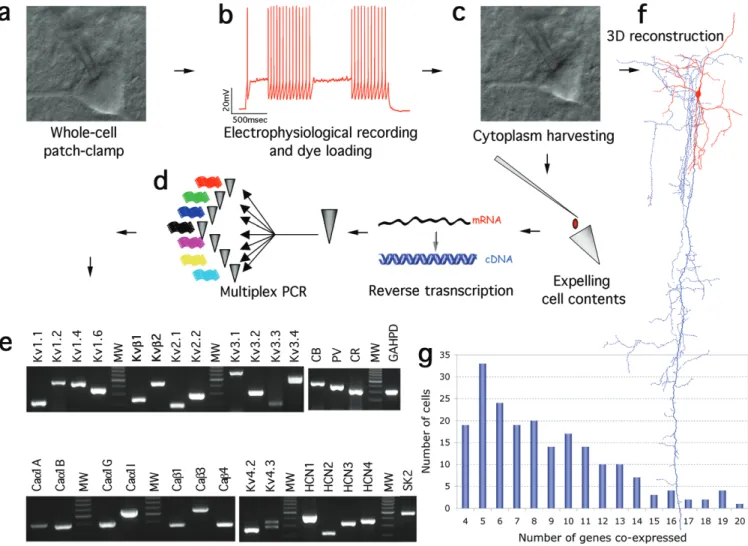
In order to correlate detailed electrical properties with gene expression profiles, we performed whole-cell patch-clamp recordings from neocortical neurons located in layers 2–6 of the somatosensory cortex of rats (P13–16, Fig. 1a), applied a comprehensive protocol for testing their electrical properties (Fig. 1b) and harvested their cytoplasm (Fig. 1c) for subsequent multiplex non-quantitative RT-PCR (Fig. 1d,e). We studied the simultaneous expression of 30 genes: 26 ion channels, including the voltage activated K+ channels [Kv1.1/2/4/6 (Table 2), Kvβ1/2, Kv2.1/2, Kv3.1/2/3/4, Kv4.2/3] (Rettig et al., 1994; Coetzee et al., 1999); the K+/Na+ permeable hyperpolarization activated channels (HCN1/2/3/4) (Santoro
Figure 1. Steps in single-cell multiplex RT-PCR. (a) Whole-cell patch-clamp of a neocortical neuron; (b) discharge response; (c) harvesting of the neuron’s cytoplasm; (d) multiplex
RT-PCR; (e) simultaneous detection of 30 mRNAs from a positive control sample (total brain mRNA). See Table 1 for size of the PCR product predicted by mRNA sequence. (f) Neurons were also loaded with biocytin for subsequent morphological classification. (g) Histogram showing the distribution of numbers of cells expressing different numbers of genes.
and Tibbs, 1999); the Ca2+ activated K+ channel (SK2) (Vergara et al., 1998); the voltage activated Ca2+ channels (Caα1A/B/G/ I, Caβ1/3/4) (Moreno Davila, 1999); three CaBPs [Calbindin (CB), parvalbumin (PV) and calretinin (CR)]; and the house-keeping gene GAPDH (as a quality control of the harvested mRNA). While >100 ion channel genes are potentially expressed in neurons, we focused on 26 thought to be crucial for the active and passive electrical properties of neurons (Fig. 1e; see also Table 1 and Materials and Methods). This profile of expressed genes by a specific neuron is referred to as g-Profile. During recordings, neurons were also loaded with the dye biocytin for subsequent histochemical staining to establish their morphological identity (Fig. 1f).
The major drawback in single-cell gene expression profiling, and in particular multiplex RT-PCR is a largely unknown number of false negatives due to failed mRNA harvesting or amplification (Monyer and Jonas, 1995). We addressed this problem directly by (i) carrying out an extensive iterative cali-bration to control for and setup the multiplex, (ii) recording from a large number of neurons (we recorded from 703 neurons, of which 115 were utilized for pharmacological tests and controls), (iii) selecting neurons for the quality of their expression and (iv) performing statistical modeling. The itera-tive calibration involved adjusting the concentration and specific mixtures of primers in order to minimize interactions as progressively more genes were added to the pool (Edwards and Gibbs, 1994). Indeed, we discarded six K+ and Ca2+ channel genes (Ca1αE, SK1, SK3, KChIP1, KChIP2 and KChIP3), because they could be reliably amplified individually, but not within the multiplex. Occurrence of false positives was ruled out in all cases by employing controls routinely throughout the multiplex RT-PCR procedure (see Materials and Methods). We encountered a false positive for only one gene (Ca1αH) in two batches (68 cells) and this gene was excluded from the entire study.
From a total of 703 neuronal recordings, 601 were harvested (those not harvested were used for pharmacological tests and controls). Of these, we selected the neurons expressing four or more genes (including GAPDH and a minimum of two ion channels; n = 203). Overall, 198 of these 203 neurons (97.5%) expressed three or more of ion channel genes (Fig. 1g).
Electrical Profiles
Neurons were submitted to a series of somatic current injec-tion protocols, during whole-cell patch clamp recordings, designed to capture their key active and passive electrical Table 2
Summary of the main properties of the ion channels described in this study
Channel Property Citation
Kv1.1 Voltage activated potassium channel Coetzee et al. (1999), Harvey (1997) Gives rise to a 4-AP-sensitive delayed rectifier current
DtxI and DtxK sensitive
Kv1.2 Volgate activated potassium channel Coetzee et al. (1999) Gives rise to a 4-AP-sensitive delayed rectifier current
DtxI sensitive
Kv1.4 Volgate activated potassium channel Coetzee et al. (1999) Gives rise to a 4-AP-sensitive ‘fast’ A type current
Kv1.6 Volgate activated potassium channel Coetzee et al. (1999) Gives rise to a 4-AP-sensitive delayed rectifier current
DtxI sensitive
Kv2.1 Volgate activated potassium channel Coetzee et al. (1999) Gives rise to a slow inactivating ‘delay’ current
Kv2.2 Volgate activated potassium channel Coetzee et al. (1999) Gives rise to a slow inactivating ‘delay’ current
Kv3.1 Volgate activated potassium channel Coetzee et al. (1999), Rudy and McBain (2001) Gives rise to a delay rectifier current with very slow
inactivation
Kv3.2 Volgate activated potassium channel Coetzee et al. (1999), Rudy and McBain (2001) Gives rise to a current similar to Kv3.1 but of smaller
amplitude
Kv3.3 Volgate activated potassium channel Coetzee et al. (1999), Rudy and McBain (2001) Gives rise to a current similar to Kv3.2 but of smaller
amplitude
Kv3.4 Volgate activated potassium channel Coetzee et al. (1999), Rudy and McBain (2001) Gives rise to a high voltage-activating, fast inactivating
current (A type)
Kv4.2 Volgate activated potassium channel Coetzee et al. (1999) Gives rise to low voltage activating A-type current
Kv4.3 Volgate activated potassium channel Coetzee et al. (1999) Gives rise to low voltage activating A-type current
Kvβ1 Auxiliary subunit of the Kv1 volgate activated potassium channel family
Coetzee et al. (1999), Retting et al. (1994) It speeds up the inactivation of Kv1 channels when
coexpressed
Kvβ2 Auxiliary subunit of the Kv1 volgate activated potassium channel family
Coetzee et al. (1999), Retting et al. (1994) Acts as a chaperon of the Kv1 ion channels
HCN1 Hyperpolarization activated sodium/potassium channel Santoro and Tibbs (1999) HCN2 Hyperpolarization activated sodium/potassium channel Santoro and Tibbs (1999) HCN3 Hyperpolarization activated sodium/potassium channel Santoro and Tibbs (1999) HCN4 Hyperpolarization activated sodium/potassium channel Santoro and Tibbs (1999) SK2 Small conductance calcium activated potassium channel Vergara et al. (1998) Caα1A Gives rise to a P/Qtype or high threshold voltage activated
calcium current
Moreno Davila (1999) Caα1B Gives rise to a N type or intermediate threshold voltage
activated calcium current
Moreno Davila (1999) Caα1G Gives rise to a T type or low threshold voltage activated
calcium current
Moreno Davila (1999)
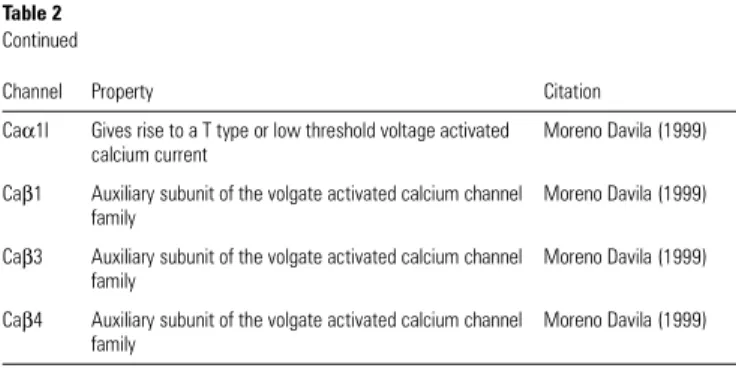
Table 2
Continued
For a more detailed description, see the references cited in column 3.
Channel Property Citation
Caα1I Gives rise to a T type or low threshold voltage activated calcium current
Moreno Davila (1999) Caβ1 Auxiliary subunit of the volgate activated calcium channel
family
Moreno Davila (1999) Caβ3 Auxiliary subunit of the volgate activated calcium channel
family
Moreno Davila (1999) Caβ4 Auxiliary subunit of the volgate activated calcium channel
family
properties (Fig. 2). We focused on the discharge responses to step current pulses (Fig. 2a), the shape of the first two action potentials (APs) generated just above threshold (Fig. 2b), the neuronal response to ramp current injection (Fig. 2c), the change in the spiking behavior with time (Fig. 2d), the after-depolarization generated by APs (Fig. 2e), the hyperpolariza-tion after a burst of APs (Fig. 2f), the subthreshold current-voltage relationship (Fig. 2g), the membrane time constant at different potentials (Fig. 2h), the membrane time constant for brief hyperpolarizing current pulses (Fig. 2i) and the resting membrane potential. A numerical breakdown of the electrical behavior was obtained by measuring various aspects of the voltage responses to these stimulation protocols yielding 61 key electrical parameters (EPs) (Table 3). This profile of 61 EPs representing the electrical behavior of each neuron is referred to as the electrical profile or e-Profile of the neuron.
Correlating Gene Expression and Electrical Profiles
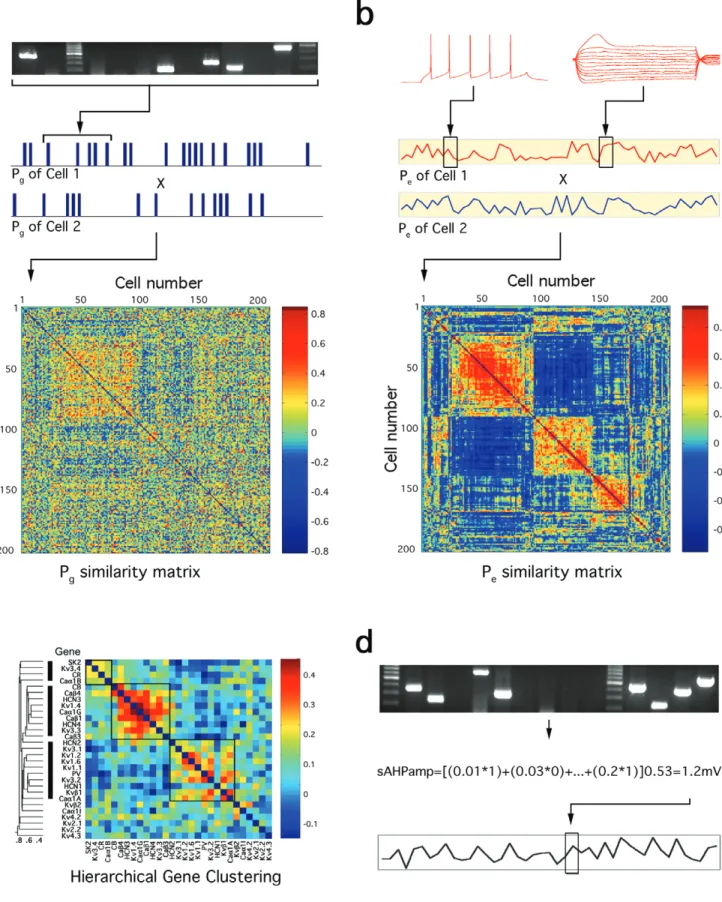
To determine whether it is possible to derive correlations between gene expression and the phenotype, we first exam-ined whether any relationship can be detected at all by comparing corresponding gene expression and electrical profiles across neurons. For each cell, the detected expression of a gene was coded as one and the absence as zero, obtaining what we refer to as the neuron’s gene expression profile or g-Profile (does not include GAPDH in the analysis because all the cells expressed this house-keeping gene). In this way, the g-Profile of each cell was represented by a vector of 29 ones (gene expressed) and zeros (gene not expressed; Fig. 3a). The g-Profile of each cell (vector of binary values) was correlated with the g-Profile of each of the other cells, thereby obtaining a correlation matrix of similarity representing the degree too
which an expression profile of a cell compares with that of others (Pearson correlation coefficient; Fig. 3a). On the colour scale, colours towards red indicate cell pairs that are more similar in terms of their gene expression profile. The same correlation was performed for the electrical profiles (e-Profile) except that the values were normalized analog values (Fig. 3b; see Table 3). A z-normalization was performed across cells to obtain a standard deviation of 1 around 0. Subsequently, the e-Profile of each cell (vector of 61 analog z-normalized EP values) was correlated with all other cells, producing another simi-larity matrix for the electrophysiological behavior (Fig. 3b; see Materials and Methods).
Shown sorted in the same cell order (based on maximal clus-tering of the e-Profiles), the similarity of the two matrices is very evident, indicating that neurons with similar electrical expression profiles express similar genes. Indeed, the Pearson correlation of these two matrices was 0.157 (95% CI = 0.144, 0.171), much higher than that expected by shuffling g- and e-Profiles (P < 0.001). The Spearman rho, 0.150, was essentially the same as the Pearson correlation, indicating no substantial bias due to distributional assumptions. This highly significant relationship of transcriptome subset and electrical phenotype justifies the predictive linear regression modeling described below.
Clusters of Expressed Genes
Before deriving the correlations between the gene expression profile and the phenotype, we wanted to know whether there is any detectable structure within the patterns of gene expres-sion. We therefore carried out an unsupervised gene cluster analysis (Ward, 1963; Fig. 3c) to determine co-expression tendencies. Because we did not know a priori the number of
Figure 2. Electrophysiological protocols. Voltage responses (upper traces) to injected current (lower traces): (a) discharge; (b) action potential (AP) wave-from; (c) AP threshold;
(d) AP drop; (e) afterhyperpolarization (AHP); (f) slow AHP; (g) voltage-current series; (h) input resistance; (i) delta. Voltage scale bars = 20 mV (a–f); 10 mV (g); 5 mV (h–i). Current scale bars = 400 pA (e); 200 pA (b, i); 100 pA (a, c, d, f–h). Time scale bars = 500 ms (a, c, f); 10 ms (b); 100 ms (d, i); 20 ms (e); 200 ms (g, h).
Table 3
Description of the 61 electrophysiological properties measured from the different stimulus patterns employed in this study No. Physiological properties Electrophysiological property studied
E1 Resting membrane potential (mV) Membrane potential at the onset of whole-cell
AP_Drop
E2 Drop in first to second spike (mV) Decrease in the amplitude of second AP evoked by a step current pulse five times the threshold current E3 Change to steady state (mV) Change in the AP amplitude during a burst of APs evoked by a step current pulse five times threshold current
E4 Change to steady state after second spike (mV) The change in the amplitude of the second AP during a burst of APs evoked by a step current pulse five times threshold current E5 Maximum rate of AP change (mV/AP) Maximum rate of change in the AP amplitude during a burst evoked by five times threshold current
AP1_Wave Form
E6 AP amplitude (mV) Average amplitude of the first AP
E7 AP duration (ms) Average time from AP onset (>1 mV/100 ms deflection) to offset (at same voltage) E8 AP duration half with (ms) Average time for first AP half amp to the same voltage during offset
E9 AP rise time (ms) First AP duration from onset to the peak
E10 AP fall time (ms) First AP duration from peak to the offset (Vm reaches that of onset)
E11 AP rise rate (mV/ms) First AP_amp/rise time
E12 AP fall rate (mV/ms) First AP_amp/fall time
E13 Fast AHP (mV) Amplitude from first AP onset to minimum voltage
AP2_Wave Form
E14 AP amplitude (mV) Average amplitude of the second AP
E15 AP duration (ms) Average time from AP onset (>1 mV/100 ms deflection) to offset (at same voltage) E16 AP duration half with (ms) Average time for second AP half amp to the same voltage during offset E17 AP rise time (ms) Second AP duration from onset to the peak
E18 AP fall time (ms) Second AP duration from peak to the offset (Vm reaches that of onset)
E19 AP rise rate (mV/ms) Second AP_amp/rise time
E20 AP fall rate (mV/ms) Second AP_amp/fall time
E21 Fast AHP (mV) Amplitude from second AP onset to minimum voltage
Change between first and second AP
E22 Change in AP amplitude (%) Percentage change in AP amplitude between the first and second AP E23 Change in AP duration (%) Percentage change in AP duration between the first and second AP E24 Change in AP duration half width (%) Percentage change in AP duration half width between the first and second AP E25 Change in AP rise rate (%) Percentage change in AP rise rate between the first and second AP E26 Change in AP fall rate (%) Percentage change in AP fall rate between the first and second AP E27 Change in AP fast AHP (%) Percentage change in AHP amplitude between the first and second AP
IV
E28 Input resistance for peak (MΩ) Maximum input resistance (peak voltage response to current injection)
E29 Input resistance for steady state (Ω) Input resistance at steady-state (steady-state of voltage response to current injection) E30 Rectification index for peak IV Change in input resistance at peak voltage
E31 Rectification index for steady state IV Change in input resistance at steady-state voltage
E32 Maximum sag is (mV) Difference between exponentially extrapolated voltage and steady-state voltage
Delta
E33 Delta average decay time constant (ms) Time constant for the membrane to depolarize after a 2 ms, 200 pA hyperpolarizing current injection AP_Threshhold
E34 AP threshold (mV) Threshold to discharge APs during a ramp depolarization
E35 AHP after first AP In the ramp (mV) Amplitude of the AHP after the first AP generated by a ramp current pulse
sAHP
E36 AHP amplitude 1 (mV) Maximal amplitude of the AHP recorded after a burst of APs E37 AHP amplitude 2 (mV) Amplitude of the AHP at 100 ms after the end of a burst of APs E38 Time to maximal AHP (ms) Time to the maximal AHP since the end of the burst
Discharge
E39 Slope of ID threshold The slope of the current-discharge relationship from discharge threshold E40 Average delay to first spike Time from current pulse onset to first AP
clusters to expect, we used a hierarchical technique that begins by assigning each gene to its own class. The class of each gene was represented by a vector or ones (expressed) and zeros (not expressed) across all 203 cells. We computed the Euclidian distance between each class (sum of squared differ-ences) and then combined classes as we gradually relaxed this distance criterion (Fig. 3c).
Four major clusters of genes that tend to co-express were discovered. Interestingly, three of these clusters each contained one of the three CaBPs widely used for classifying neocortical neurons and therefore we named them according to the CaBP they included. The ‘CR cluster’ contained SK2, Kv3.4, CR and Caα1B; the ‘CB cluster’ contained CB, Caβ4, HCN3, Kv1.4, Caα1G, Caβ1, HCN4, Kv3.3 and Caβ3; and the ‘PV cluster’ contained HCN2, Kv3.1, Kv1.2, Kv1.6, Kv1.1, PV, Kv3.2, HCN1, Kvβ1 and Caα1A. These three clusters are also consistent with the known biophysical properties of the different ion channels and CaBPs, which may complement each other to generate a broad class of discharge behaviors: the CR cluster is associated with accommodation of discharge (Vergara et al., 1998); the CB cluster is associated with bursting behavior (Ertel and Ertel, 1997), and the PV cluster is associ-ated with high frequency discharge (Martina et al., 1998; Chow et al., 1999; Rudy and McBain, 2001). These three clusters are also consistent with the known expression of CB, PV and CR in different types of neocortical neurons, further validating the sufficient level of accuracy of the expression profiling carried out in this study as well as the sufficient numbers of cells included in the data set for statistical modeling.
The Linear Operator
While many methods can be applied to derive the correlations between two vectors, as a first step we chose linear regression because this would allow reversible translation between profiles of expressed genes and the electrical phenotype. This operator provides coefficients, Ck, for the relative correlation
of the expression or non-expression of each gene, (mRNAk, 1
or 0, respectively) with the final value of each EP (EPi) (see
Materials and Methods; Fig. 3d):
where Ni is the normalization factor used to z-normalize EPi. A
profile of gene coefficients (PGC = {C1, C2, . . ., C29}) was independently obtained for each EPi by fitting to the
multiple regression model with a least-squares error func-tion. These regression coefficients provide a novel quantifi-cation of the relative correlation between the expression and non-expression of individual genes in the context of co-expressed genes with the value of each EP. The coefficients were represented on an analog scale where the highest coef-ficient predicts the maximal EP value recorded in any of the 203 cells (Fig. 4a).
Reliability of the Operator
The performance of the operator was tested in a number of different ways. The first approach was to generate the operator Table 3
Continued
No. Physiological properties Electrophysiological property studied E41 SD of delay to first spike SD of delays to first AP
E42 Average delay to second spike The average delay for the cell to generate a second AP E43 SD of delay to second spike SD of delays to second AP
E44 Average initial burst interval Average interspike interval for the first three APs E45 SD of average Initial burst interval SD of the average interspike interval for the first three APs E46 Average initial accommodation The initial change in the interspike interval during a burst E47 Average steady state accommodation Change in the interspike interval from onset to steady state E48 Rate of accomodation to steady state The rate of accommodation of the discharge to steady state E49 Average accomodation at steady state The average accommodation at steady state
E50 Average rate of accommmodation during steady state Average rate of accommodation during steady state E51 Average discharge CV The average coefficient of variation of the AP discharge E52 Average skew discharge Median of the distribution of interspike intervals E53 Average discharge stuttering Derivative of the vector of interspike intervals during a burst
Discharge threshold
E54 Slope of ID threshold Current-discharge relationship for stimulation currents twice threshold E55 Average discharge at threshold The average discharge at depolarization 1.5 times threshold current
E56 Average delay to first spike Time from current pulse onset to first AP after a threshold depolarizating current pulse E57 SD of delay to first spike SD of delays to first AP at depolarization currents at threshold
E58 Average delay to second spike The average delay for the cell to generate a second AP at depolarization currents at threshold E59 SD of delay to second spike SD of delays to second AP at threshold depolarization currents
E60 Average initial burst interval Average interspikes interval for the first three APs at depolarization currents at threshold E61 SD of average initial burst interval SD of the average interspike interval for the first three APs at threshold depolarization currents
EPi (Ck⋅m RNAk) N⋅ i k=1
29
∑
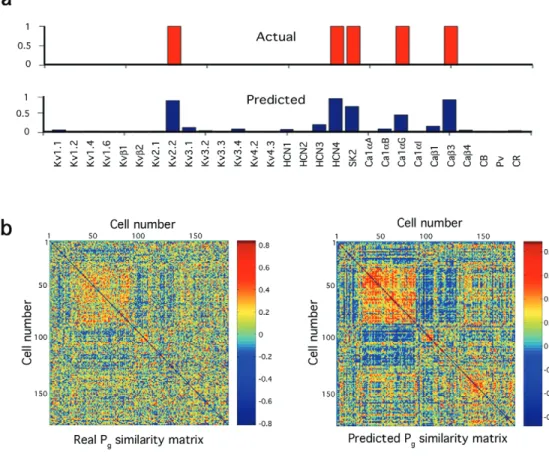
Figure 3. Profiles of gene expression and electrical behaviour. (a) Gene expression confirmed on agarose gel was denoted as a binary profile (g-Profile) for each of the 203 neurons
and compared pair-wise for similarity. The values of the pseudocolor scale are Pearson correlation coefficients. (b) Vector of 61 analogue electrical parameters (EPs) obtained from each neuron’s response to stimulation protocols were z-normalized (e-Profile) and compared pair-wise for similarity. The values of the pseudocolor scale are Pearson correlation coefficients. Sorting of cells in both matrices was determined by nearest neighbour clustering of the e-Profile similarity matrix. Pearson correlation between g-Profile and e-Profile matrices was 0.157 (P < 0.0001). (c) Gene clustering. Horizontal hierarchical tree-like structure based on Euclidian distances between binary vectors of expression of each gene (i.e. {C1, C2, . . . C203}, where Cn is either 1 or 0 for expression or non-expression in cell n). Pseudocolor matrix clustered by the same algorithm suggests three gene clusters. (d)
using only 90% of the cells and test the predictions of EP values using the remaining 10%. Figure 4b shows an example where several features of the AP waveform are predicted with >90% accuracy for one cell belonging to the 10% test group. The accuracy of using the coefficients to predict all 61 electrical parameters for a representative cell is shown in Figure 4c. We then generated 10 operators each time leaving out a different 10% of cells for the test set. The accuracy of predicting a single EP (e.g. AP duration) in all 203 cells is shown in Figure 4d. To evaluate the performance of the operator as a whole, for all parameters and all cells, we compared its average prediction error with the average prediction errors of operators generated by randomly shuffling the g- and e-Profiles (P < 0.0001; Fig. 4d). In another test we measured the variance accounted for by the coefficients to make the predictions. The mean was 14% (corrected R2 = 0.1443) for all the cells and all EPs, but the corrected R2 was much higher for many EPs, some even greater than 0.3, or 30%. The SD in the permutations is small, such that 3 SD is ∼0.1 R2 units. Therefore predictions with corrected R2 > 0.1, or 10%, are statistically meaningful (35 of the 61 EPs). An average operator was also generated from the 10 partial opera-tors with SDs that give an indication of the significance of the coefficient (data not shown).
We further tested the significance of the coefficients by searching for the minimal set of genes (best gene subsets, bGs) that independently predict the EPs (open circles in Fig. 4a; see Materials and Methods) and then tested which of these genes would survive a bootstrap re-sampling of the bGs modeling process, which tests for bias caused by under-sampling (solid circles in Fig. 4a). The bGs and the subset of genes surviving the bootstrap, overlay on virtually all strong, some moderate and a few weak coefficients, supporting the significance of the main predictions of the operator using these coefficients as well as identifying the limitations of the derived operator due to the methodological noise, nonlinearities, multicolinearities and limited sample size.
The Operator: General Observations
Figure 4a is a pseudocolored display of the regression coeffi-cients (weights) for all 29 genes in predicting each of the 61 EPs. The first important observation is that each gene contrib-utes significantly (adjusted for chance) to the prediction of each EP. Secondly, best-subsets analysis showed that no simple subset of genes can be used to predict all EPs, nor even EPs with moderate correlation; on average an overlapping 42% of genes independently predicts any given EP. Thirdly, the average correlation among sets of gene-wise weights was very low (mean, 0.02 ± 0.291), indicating that genes tend to contribute independently in predicting the electrical profile.
We did, however, notice a few strong deviations from this rule. Two gene trios were found to be strongly positively corre-lated (Kvβ2–PV, 0.7445; Kv1.4–PV, 0.6795; Kv1.4–Kvβ2, 0.5886) and (SK2–CR, 0.6336; SK2–Kv2.1, 0.597; Kv2.1–CR, 0.4954) indicating they are similarly correlated with the
elec-trical profiles. The genes in each trio were also strongly nega-tively correlated with the genes in the other group. This indicates that the expression of each of these two trios correl-ates with nearly opposite electrical profiles. Further gene pairs were found to be highly negatively correlated (Kv1.2–Kv3.1, –0.679 and Kv1.2–Kv3.2, –0.636; HCN4–PV, –0.694 and HCN4–Kvβ1, –0.63; Caβ4–SK2, –0.596 and Caβ4–CR, –0.614). We then examined how these gene pairs and trios are co-expressed and found four principles of co-expression: (i) some gene pairs such as SK2–CR, which have similar correlation profiles, can be co-expressed (see Fig. 3c), while (ii) other genes pairs, such as Kv1.1–Kv1.4 and PV–Kv1.4, which also have similar correlation profiles, are seldom co-expressed; (iii) gene pairs such as Kv1.2–Kv3.1 and Kv1.2–Kv3.2, which are correlated with opposite electrical values, are often co-expressed; while (iv) other gene pairs such as HCN4–PV, KCN4–Kvβ1, Caβ4–SK2 and Caβ4–CR, which are also corre-lated with opposite electrical values are seldom co-expressed. The apparent conflict between these finding is discussed further bellow.
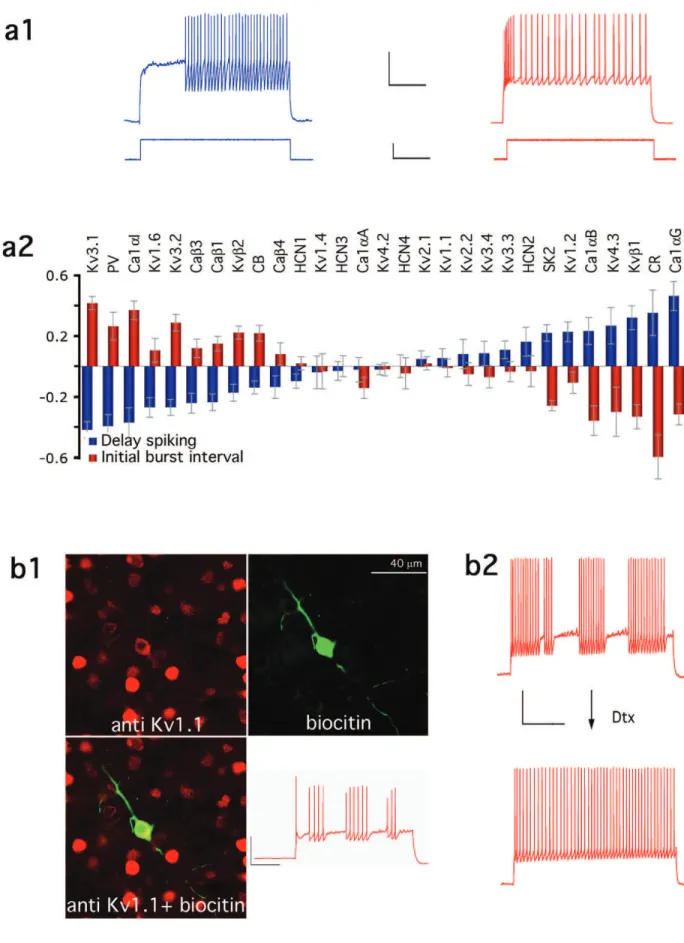
We noticed that some differences and similarities between the correlation profiles were surprising given their known biophysical properties. For example, the two low threshold Ca2+ channel genes, Caα1I and Caα1G, that both generate rather similar T-type Ca2+ currents were found to be nearly oppositely correlated with the frequency of the initial burst (see Fig. 5a2). The correlation profiles for the delayed recti-fiers Kv1.1 and Kv1.2 with very similar biophysical properties (Wang et al., 1999) are also nearly opposite. Similarly for the two hyperpolarization activated Na+/K+ channels HCN2 and HCN4. We also found examples of genes with similar correla-tion profiles that produce ion channels with very different biophysical properties. These include Kv4.3 (an A type channel) and Kv2.1 (a delayed rectifier) as well as Kv3.3 (another type of delayed rectifier) and Kv4.3. However, when we checked the co-expression of these genes pairs, we found that they were expressed in different neurons, indicating that the electrical properties with which an expressed gene is correlated, is strongly influenced by the type of neuron in which it is expressed.
The Operator: Specific Observations
The statistical validation of the operator provides confidence in the correlation coefficients allowing a more detailed analysis of the specific gene profile correlated with electrical properties. Four categories of electrical properties are discussed: the AP waveform, after hyperpolarization, passive properties and discharge behavior.
The profile of expression that correlated positively with brief APs, as found in high frequency discharging interneurons (genes whose coefficients were more than twice the standard deviation from the mean), includes PV, Kv1.4, Kvβ2, Kvβ1, Kv1.1, Kv3.2, Kv3.1 and Caβ4 and the profile that is negatively correlated includes CR, HCN1, HCN4, Caα1I, Caα1B, Kv1.2,
Figure 4. The operator. (a) Raster of pseudocolored weights of a multiple linear regression model, representing linear effects of the 29 ion channel and calcium binding protein
genes on 61 electrical parameters (EPs) for all 203 neurons. Superimposed open circle indicates genes whose independent correlations were confirmed by exhaustive best subset analysis (see Materials and Methods); superimposed solid circle indicates that corresponding genes appeared >80% of the time in 800 bootstrap repetitions of the operator (see Materials and Methods). (b) Measurement of three EPs relating to the first action potential (AP). Time scale bar = 10 ms. Voltage scale bar = 20 mV. (c) Calibration of predictions of AP-related parameters for one cell and (d) for all 61 parameters. (e) Mean residual regression error (blue) for all 203 cells and 61 parameters differs significantly from expected residual distribution (red) of 500 operators fitted to random cell-wise genetic profile (g-Profile) permutations (P < 0.0001).
SK2 and Kv2.1 (Fig. 4a, E7 ‘Average time from 1st AP onset’). A similar profile of expression is also correlated with the 2nd AP (Fig. 4a, E15 ‘Average time from 2nd AP onset’).
Many interneurons, especially the high frequency spiking interneurons, exhibit large afterhyperpolarizations immedi-ately after an AP (fAHP), which serves to remove Na+ channels from inactivation permitting high frequency discharge. The profile positively correlated with large amplitude fAHPs includes PV, Kv1.6, Kv3.1, Kv3.2 Caα1G and Caβ4 and the negatively correlated profile includes CR, Caα1I, Kv2.2, HCN4 and SK2 (Fig. 4a, E13 ‘Amplitude from 1st AP onset to minimum voltage’). The amplitude of the intermediate AHP following a burst of APs (measured as the amplitude at 100 ms after a burst) is positively correlated with the expression of SK2, HCN1, PV, Caα1B, CR, Kv1.2 and Kvβ1 and negatively with Kv3.3, Kv3.1, Kv4.2 and Kv3.2 (Fig. 4a, E37 ‘Amplitude of the AHP at 100 ms after the end of a burst of APs’).
Interneurons can differ greatly in terms of their input resist-ances (Chitwood et al., 1999). Figure 4a [E28 ‘Maximum input resistance (peak voltage response to current injection)’ and E29 ‘Input resistance at steady-state (steady-state of voltage response to current injection)’] illustrates the gene expression profiles that are positively correlated with the input resistance at the peak and steady state following a step current injection. The genes whose expression correlated positively with low input resistances include PV, Kvβ2, Kv3.2 and Caα1G and the expression profile correlated with high input resistances include CR, SK2, Kv4.3 and Caβ1. Another important passive property is a non-linear change in the membrane resistance (rectification) as a function of voltage; the expression profile correlated with high indices of refraction included HCN1, SK2, HCN2, HCN3, Kv2.2, Caβ1, CB and Kv1.1 and the absence of Kv3.3, Caα1B, Caα1A, Kvβ2 and Caα1I (Fig. 4a, E30 ‘Change in input resistance at peak voltage’ and E31 ‘Change in input resistance at steady-state voltage’). The resting membrane potential may also vary >10 mV; the expression profile corre-lated with positive potentials includes SK2, CR, Caα1G, Kvβ1 and Kv2.1 and the absence of PV, Kvβ2, Kv2.2, Caα1B, Kv1.4 and HCN3 (Fig. 4a, E1 ‘Membrane potential at the onset of whole-cell’). Finally, interneurons can differ strikingly in terms of their thresholds for AP generation. When submitted to a standard pulse (where the duration was fixed and the ampli-tude strength was scaled as described in Materials and Methods) high thresholds are positively correlated with PV, HCN1, Kv2.2, Caα1B, Caα1G and CR expression and nega-tively correlated with CB, Kv4.2, Kv3.4 and HCN4 expression (Fig. 4a, E34 ‘Threshold to discharge APs during a ramp depolarization’).
Figure 5a1 shows the representative responses for delayed (d-, left) and rapid (b-, right) onset responses. EPs that distin-guish these behaviors are the delay to spiking onset (Fig. 4a, E42 ‘The average delay for the cell to generate a 2nd AP’) and the mean inter-spike interval as the cell begins to discharge (Fig. 4a, E44 ‘Average interspike interval for the first 3 APs’). While differences in these two behaviors have been noted previously (Kawaguchi and Kubota, 1997; Gupta et al., 2000) it was not suspected that these two behaviors were opposite phenotypic classes of ‘fast reacting’ and ‘slowly reacting’ neurons until we noticed a near perfect inversion of the corre-lated gene expression profiles (Fig. 5a2).
The Operator as a Road Map
The linear operator is a correlation map that can now be used to translate the profiles of genes expressed into the electrical phenotype. These correlations do not imply any causality, but they can be used as a road map to explore the numerous potential causal steps between gene expression and the emergent behaviour. As an illustration, we tested for the pres-ence of the Kv1.1 protein whose mRNA expression was posi-tively correlated with an index of stuttering discharge (STUT, see Gupta et al., 2000) and which is supported by the best subsets analysis (Fig. 4a, E52 ‘median of the distribution of interspike intervals’). The presence of Kv1.1 protein in STUT cells was confirmed by immunohistochemical (Fig. 5b1) and pharmacological analysis. Indeed, application of dendrotoxin I (DtxI, 20 nM, n = 9), which blocks Kv1.1/2/6 or dendrotoxin K (DtxK, 10 nM, n = 9) which preferentially blocks Kv1.1 (Harvey, 1997), blocked stuttering and allowed unhindered fast spiking and non-adapting discharges in all cells tested (Fig. 5b2). This finding is also consistent with the involvement of Kv1.1 in a related firing pattern, the irregular discharging neuron (Porter et al., 1998).
Discussion
Using single-cell multiplex RT-PCR combined with whole-cell patch-clamp recordings we found a significant relationship between profiles of gene expression and profiles of electrical properties of neocortical neurons. We relied on this relation-ship to derive a linear operator that analytically predicts the phenotype from the gene expression profile. This correlation map represents the first quantification of the correlations between the expression of a profile of genes and the emergent phenotype. These coefficients provide a novel method with which to quantify not only correlations for expressed genes but also correlations for non-expressed genes with a spectrum of specific electrical properties. Patterns within these coeffi-cients verify and extend numerous previous reports in addition to providing a spectrum of novel insights into which single genes and profiles of genes, are correlated to electrical behav-iors. Furthermore, the correlation map combined with a co-expression analysis revealed novel principles of co-expression that may underlie the generation of electrical diversity.
The causal relationship between profiles of genes expressed and the electrical phenotype could be quantifiable in future studies by using the correlation map to generate hypotheses to knock-out, express, or silence multiple genes in different combinations and applying causally oriented statistical modeling. Using the techniques applied here, it would be possible to derive precise information about developmental changes in ion channel and calcium binding protein expres-sion, firing patterns and alterations that occur in cortical circuits in human brain disorders and related animal models. Moreover, the use of DNA microarrays with hundreds or thousands of simultaneously-measured mRNAs could make it possible to expand the descriptive and predictive accuracies of our approach to the whole transcriptome; this could facilitate identification of key nodes in complex networks, which can serve as therapeutic drug targets.
Gene Coefficients
Although our multiplex contains the largest collection of ion channels genes simultaneously studied from single electrically
Figure 5. Relative correlation of the different ion channel and calcium binding protein genes with electrical phenotypes. (a1) Typical cells demonstrating delayed (blue) and bursting
(red) transient responses to step current injection. Voltage scale bars = 20 mV (left), 30 mV (right). Time scale bar = 500 ms. Current scale bar = 200 pA (left) and 125 pA (right). (a2) comparison of regression coefficients for the delay to second spike (blue) and initial burst interval (red). (b) Immunohistochemical and pharmacological validation of the operator. (b1) Confocal images of a biocytin-filled STUT neuron counterstained with anti-Kv1.1 antibody. (b2) Representative responses of a STUT neuron before and after the application of dendrotoxin K (DtxK, 10 nM), suggesting that the STUT behaviour was due to the expression of Dtx-sensitive K+ channels. Voltage scale bar = 20 mV. Time scale bar = 500 ms.
and morphologically characterized neocortical neurons, this is only a subset of the genes that are relevant to the neuron’s elec-trical behavior. Since the number of genes that can be included in the multiplex is limited, we chose to include only those genes that produce ion channels: (i) whose activity may add significantly to the electrical behavior of neurons; (ii) whose biophysics are also well known; (iii) shown to be expressed in the neocortex (based on previous RT-PCR, immunohistochem-ical, in situ hybridization and pharmacological studies); and (iv) known to have some causal relationship with the behavior (Tanaka et al., 1995; Coetzee et al., 1999; Talley et al., 1999; Du et al., 2000; Shibata et al., 2000; Stocker and Pedarzani, 2000; Lien and Jonas, 2003). Aside from not selecting Na+ channel genes, our strategy was to continue adding K+ and Ca2+ channel genes to the multiplex until the calibration became too complex.
The usual measure employed when correlating gene expres-sion with electrical behavior of neurons is the ‘frequency of expression’. This measure, however, is susceptible to method-ological flaws in sensitively detecting mRNA expression and/or accurately characterizing specific phenotypes. Our approach to minimizing these biases was to quantify multivariate correl-ations between the expression of a gene and the value of a large repertoire of specific electrical parameters. We did not attempt to perform quantitative single-cell multiplex RT-PCR for two reasons. First, technical difficulties increase as a func-tion of the number of genes included in the multiplex due to non-specific interactions and competition for the reagents. Secondly, mRNA quantification will provide information about only a small part of the molecular cascade that gives rise to the phenotype. In order to unravel the causal chain of events leading from gene expression to electrical behavior one would also need to know the amount of protein translated from each mRNA species, the degree of ion channel heteromerization, the types of posttranslational modifications the protein under-goes, the functional state of each protein, the targeting of the protein and the rate of protein turnover. Although the correl-ations and associcorrel-ations established in our study can not prove causality they are required to support a causal hypothesis.
Reliability of Correlation Coefficients
Any method that attempts to detect genes expressed in a single-cell is likely to suffer from a significant incidence of false negatives. In this study the number of false negatives depends on the specific gene analyzed because each gene gives rise to a different number of mRNA molecules. We directly addressed this handicap by obtaining large numbers of neurons and performing statistical modeling.
Several findings indicate that this approach is valid and reli-able. Firstly, we found that cells with similar electrical behavior also have statistically significantly similar gene expression profiles. This finding together with the fact that these are two methodologically independent measures indicates that the expression and electrical profiling was sufficiently accurate to justify statistical modeling.
Secondly, we found three main clusters of ion channel gene co-expression, each one defined by a CaBP: CB, PV and CR. It is known from immunohistochemical, in situ hybridization and RT-PCR studies that these three CaBPs are largely expressed in different types of neurons (reviewed in, for example, DeFelipe, 1997; Kawaguchi and Kubota, 1997; Chow et al., 1999; Toledo-Rodriguez et al., 2002) further supporting the accuracy
of the expression profiles as well as validating the sufficient number of neurons obtained for this study. The expected biophysical properties of the produced ion channels in each cluster are also largely consistent with those supporting the three broad classes of electrical behaviors found in neocortical neurons (regular, bursting and fast firing). For example, several delayed rectifiers, between them the two members of the Kv3 family Kv3.1 and KV3.2, which have been previously shown to be highly correlated with narrow action potentials and high-frequency discharging (Martina et al., 1998; Erisir et al., 1999) were found in the PV cluster that correlates with fast firing neurons.
Thirdly, a cross-validation analysis indicated that many elec-trical parameters can be predicted with very low errors and that the entire e-Profile can be predicted with an accuracy that is statistically significant. Moreover, cross-validation was performed on cells not involved in constructing the operator, indicating that the coefficients allow predictions of electrical parameters from gene expression profiles for new cells that will be recorded in the future in this same species, age and brain region. How these coefficients will generalize to other species, ages and brain regions is an interesting issue for future study.
Fourthly, the correlation coefficients verify many past studies in terms of previously reported gene expression in specific neocortical interneurons using single-cell RT-PCR and other methods of ion channel localization, such as immuno-histochemistry and in situ hybridization and are consistent with biophysical properties of the ion channels that would be expected to result from this expression and their expected impact on the electrical behavior. While very little is known about which specific genes are expressed in single identified neurons in the neocortex, our data confirms the findings of those previous studies that reported a high correlation between the expression of the CaBP PV, the powerful delayed rectifiers Kv3.1 and Kv3.2 and fast spiking neocortical interneurons with brief action potentials (see Martina et al., 1998; Erisir et al., 1999; Rudy and McBain, 2001). We further extended these findings by showing that while less frequent, Kv3.1 and Kv3.2 are also expressed by neocortical pyramidal neurons [which is in agreement with a similar finding in hippocampal pyramidal neurons (Martina et al., 1998)].
In terms of consistency with predicted biophysical impact, the coefficients reveal: (i) a high correlation between the expression of the hyperpolarization activated Na+/K+ channels HCN1, HCN2 and HCN3 and voltage rectification, as seen in the hippocampus (see Magee, 1998); (ii) expression of the low threshold Ca2+ channel Caα1I (see Lee et al., 1999) and the auxiliary subunit Caβ3 (which accelerates the rate of inactiva-tion of the voltage activated Ca2+ channels to facilitate a tran-sient Ca2+ influx; Castellano et al., 1993), as in burst firing neurons in the hypothalamus (Fan et al., 2001); (iii) the expres-sion of Kv4.3 and Kvβ1 (which probably modifies Kv1.2 to produce a transient A type channel) and high threshold Ca2+ channels in delayed discharge neurons, as in neurogliaform cells in the neocortex (Kawaguchi and Kubota, 1997); (iv) the ion channels predicted to favor accommodation of the firing rate are biophysically consistent (expression of SK2); (v) the predicted Ca2+ channels that favor burst firing are biophysically consistent (alpha subunit Caα1G in addition to its three beta subunits Caβ1, Caβ3 and Caβ4, whose combined activity enables the explosive increase in the intracellular Ca2+
concen-trations underlying the initial burst); and (vi) the predicted ion channels that favor non-accommodation are also biophysically consistent and tend to co-express with PV.
In summary, the main the reliability of the PCR methodology is supported by: (i) the significant correlation among expres-sion and electrical profiles; (ii) the predictive power of the operator prediction electrical behavior from gene expression; (iii) the consistency of our findings with previous reports of expression in single neocortical neurons; and (iv) with the known biophysical properties of the ion channels.
Novel Correlations
This study reveals the simultaneous expression 26 of ion chan-nels and 3 CaBPs in neocortical neurons and a significant and quantifiable relationship between a small subset of the tran-scriptome and the electrical phenotype. This relationship exposes the specific genes that are correlated with specific electrical properties in neocortical neurons. For example, we found, in addition to Kv3.1, Kv3.2 and PV that expression of another delayed rectifier, Kv1.6, as well as the high threshold Ca2+ channel gene Caα1G and its β subunit, Caβ4 are also highly correlated with fast spiking, while CR, Caα1I, Kv2.2, HCN4 and SK2 expression are anti-correlated with this firing behavior. The operator also indicates that the precise pacing of the discharge to minimize accommodation in fast spiking neurons is correlated with the expression of the hyperpolariza-tion activated channels HCN1 and HCN2 and of Kvβ1 which is an auxiliary subunit of the Kv1 gene family that transforms these delayed rectifiers into transient A type channels (Rettig et al., 1994) that have important pacemaker properties (Adamson et al., 2002). Indeed, we also found that blockade of HCN chan-nels with the specific blocker ZD7288 (100 nM) converts high frequency evenly spaced firing into an interrupted pattern (data not shown).
This study further provides a cluster analysis of co-expres-sion of multiple genes across a large number of neurons revealing the specific ion channels that co-express with the three major CaBPs. By combining the co-expression results with the gene correlation coefficients, novel principles that govern expression in these electrically diverse neocortical neurons were found.
Gene Expression Principles
The coefficient matrix provides two measures of the relation-ship between gene expression and the electrical phenotype. The first is a multi-gene coefficient profile to evaluate the correlation of each gene with the value of a specific electrical parameter and the second is a single-gene coefficient profile that evaluates the correlation of one gene with the values of multiple electrical parameters. Comparison of single-gene coefficient profiles, revealed three features of the gene correlations. First, most genes displayed unique single-gene coefficients profiles, which indicates low potential functional redundancy. Secondly, the expression of some genes, even with different biophysical properties can demon-strate remarkably similar correlations with the electrical profile. Thirdly, the expression of some genes, even very similar biophysically, can demonstrate nearly opposite correla-tions with the electrical profile.
When we further combined these findings with the results from the co-expression, we found evidence to suggest four possible co-expression principles that may underlie the
elec-trical diversity: synergizing (genes expressed that correlate in the same manner and found in the same cells, e.g. SK2-CR); antagonizing (genes expressed that correlate oppositely but found in the same cells, e.g. Kv1.2–Kv3.1 and Kv1.2–Kv3.2); homogenizing (genes expressed that correlate in the same manner but are expressed in different cells, e.g. Kv1.1–Kv1.4 and PV–Kv1.4); and heterogenizing (genes that correlate in the opposite manner and expressed in different cells, e.g. HCN4–PV, KCN4–Kvβ1, Caβ4–SK2 and Caβ4–CR). These governing principles may enable the large diversity of elec-trical types and may explain how different morphological types of neurons can express the same electrical behavior.
Inversion of Gene Expression Profiles
Typically interneurons are classified into fast, burst and regular firing. Recently a more detailed classification scheme was proposed in which fast firing cells are sub-classified according to their onset response: one sub-class where the neuron responds to a depolarizing current pulse with a delayed discharge, one sub-class in which the neuron begins with a high frequency burst and one sub-class that does not display any special onset response. The current study demonstrates that the entire expression profile that was tested is inverted when comparing delayed onset to burst onset neurons. This finding indicates that these two subclasses of neurons, which have previously been classified into the same broad group as fast spiking, are essentially opposite types of neurons. To our knowledge, such a phenomenon has never been reported before and alludes to upstream control of the entire gene expression profile possibly by a few transcription factors. Understanding how many upstream genes control the expres-sion of entire profiles of genes could solve a long-standing problem of whether electrical behavior is expressed either to form a continuous diversity or a finite number of classes.
Expression Principles in Different Morphological and Electrophysiological Types
The present study purposefully avoided the problem of classi-fying electrical behavior according to the gross and subjec-tively defined electrical classes because the statistical modeling approach requires an unbiased numerical breakdown of the electrical phenotype. We recorded from as many different types of neocortical neurons (including pyramidal neurons) as possible so that the maximal ranges of values for the different electrical parameters would be represented. The diversity in this study is therefore an advantage rather than an intractable problem. The study also included neurons with diverse morphologies and since a correlation map could be derived despite this morphological diversity, these correlations are inde-pendent of morphology. This does not mean that morphology is irrelevant, just that the coefficients reflect the morphology-independent component of the electrical behavior. Taking morphology into account in future studies could add greatly to understanding the relationship between ion channel genes, morphology and electrical behavior. Nevertheless, solely based on frequency of expression Kv2.1, HCN4, Kv4.2, Kv1.1 and some of the voltage activated Ca2+ channels were the ion chan-nels with the highest expression in pyramidal neurons, Kv3.1, Kv3.2, Kv3.3, PV, HCN1, HCN2 and HCN3 were the ion chan-nels with the highest expression in large basket cells and Kv2.1, Kv3.3, Kv4.2, HCN4 and Kv3.1 were amongst the chan-nels with the highest expression in Martinotti cells. This