Publisher’s version / Version de l'éditeur:
Vous avez des questions? Nous pouvons vous aider. Pour communiquer directement avec un auteur, consultez la
première page de la revue dans laquelle son article a été publié afin de trouver ses coordonnées. Si vous n’arrivez pas à les repérer, communiquez avec nous à PublicationsArchive-ArchivesPublications@nrc-cnrc.gc.ca.
Questions? Contact the NRC Publications Archive team at
PublicationsArchive-ArchivesPublications@nrc-cnrc.gc.ca. If you wish to email the authors directly, please see the first page of the publication for their contact information.
https://publications-cnrc.canada.ca/fra/droits
L’accès à ce site Web et l’utilisation de son contenu sont assujettis aux conditions présentées dans le site LISEZ CES CONDITIONS ATTENTIVEMENT AVANT D’UTILISER CE SITE WEB.
Atmospheric Measurement Techniques, 10, 9, pp. 3231-3248, 2017-09-04
READ THESE TERMS AND CONDITIONS CAREFULLY BEFORE USING THIS WEBSITE.
https://nrc-publications.canada.ca/eng/copyright
NRC Publications Archive Record / Notice des Archives des publications du CNRC :
https://nrc-publications.canada.ca/eng/view/object/?id=21341f93-ab8e-477d-8993-c2d815b8cdc9
https://publications-cnrc.canada.ca/fra/voir/objet/?id=21341f93-ab8e-477d-8993-c2d815b8cdc9
NRC Publications Archive
Archives des publications du CNRC
This publication could be one of several versions: author’s original, accepted manuscript or the publisher’s version. / La version de cette publication peut être l’une des suivantes : la version prépublication de l’auteur, la version acceptée du manuscrit ou la version de l’éditeur.
For the publisher’s version, please access the DOI link below./ Pour consulter la version de l’éditeur, utilisez le lien DOI ci-dessous.
https://doi.org/10.5194/amt-10-3231-2017
Access and use of this website and the material on it are subject to the Terms and Conditions set forth at
Intercomparison study and optical asphericity measurements of small
ice particles in the CERN CLOUD experiment
Nichman, Leonid; Järvinen, Emma; Dorsey, James; Connolly, Paul;
Duplissy, Jonathan; Fuchs, Claudia; Ignatius, Karoliina; Sengupta, Kamalika;
Stratmann, Frank; Möhler, Ottmar; Schnaiter, Martin; Gallagher, Martin
https://doi.org/10.5194/amt-10-3231-2017 © Author(s) 2017. This work is distributed under the Creative Commons Attribution 3.0 License.
Intercomparison study and optical asphericity measurements of
small ice particles in the CERN CLOUD experiment
Leonid Nichman1,a,b, Emma Järvinen2, James Dorsey1,3, Paul Connolly1, Jonathan Duplissy4, Claudia Fuchs5, Karoliina Ignatius6, Kamalika Sengupta7, Frank Stratmann6, Ottmar Möhler2, Martin Schnaiter2, and Martin Gallagher1
1School of Earth, Atmospheric and Environmental Sciences, University of Manchester, Manchester M13 9PL, UK 2Institute of Meteorology and Climate Research, Karlsruhe Institute of Technology, P.O. Box 3640, 76021, Germany 3National Centre for Atmospheric Science, Manchester, UK
4Department of Physics, P.O. Box 64, 00014 University of Helsinki, Helsinki, Finland 5Laboratory of Atmospheric Chemistry, Paul Scherrer Institute, Villigen, Switzerland 6Leibniz Institute for Tropospheric Research (TROPOS), 04318 Leipzig, Germany 7University of Leeds, School of Earth and Environment, Leeds LS2-9JT, UK anow at: Department of Chemistry, Boston College, Chestnut Hill, MA, USA bnow at: Aerodyne Research, Inc, Billerica, MA, USA
Correspondence to:Leonid Nichman (leonid.nichman@manchester.ac.uk) Received: 17 June 2016 – Discussion started: 3 August 2016
Revised: 7 July 2017 – Accepted: 28 July 2017 – Published: 4 September 2017
Abstract. Optical probes are frequently used for the detec-tion of microphysical cloud particle properties such as liq-uid and ice phase, size and morphology. These properties can eventually influence the angular light scattering prop-erties of cirrus clouds as well as the growth and accretion mechanisms of single cloud particles. In this study we com-pare four commonly used optical probes to examine their response to small cloud particles of different phase and as-phericity. Cloud simulation experiments were conducted at the Cosmics Leaving OUtdoor Droplets (CLOUD) chamber at European Organisation for Nuclear Research (CERN). The chamber was operated in a series of multi-step adiabatic ex-pansions to produce growth and sublimation of ice particles at super- and subsaturated ice conditions and for initial tem-peratures of −30, −40 and −50◦C. The experiments were performed for ice cloud formation via homogeneous ice nu-cleation. We report the optical observations of small ice par-ticles in deep convection and in situ cirrus simulations. Ice crystal asphericity deduced from measurements of spatially resolved single particle light scattering patterns by the Parti-cle Phase Discriminator mark 2 (PPD-2K, Karlsruhe edition) were compared with Cloud and Aerosol Spectrometer with Polarisation (CASPOL) measurements and image roundness
captured by the 3View Cloud Particle Imager (3V-CPI). Av-eraged path light scattering properties of the simulated ice clouds were measured using the Scattering Intensity Mea-surements for the Optical detectioN of icE (SIMONE) and single particle scattering properties were measured by the CASPOL.
We show the ambiguity of several optical measurements in ice fraction determination of homogeneously frozen ice in the case where sublimating quasi-spherical ice particles are present. Moreover, most of the instruments have diffi-culties of producing reliable ice fraction if small aspherical ice particles are present, and all of the instruments cannot separate perfectly spherical ice particles from supercooled droplets. Correlation analysis of bulk averaged path depo-larisation measurements and single particle measurements of these clouds showed higher R2 values at high
concen-trations and small diameters, but these results require fur-ther confirmation. We find that none of these instruments were able to determine unambiguously the phase of the small particles. These results have implications for the interpreta-tion of atmospheric measurements and parametrisainterpreta-tions for modelling, particularly for low particle number concentra-tion clouds.
1 Introduction
One of the first attempts to distinguish ice particles from water drops in the atmosphere was made almost 70 years ago in the Thunderstorm project (Byers and Braham, 1948), during which it was noted that ice particles produce a dif-ferent sound compared to water drops when they impact the canopy of the aircraft. Since then, there have been many developments of airborne instruments for the mea-surement of cloud microphysical properties. Wendisch and Brenguier (2013) compiled a comprehensive list covering 48 different instruments, many of which are historical, but re-cently there have been several new developments, e.g. Ab-delmonem et al. (2016) and Baumgardner et al. (2014, 2017). Many of the current techniques, however, are technologi-cal improvements on previous instruments originally devel-oped and flown in the 1970s. An ongoing problem is the in situ measurement of concentrations of small ice crystals <100 µm in size. Accurate measurements of ice crystal size distributions are necessary for evaluation of ice cloud radia-tive effects, development and evaluation of remote sensing algorithms, evaluation of aerosol impacts and ultimately cor-rect representation of ice clouds in climate models (Jensen et al., 2009).
This microphysical information is also important in re-search of early ice formation, when initial ice particles in low concentrations push the sampling volume limits of many in-struments (Johnson et al., 2014). Optical methods are prefer-ably employed both for remote sensing of clouds and for in situ single particle measurements. High-resolution measure-ment of the forward-scattered light pattern is compared here with the mean scattering intensity from ensemble measure-ments, where shape information (i.e. asphericity) is averaged due to different orientations of the particles in the measuring volume (Sachweh et al., 1999).
Droplet concentration in clouds normally varies between several tens and hundreds of cubic centimetres, while typi-cal ice crystal concentration is normally a few particles per litre but can reach ∼ 100 L−1in some clouds (Wallace and Hobbs, 2006). The diameter of single droplet or ice crystal is normally in the supermicron range and can reach several hundred micrometres. The initial shape of ice particles may be indistinguishable from water droplets. Optically ambigu-ous shapes of liquid and solid cloud particles such as water, frozen droplets and quasi-spherical ice (Gayet et al., 2012; Järvinen et al., 2016c) may be detected simultaneously in the troposphere. Some of these particle phases coexist for long periods of time, e.g. in long-lived mixed-phase stratiform layers (Korolev and Isaac, 2003a). The resolution of most op-tical probes, coupled with coincidence problems, prevents a clear determination of particle shape for particle sizes smaller than 100 µm in such clouds. In glaciated clouds, Cober et al. (2001) applied geometric formulas to 2-D images, iden-tifying between 5 and 40 % of them as circular. Spherical particles were observed in large numbers by Korolev and
Isaac (2003b) even in clouds subsaturated with respect to water. Moreover, Jensen et al. (2013) report vertically thin cirrus layers with high ice concentration (up to 10 000 L−1) of small ice crystals, which can only be produced by ho-mogeneous freezing of an abundant population of aqueous aerosols. As a result of this shape ambiguity and low reso-lution of small sizes, our fundamental knowledge of small cloud particle microphysics is still far from complete.
Large supercooled water droplets up to 5 mm in diameter exist only at warmer ambient temperatures, but smaller cloud droplets may frequently exist in a supercooled state down to −20◦C and less frequently as low as the homogeneous freez-ing level (Elliott and Smith, 2015; Rosenfeld and Woodley, 2000). Furthermore, very small supercooled water droplets may stay in a metastable liquid condition down to −40◦C
(Korolev and Isaac, 2003a). Pilots often reported deviating around convective clouds due to the danger of ice accretion of supercooled droplets (Jeanne et al., 2006). Therefore, an inaccurate classification of spherical shapes may directly af-fect the routes and costs of commercial flights (Gallagher et al., 2016).
Frozen droplets are an important feature of mid-latitude anvil cirrus. In fact, frozen droplets and frozen droplet ag-glomerates are also a dominant particle type in higher anvil outflow clouds (Stith et al., 2014; Järvinen et al., 2016c). Frozen droplets could also be responsible for first ice ini-tiation in deep convective clouds (Taylor et al., 2016). Al-though frozen droplets are frequently measured, our under-standing of the microphysical and optical properties of these quasi-spherical ice particles is somewhat vague. The process by which frozen droplets are formed can play an important role in their morphology. Microscopic structures, like surface roughness, as well as detailed information on the aspect ra-tios of the frozen droplets found in clouds are key variables required to determine the optical parameters that are included in the modelling and prediction of the climate effect of these cloud systems.
In addition, quasi-spherical ice shapes are common in cir-rus. Luebke et al. (2016) and Garrett et al. (2005) report the presence of many quasi-spherical ice particles in cirrus, es-pecially at the smaller sizes. Quasi-spherical ice prevails also in contrails at low temperatures below about −55◦C. In the core of the contrail, high crystal concentrations reduce the vapour density to saturation, causing the ice particle to re-tain a nearly spherical shape (Lawson et al., 1998; Lynch, 2001). Contrail cirrus cover is small compared to natural cir-rus; nonetheless, they still have a climatic impact with the constant increase in jet aircraft traffic (Stordal et al., 2005; Irvine and Shine, 2015).
Cloud particles measurements on aircraft campaigns herently suffer from limited spatial coverage and limited in-strument sampling volumes. Cirrus clouds do not have an obvious formation stage, and therefore it is not possible to reliably position a research aircraft in their development stage (Lawson et al., 2006a). Remote sensing provides
av-eraged features but is insensitive in cases of subvisual or contrail cirrus. Conversely, chamber experiments provide a well-controlled and pristine environment for simulations and instrumental comparison, although the role of the ice nu-cleation process in the atmosphere may change with time through the life cycle of a convective cloud, for example, and is strongly influenced by the environmental airflow (Heyms-field et al., 2005; Zhang and Harrington, 2015).
Our chamber campaign investigating the homogeneous freezing process relevant to the upper region of deep con-vective clouds and in situ formed cirrus in pristine envi-ronments was conducted at the European Organisation for Nuclear Research (CERN) in 2013, hereafter referred to as CLOUD 8. The goal of the experiments presented here was to complement and extend the results previously obtained in the Aerosol Interaction and Dynamics in the Atmosphere (AIDA) chamber with similar instruments (Järvinen et al., 2016c; Schnaiter et al., 2016) such as observation of mor-phological features and confirmation of a possible pathway for quasi-spherical ice formation which affects growth and sedimentation mechanisms of ice in clouds. Additionally, a comparative analysis of four optical probes is reported in this paper to provide clarification of optical measurements in several respects: single particle versus averaged path op-tical measurements, polarisation measurements versus depo-larisation and asphericity derivation. These were addressed using measurements from current instrumentation techniques for both in situ and path averaged chamber studies and in-clude scattering patterns of the near-forward-scattered light measured by the Particle Phase Discriminator mark 2 instru-ment (PPD-2K, Karlsruhe edition), single particle polarisa-tion properties measured by the Cloud and Aerosol Spec-trometer with Polarisation (CASPOL, DMT-NCAS version) and image analysis provided by the 3View Cloud Particle Imager instrument (3V-CPI, SPEC Inc.). Data products from such measurement techniques are often used to prescribe par-ticle asphericity, which is then often used to determine the ice number and mass fraction in a cloud, assuming that the “ice” fraction is equivalent to an aspherical fraction. This practice is tested in our experiments.
2 Methodology
2.1 The CLOUD chamber
The chamber facility at CERN has been described in detail by Duplissy et al. (2016), Kirkby et al. (2011) and Guida et al. (2013). The expansion system installed at the Cosmics Leaving OUtdoor Droplets (CLOUD) chamber allows pro-duction of relatively high cooling rates, above 5◦C min−1, compared to the AIDA chamber, where maximum cooling rate of 4◦C min−1is typically achieved (Möhler et al., 2006; Järvinen et al., 2016c). Stronger cooling rates will activate a higher fraction of the aerosol by driving higher peak
su-persaturation. Since the liquid water content that freezes does not vary with updraft strength, the freezing of more numerous droplets in the faster updrafts simply produces smaller ice particles. This is clearly shown by Ackerman et al. (2015), in which ice particle mass distributions in homo-geneous freezing for stronger updrafts produce substantially smaller ice particles. Schnaiter et al. (2016) further showed that high ice particle growth rates also enhance the forma-tion of small-scale complexity, such as ice particle surface roughness. Gayet et al. (2011) reported that in a deeply rough surface the mean free path length between two subsequent inclusions was equal to 15 % of the diameter of the circle cir-cumscribing the hexagonal facet of an ice crystal. Following the procedure suggested by Schnaiter et al. (2016), we have simulated similar conditions for the derivation of aspherical fractions and instrumental intercomparison in the CLOUD chamber (Fig. S1 in the Supplement), where ice particles are sequentially sublimated and then grown under different su-persaturated conditions. This multi-step adiabatic expansion mechanism allows the regrowth of ice after sublimation as will be explained in the next section.
2.2 Overview of the homogeneous freezing experiments In the cloud chamber experiments, we have simulated some of the homogeneous freezing processes taking place in the deep convective cloud systems, i.e. with updraft veloci-ties up to 5 m s−1 with corresponding cooling rates up to 5.8◦C min−1. In the following sections we present the evo-lution of the ice particle shape upon freezing, sublimation and re-growth periods from selected representative individ-ual experimental runs. Overall, all the results from repeated individual experiments agreed well with each other. A rep-resentative list of the conducted experiments can be found in Table 1. The technical description of the CLOUD cham-ber pressurisation, cloud condensation nuclei (CCN) injec-tion and expansion of the air volume in a multi-step regime is given in detail elsewhere (Nichman et al., 2016; Duplissy et al., 2016; Guida et al., 2012, 2013) and will be briefly de-scribed here.
Continuous attempts to find an accurate ice cloud classi-fication have led to the suggestion of new definitions of liq-uid origin cirrus clouds and in situ generated cirrus clouds (Krämer et al., 2016; Luebke et al., 2016). The liquid ori-gin cirrus class comprises those clouds where ice crystals are formed by homogeneous freezing of liquid drops lower in the atmosphere and which are then uplifted into the cir-rus temperature range. In situ circir-rus class clouds are those which may form in fast updrafts triggered by jet streams or lee waves. This class is characterized by high IWC and many small ice crystals. The formation mechanism in this case is insensitive to IN properties and dominated by homogeneous freezing. The expansion profiles used in the CLOUD cham-ber allow simulation of both these types of clouds.
Table 1. List of experiments. CCN concentration measured with CPC at the beginning of each expansion. Cloud particle dN/dlogDp(water
and ice) for the mean diameter is shown in the last column.
Exp. CCN conc. Cooling rate T start Mean diameter dN/dlogDp
number (cm−3) (◦C min−1) (◦C) (µm) (cm−3) 1276.05 220 −5.0 −40 7.9 48.0 1291.07 160 −5.8 −30 10.0 41.7 1291.12 110 −4.8 −30 15.0 30.0 1292.01 150 −4.9 −30 12.0 41.7 1298.12 110 −2.1 −50 9.0 6.5 1298.20 750 −3.1 −50 8.0 9.9
The homogeneous freezing experiments commenced in a pressurised chamber volume, at 123.3 kPa, with a CCN injec-tion. The sulfuric acid solution droplets, used as CCN, were generated in a sulfuric acid generator consisting of heated sulfuric acid reservoir and airflow past the reservoir. A more detailed explanation of the generation method can be found in Wagner et al. (2008). By varying the duration of the sul-furic acid injection we controlled the number concentration of the sulfuric acid droplets, and by adjusting the tempera-ture of the sulfuric acid reservoir and the airflow rate through the heated reservoir we controlled the mean size of the CCN particles.
The CLOUD chamber is surrounded by an insulated ther-mal housing, which allows precise regulation of the internal temperature with stability within 0.1◦C. Dias et al. (2017) found that larger temperature non-uniformities of up to around ±1.0◦C are present at the minimum temperature reached after an adiabatic expansion compared with oper-ation under equilibrium conditions, in both radial and ver-tical directions. The turbulence induced by the expansion ensures complete mixing of the chamber during the expan-sion. Thermal non-uniformities in the radial direction subse-quently decrease as the air reheats. The in situ temperature values used here were measured close to the centre of the chamber, and to the sampling plane of CASPOL (Fig. S1), at 1.2 m distance from the walls using a PT100 temperature sensor (Duplissy et al., 2016; Dias et al., 2017). For pres-sure monitoring in the chamber, we used the VEGABAR 53 process pressure transmitter (VEGA). The total humid-ity inside the chamber was measured by a fast chilled-mirror frost-point hygrometer (MBW, model 373LX). The relative humidity (RH) with respect to water and ice (see the exam-ple in Fig. 1a) was calculated from dew and frost points us-ing water and ice saturation vapour pressure at the measured temperature (Buck, 1996) with correction for the contribu-tion from the condensed phase due to a higher temperature in the MBW sampling line.
At the beginning of most experiments, we generated low concentrations (∼ 100 cm−3) of sulfuric acid aerosol. Concentrations were measured with a condensation particle counter (CPC; TSI model 3010). At these concentrations, all
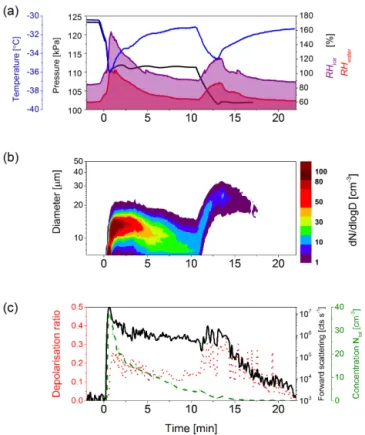
Figure 1. Homogeneous ice nucleation and regrowth experiment no. 1292.01 (−30◦C). (a) The temporal development of pressure, temperature and RH calculated from the chilled mirror hygrometer (MBW 373LX) and thermocouples measurements at the mid-plane of the chamber. The lowest temperature measured after the expan-sion was ∼ −37◦C at a lower section of the chamber (Fig. A2), but lower temperatures are probable at the bottom of the cham-ber due to the temperature gradient. RH with respect to ice is shown in purple and with respect to water (RHwater)in red. Cloud
forms at t = 0 min. At the mid-plain RHice-max∼158 % lasted for
∼20 s. (b) The particle number size distribution measured with PPD-2K. (c) SIMONE measurement of the forward scattering inten-sity (counts s−1, black solid line) and depolarisation ratio (red dot-ted line) together with the total number concentration (Ntotcm−3)
seed aerosols will act as CCN at almost the same time and further homogeneous nucleation and growth of the ice crys-tals would occur upon further expansion cooling. All the ex-periments were initiated slightly below ice saturated condi-tions at temperatures near −30, −40 and −50◦C (Figs. 1a, A1 in the Appendix). In the experiments starting at −30◦C we cooled the chamber air by expanding the volume un-til supercooled liquid droplets were formed. A fraction of the droplets were grown by further cooling until ice started to form by homogeneous freezing of the supercooled water droplets. The ice particles then grew until the expansion was stopped and the formed ice crystals started to sublimate un-der ice subsaturated conditions, induced by an increase in temperature due to the heat flow from the warm chamber walls. The lowest measured temperature reached at the bot-tom section of the chamber is ∼ −37◦C. After the end of
the expansion, the temperature of the chamber is maintained for several tens of seconds until the reheating process takes place. The upper section of the chamber is warmer than the average temperature by ∼ 1.5◦C (Fig. A2). A second step in the expansion profile then allowed the regrowth of the subli-mating particles.
The experiments at −50◦C were started similarly by cool-ing the chamber volume until the first ice particles were formed by deposition nucleation. After the first ice particles were detected and had grown in size (see Table 1), we pro-ceeded to the next step of the multistep expansion profile as discussed above.
2.3 Cloud probes 2.3.1 PPD-2K
The PPD-2K instrument used here has a light source con-sisting of a frequency-doubled Nd:YAG laser which emits 100 mW at a wavelength of 532 nm. The sensitive areas of the trigger detector and camera are identical (∼ 2.5 mm2). The trigger count rate and pulse intensities are used to derive particle number concentrations and particle number size dis-tributions. Reduction of the sample volume due to electronic dead time is corrected according to Vochezer et al. (2016). The classification of cloud particles by the PPD-2K is based on a spatial analysis of high-resolution intensity patterns of single particles in the 5 to 26◦ forward scattering angular range. In the scattering patterns of (spherical) droplets we normally observe concentric rings at angular positions corre-sponding to the maxima intensities predicted by Mie theory. The sampling flow of the instrument was set to 5 L min−1 with a sheath flow of 2 L min−1. Due to detection limitation in small ice spectrometers currently, major coincidence er-rors at even moderate concentrations, particularly in mixed-phase clouds, can become an issue (e.g. Hirst et al., 2001; Cotton et al., 2010; Vochezer et al., 2016). However, based on the total particle concentrations expected in our chamber experiments the calculated probability for coincidence was
negligible, < 1 % in most cases (Eq. 1c in Vochezer et al., 2016).
We used computerised discrimination of images with con-centric rings from images without the rings based on variance calculation of the image pixels along the polar integrated az-imuthal intensity profiles (Vochezer et al., 2016; Järvinen et al., 2016c). Aspherical fractions were determined by apply-ing a threshold variance value of 10−5. This threshold is con-firmed based on the visual inspection of diffraction patterns of ice and droplets in all chamber experiments. Images with low variance, corresponding to concentric rings, were clas-sified as spherical (e.g. droplets). Similarly, in the case of ice particles with mean variance below this value the par-ticles were classified as spherical. Ice habits, e.g. columns and plates, have characteristic scattering patterns which al-low classification of the detected particles. More technical details are described in Vochezer et al. (2016).
2.3.2 SIMONE
The averaged path SIMONE-Junior (Järvinen et al., 2016b) was installed in the chamber to provide bulk depolarisation measurements. This instrument technique is in effect com-parable to a lidar and is used to detect phase transitions in aerosol, cloud particle ensembles and to investigate the bulk microphysical properties of clouds. The instrument projects a 552 nm polarised (e.g. perpendicular, parallel and circular) light beam and detects forward- and backward-scattered light from a cloud volume of 30 cm3. Unlike a lidar measurement, parallel and perpendicular components of the backscattered light are measured around the detection angle of 176◦, at a very confined angular range with an acceptance angle less than 0.8 mrad. The linear depolarisation ratio is expected to be zero for spherical particles and non-zero when par-ticle shapes deviate from spherical. Forward scattering in-tensity is measured at 4◦. The operation of the SIMONE in the CLOUD chamber is described in detail by Järvinen et al. (2016a). The basic instrument concept and data interpre-tation in case of chamber ice clouds are detailed in Schnaiter et al. (2012).
2.3.3 Airborne probes CASPOL
The CASPOL installed in the chamber was part of the Cloud, Aerosol, and Precipitation Spectrometer (CAPS, Droplet Measurement Technologies), an instrument commonly used on aircraft for cloud microphysical measurements (e.g. Baumgardner et al., 2001; Johnson et al., 2012; Jones et al., 2012; Luebke et al., 2016; Voigt et al., 2017). The CASPOL relies on incident laser scattering by single particles. The ver-sion of CASPOL employed here has a linearly polarised laser to provide a collimated incident beam of light at a wave-length of 680 nm and a sample area of ∼ 0.225 mm2. The
collecting optics guide the light scattered in the 4 to 12◦
sub-tended cone into a forward-sizing photodetector. This light is measured and then used to infer a particle size from the cal-culated scattering cross section. As with most in situ cloud particle spectrometers, CASPOL is calibrated with standard spherical latex and glass spheres. Aspherical particles will therefore be mis-sized (Borrmann et al., 2000) to different degrees. For our experiments, we estimate the sizing error should normally be of the order of the instrument’s size bin width (Table S2 in the Supplement).
The backscatter detector measures the scattered light cone subtended between angles 168 and 176◦. Additionally, this version of CASPOL was limited to measuring the polarised fraction of the backscattered light in the orthogonal plane for the first 292 particles s−1(Droplet Measurement
Technolo-gies Manual, 2011). The sampling air speed of the instru-ment used in the chamber was set to ∼ 4 m s−1. Whilst the highest particle arrival rate could be up to 500 s−1the aver-age rate was generally below 100 s−1 allowing single parti-cle depolarisation ratios to be calculated for all partiparti-cles in most cases. The single particle polarisation functionality po-tentially allows discrimination of aspherical particles in the 0.51–50 µm range. For spherical particles, typically droplets, the polarisation of the incident light will be preserved and the orthogonal polarisation in the backscatter will generate nearly zero signal. Depending on the asphericity of the par-ticles, there will be increased signal in the backscatter po-larised detector. An increase in size with decrease in polari-sation in CASPOL at temperatures below the frost point for example would suggest that ice is sublimating and becom-ing more spherical as has been observed in cirrus clouds (Jensen et al., 2010). The classification of droplets and ice in CASPOL data analysis is primarily based on applying a polarisation threshold, which needs to be determined from controlled laboratory experiments. A clustering technique is used to discriminate and assign unique particle properties (e.g. asphericity) during the laboratory experiment, primarily based on variations in the polarisation state of the scattered light similarly to the methodology described in Nichman et al. (2016).
3V-CPI
Another aircraft-mounted instrument used here was the CPI, which can image and count particles in the size range of 15–2500 µm, with the images having a nominal resolution of 2.3 µm. The version of the 3V-CPI (SPEC Inc.) used here was an upgraded version of the original CPI described by Lawson et al. (2001) with a particle image acquisition rate of 20 frames per second (fps). The 3V-CPI version used here was able to generate 400 fps. The CPI probe was integrated with a 2D-S optical array probe (Lawson et al., 2006c), which was used as the particle triggering system for the newer CPI imaging system. The particle detection system consists of two intersecting elliptical cross section continuous laser
beams (30 mW, 788 nm). For detection, a particle must scat-ter light from both beams. This in turn triggers the imaging laser (pulsed 80 W, 850 nm), which fires onto a CCD cam-era. CPI obtained information covers particle size (including area and volume) and ice habit classification (Lawson et al., 2006b; Um and McFarquhar, 2009; Lindqvist et al., 2012; O’Shea et al., 2016). Complementary size distributions and concentrations data are obtained by the 2D-S. The 3V-CPI is especially suitable for use in ice and mixed-phase clouds (Gayet et al., 2012; Stith et al., 2014). Each of the 2.3 µm resolved surface images captured by the CPI can be fitted to a circle function to determine the roundness of the parti-cle (Korolev and Isaac, 2003b). Temporal changes of round-ness can be used to calculate the mean non-round (aspheri-cal) concentration fraction. However, the roundness parame-ter for smallest detected particles of 10 µm optical diameparame-ter have the largest uncertainty as will be discussed in Sect. 3.2. The 3V-CPI was mounted on top of the chamber for verti-cal sampling of larger cloud particles to reduce sedimentation in the sampling lines. The outlet of the instrument was con-nected to vacuum line and sample air speed of ∼ 4 m s−1was maintained.
3 Results and discussion 3.1 Experimental description 3.1.1 Ice nucleation and regrowth
The air pressure and mean temperature profiles for a typ-ical expansion procedure in accordance with Schnaiter et al. (2016) are presented in Fig. 1a. The expansion starts first with a slow pressure decrease to create water-supersaturated conditions inside the chamber and to form a cloud of su-percooled droplets. The expansion rate is increased towards the end in order to achieve ice-supersaturated conditions in a short time period. The overall cooling rate during this ex-pansion was −4.9◦C min−1. The PPD-2K measured the size distribution during the experiment (Fig. 1b). The cloud pe-riod with supercooled droplets lasts only several tens of sec-onds and followed by a fast formation of ice. The depolarisa-tion signal measured by the SIMONE increases only after an increase in the forward scattering signal indicating the short droplet period was followed by transition to the ice phase (Fig. 1c). The expansion is then stopped at ∼ 1 min (Fig. 1a). Pruppacher and Klett (2010) have suggested a homogeneous ice nucleation rate of ∼ 30 × 107cm−3s−1 at −37◦C (the lowest temperature measured in the chamber at the end of the expansion, Fig. A2). The active fraction can then be esti-mated in Eq. (1):
A =1 − e−J ·V ·dt, (1)
where J is the homogeneous ice nucleation rate, V is the vol-ume of the droplet (5.24 × 10⁻¹⁰cm3 for a 10 µm droplet)
and dt is the time period of the highest supersaturation (∼ 20 s). Under these conditions, the active fraction is 0.96.
After the first step of the expansion, the initial temperature of the air volume is slowly restored by the heat flux from the warmer chamber walls, thus creating subsaturated con-ditions inside the chamber. This warming leads to the subli-mation of ice crystals and the observed changes in their mi-crophysical properties. A re-growth of the sublimating ice crystals is initiated at ∼ 11 min, when the pressure decreases from 111.3 to 101.8 kPa. The depolarisation signal increases once again during this step and reaches slightly higher levels (0.34) than in the first step (0.26), together with an increase in signal noise level due to the low number concentration. There is also a small increase in the forward scattering but this is much lower than in the first step of the expansion due to ∼ 5-fold decrease in the concentration. In the first step, the lowest temperature of ∼ −37◦C is maintained for
sev-eral tens of seconds and governs the rate of ice nucleation in the turbulent chamber volume. Hence, we assume that ice crystals only remain after the first step and no liquid cloud activation or ice nucleation occurs during the regrowth pe-riod (Fig. 1c).
3.1.2 Size range overlap
In this comparison, the overlapping size range of PPD-2K and CASPOL for measurements of small ice particles is 7– 50 µm (Fig. 1b). However, a caveat here is that only 41 % of the particle-by-particle (PBP) polarisation data measured by CASPOL, at −30◦C, were from particles larger than 7 µm.
At lower temperatures the particle size distribution (PSD) is shifted towards the grey area in Fig. 2, below the PPD-2K size cut-off. The fraction of CASPOL PBP polarisation data points due to particles > 7 µm at lower temperatures was even lower: 24 % (−40◦C) and 32 % (−50◦C). Thus, most of the particles in the cloud that produce the polarisation data in the CASPOL and the bulk SIMONE depolarisation data are small, < 7 µm, while in the PPD-2K data 100 % of the analysed particles are > 7 µm.
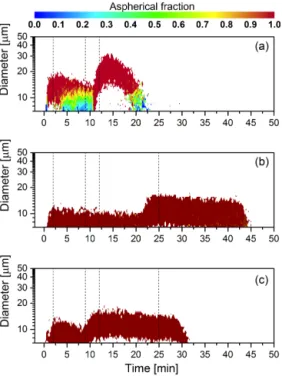
The size-segregated aspherical fractions as measured by the PPD-2K in the overlapping size region for the two in-struments are presented in Fig. 3. At −30◦C, the large ice particles reach 20 µm in diameter during the first step of the expansion and grow up to 35 µm during the second step, within the detection range of CASPOL. Ice particles formed under different temperature regimes would have a different morphology. At cirrus temperatures below −40◦C, the ice
particles form directly from the vapour phase via deposition nucleation (Fig. 3b, c), a different formation pathway com-pared to ice formation through the liquid phase at −30◦C (Fig. 3a). In the final step of the expansion at −30◦C, during the sublimation period, the aspherical fraction is extremely low, likely due to sphericity ambiguity as will be discussed in Sect. 3.3. For better statistical characterisation, we subse-quently examined this process under longer cloud life times
Figure 2. Selected 1 min averaged particle size distributions (dN/dlogDp)for experimental runs: 1292.01 (−30◦C), 1276.05
(−40◦C) and 1298.12 (−50◦C). White area represents the over-lap in the size range of PPD-2K and CASPOL. Concentration error bars are shown for the PPD-2K instrument. Grey area represents the size range where most of the particles detected by CASPOL occupy the 292 PBP polarisation bins in a second. This area is mostly below the PPD-2K size cut-off. The aspherical fraction for comparison in Fig. 7 was derived from data within the white area.
(up to 45 min) at lower temperatures. However, the measure-ments of PPD-2K at these temperatures were somewhat in-complete, missing the smaller particle sizes and hence the initial steps of cloud particle formation and growth, espe-cially during the first step of the expansion (Fig. 3b, c). The temperature and RH profiles of runs, 1276.05 (−40◦C) and 1298.12 (−50◦C), are shown in Fig. A1.
3.1.3 Column fraction
The ice fraction contains multiple ice habits such as plates and columns in all the regrowth experiments discussed here (Table 1). The largest fraction detected by PPD-2K at cirrus temperatures of −40 and −50◦C was typically composed of ice columns as shown in Fig. 4. In the first part of ex-periment 1292.01 (−30◦C) the frozen droplets are grown at lower temperature and higher supersaturation than in the second sublimation period of this experiment (Fig. 1a), lead-ing to a formation of more complex particles (Fig. 5). In the regrowth period, the temperature drop and supersatura-tion condisupersatura-tions are more moderate and we observe the for-mation of columnar ice particles. The columnar shape, how-ever, is not preserved and the ice particles sublimate, revert-ing to their underlyrevert-ing spherical core as seen in Fig. 3a. The largest column fractions were measured at the lowest tem-perature, −50◦C (Fig. 4c). In Fig. 5, we collected several typical diffraction patterns from different stages of each of the expansions, marked by vertical dashed lines in Figs. 3 and 4. The contrast in all the patterns was altered to the same
Figure 3. Size-segregated aspherical fraction measured by the PPD-2K (see Sect. 2.3.1). (a) Run no. 1292.01 (−30◦C); (b) run no. 1276.05 (−40◦C); (c) run no. 1298.12 (−50◦C). Vertical dashed lines indicate the time of patterns in Fig. 5.
extent to emphasise the presence of speckles in this images. Schnaiter et al. (2016) have linked such speckles to submi-cron surface features and roughness, i.e. complexity. A par-ticle’s surface complexity or non-uniformity will manifest it-self as a contributing speckled pattern within the expected idealised diffraction pattern (Järvinen et al., 2016c). Patterns with 2- or 4-fold symmetry are normally identified as colum-nar habits, whilst patterns with 6-fold symmetry are ated with plate habits. Concentric ring patterns are associ-ated with droplets or quasi-spherical ice. For example, in run 1292.01 we observed the transformation of complex ice to spherical ice to columnar ice (Fig. 5).
The resolution of instrumentation employed in atmo-spheric measurements, commonly, is not sensitive enough to image the surface microstructural features of the ice crystals. The resolution of the widely used CPI probe is around 2 µm, i.e. in the same range as the smallest droplets that are frozen into ice crystals and significantly larger than the size of the ice crystals’ surface anomalies. Although these anomalies, like roughness and stepped hollowness of the crystal, do not significantly contribute to the mass distribution, they can sig-nificantly alter the light scattering properties of the ice crys-tals, as discussed in Sect. 1.
3.2 3V-CPI image analysis of ice particles
Substantial concentrations of particles were observed to grow above 20 µm in diameter (Fig. 1b), thus allowing their
detec-Figure 4. Size-segregated fraction of columns (on log scale), mea-sured by the PPD-2K for (a) run no. 1292.01 (−30◦C), (b) run no. 1276.05 (−40◦C) and (c) run no. 1298.12 (−50◦C). Vertical dashed lines indicate the time of patterns in Fig. 5.
tion with the 3V-CPI. Quasi-spherical, or quasi-spheroidal, small particles were identified from the CPI images (Fig. 6). The CPI imager is triggered by the 2D-S component for par-ticles larger or equal to 10 µm as described in Sect. 2.3.3. Im-age analysis can then provide the roundness of the particles. Due to the larger error in estimating particle roundness at very small sizes, Korolev and Isaac (2003b) have considered the roundness only of those particles with diameter ≥ 20 µm. Different approaches are used in assessing such thresholds; e.g. Connolly et al. (2007) have included the roundness of smaller particles, ≥ 10 µm in diameter, in their analysis using size and shape corrections based on tests with ice analogues to the instrument’s depth of field. Emersic et al. (2015) chose a roundness threshold of 0.9 for phase discrimination of par-ticles larger than 35 µm. The exact definition and calculations of roundness are described in detail in the papers above. In this analysis we consider particles in the range 20–50 µm for broader coverage of the CASPOL and PPD-2K overlapping size ranges while constraining the uncertainty in the round-ness parameter. Here, the threshold for phase discrimination by roundness was set to 0.9.
Analysis of a large dataset of CPI images by Korolev et al. (2003) showed that in glaciated clouds a large fraction of particles with diameter < 60 µm do indeed have a quasi-spherical compact shape. Korolev and Isaac (2003b) noted that the question of spherical ambiguity remains due to opti-cal limitations of the instruments. Despite the limitations of
Figure 5. PPD-2K scattering patterns at different stages of the expansion for run no. 1292.01 (−30◦C) panel row (a), run no. 1276.05 (−40◦C) panel row (b) and run no. 1298.12 (−50◦C) panel row (c). The time frames are indicated by dashed lines in Figs. 3 and 4. Spheroidal, columnar and other habits with and without submicron features were observed.
size range and resolution, Fig. 7a shows an increase in the non-round image fraction during the growth periods of the ice particles in our chamber experiments.
3.3 Aspherical fractions measured by PPD-2K, CASPOL and 3V-CPI
In airborne in situ cloud measurements, ice fractions are commonly derived from the optical asphericity of the parti-cles (Sect. 1). Here we compare PPD-2K and CASPOL sin-gle particle measurements to examine their ability to distin-guish between droplets and ice particles in different ice nu-cleation modes. Supercooled droplets may exist until evap-oration completes. In experiment no. 1292.01 (−30◦C), we calculate the evaporation time of 10 µm droplet at water sat-urated environment, assuming instantaneous warmup of gas and droplets, instantaneous drop of RH according to the sat-uration ratio at the warmer temperature and constant temper-ature and RH during evaporation. The upper threshold for complete diffusional evaporation in this case is of the order of 20 s (Eq. 13.18 in Hinds, 1982). We assume that a fraction of the droplets freeze within a short time frame, after their formation, while the rest evaporate or lost to the walls, con-cluding the duration of the pure liquid cloud in the order of tens of seconds (Fig. 7a). Several tens of seconds after freez-ing we measure a high ice (aspherical) fraction (∼ 100 %), as expected. The freezing onset is detected by the increase in the depolarisation signal from the SIMONE and proceeds
with an increase in 3V-CPI smoothed non-round fraction (Sect. 3.2) annotated by pink markers, both indicating the presence of non-spherical particles. In the sublimation pe-riod, at 4 min, we see the reversed transition in the aspherical fraction; we start to detect more spherical particles that are classified as liquid droplets according to the thresholds used to classify ice (Sect. 2.3; Nichman et al., 2016). The depolar-isation finally decreases (Fig. 7a), and particles are no longer detected by the 3V-CPI due to their decrease in size below the threshold. The size-segregated aspherical fraction measured by the PPD-2K for this experiment is shown in Fig. 3a.
During the sublimation period the aspherical fraction decreases, implying increasing sphericity of the particles (Fig. 7a). However, once full glaciation was observed, the liquid phase cannot subsequently exist at the ambient cham-ber temperature, below −30◦C. Therefore, the nearly spher-ical particles observed (4–10 min and from 19 min onwards) are spherical ice and not liquid water droplets. The forma-tion of optically spherical ice particles in chamber exper-iments was first shown by Järvinen et al. (2016c). In at-mospheric measurements, such an aspherical fraction would normally be converted into an ice fraction. In this cloud sim-ulation, at the end of the sublimation period, both PPD-2K and CASPOL misinterpret the total ice fraction as spherical-liquid by 60 %.
In experiments 1276.05 (−40◦C) and 1298.12 (−50◦C) (Fig. 7b, c), we observe a short increase in aspherical frac-tion measured by the 3V-CPI at −40◦C and insufficient data
Figure 6. Experimental run no. 1292.01. 3V-CPI images of frozen droplets immediately after ice phase transition. The shape analysis of these particles is presented in Fig. 7.
Figure 7. PPD-2K (green line) and CASPOL (blue line with stan-dard deviation error bars) aspherical fraction of a subgroup of par-ticles with diameters > 7 µm. The intercomparison complemented by SIMONE linear depolarisation ratio (dashed line), CASPOL as-pherical fraction for all diameters (red line) and 3V-CPI non-round (aspherical) fraction (magenta rectangles). (a) Run no. 1292.01 (−30◦C); (b) run no. 1276.05 (−40◦C); (c) run no. 1298.12 (−50◦C).
in this size range at −50◦C. Up to 40 % lower aspherical fraction is measured by the CASPOL at these temperatures. Polarisation data analysis therefore suggests that ice particles smaller than 7 µm are more spherical at lower temperatures (Fig. 7c red line) and they are more abundant (Sect. 3.1.2). Furthermore, the aspherical fraction for all particles detected
in the PBP mode in CASPOL at −50◦C follows the SI-MONE depolarisation time series while the aspherical frac-tion of CASPOL > 7 µm subgroup is higher and increases towards the end of the expansion (Fig. 7c). The size de-pendence of these two polarisation detection techniques is demonstrated in Sect. 3.4. However, analysis of the scatter-ing patterns detected by the PPD-2K resulted in a 100 % as-pherical fraction in both experiments with vapour-formed ice crystals (Fig. 5). Additional studies are required to confirm these trends.
Similar discrepancies in aspherical fraction measurements by PPD-2K and CASPOL have already been shown in Järvi-nen et al. (2016c) for ice particles formed via homogeneous nucleation and via deposition nucleation on mineral dust at −30◦C. The asphericity of the particles significantly dif-fers for ice formed through the liquid phase and ice formed through the vapour phase. These discrepancies (Fig. 7b, c) at lower temperatures can be partially explained by the de-crease in the number of particles measured in every second and therefore the increased standard deviation in the aspher-ical fraction calculation, i.e. 19 % for particles > 7 µm at −40◦C and 37 % for particles > 7 µm at −50◦C. However,
the smaller size of particles at −40 and −50◦C is the main
cause of reduced sensitivity of the polarisation measurements with respect to aspherical features.
3.4 Single particle polarisation and ensemble depolarisation ratios
This analysis aimed at improving our interpretation of the small ice particle polarisability and the comparison of differ-ent instrumdiffer-ents and their approaches to discriminate small liquid and ice phase cloud particles by properties of their scattered light. One such property is the linear depolarisa-tion ratio for parallel incident laser polarisadepolarisa-tion δ||, which
is defined as the perpendicularly polarised to parallel po-larised ratio of the backscattered light intensity (I⊥/ I||).
Figure 8. CASPOL polarisation and SIMONE depolarisation comparison for runs (a) no. 1292.01, (b) no. 1291.07, (c) no. 1291.12 and (d) no. 1298.20. For details, see Table 1. Marker size denotes number concentration; maximum concentration observed was 56 cm−3. Black reference line is the 1 : 1 ratio. Higher R2values are observed for clouds with higher concentrations of smaller particles.
This ratio is frequently used in remote sensing (e.g. Burton et al., 2012; Petzold et al., 2010). The linear polarisation ra-tio in CASPOL data analysis is defined as the fracra-tion of the perpendicularly polarised backscattered light from the total backscattered intensity (Dpol / Back) as previously reported (Glen and Brooks, 2013) and is used for ice fraction deriva-tion (Nichman et al., 2016). The particle detecderiva-tion method and the measured polarisation components are not the only dissimilarities in these instruments, however, as they also op-erate at different wavelengths, have slightly different collec-tion angles and have a difference of more than two orders of magnitude in their sample volumes, as described above.
The depolarisation ratio measured by the SIMONE and the polarisation ratio measured by the CASPOL were plot-ted against each other with 1 s temporal resolution for run no. 1292.01 (where high concentrations of particles domi-nated), no. 1291.12 (where low concentrations and large par-ticle diameters dominated), no. 1291.07 (where high con-centrations and small particle diameters dominated) and no. 1298.2 (where low concentrations and small particle diameters dominated) (Table 1). The results are shown in Figs. 8 and 9. The relative dimensions of the marker reflect the number concentration, with the highest at 56 cm−3. The CASPOL polarisation ratios presented here are based on 1 s averages for all particles larger than 3 µm. Small aerosol par-ticles (< 3 µm) were detected during background measure-ments, after CCN injection and before the expansion. These small particles, i.e. non-activated aerosols, were excluded from further analysis.
In correlation analysis, the lowest R2 values were found at low concentration experiments, where the detected polar-isation was higher than the depolarpolar-isation. This is partially due to large deviations that occurred at low concentration within the larger sample volume of the SIMONE instrument. These deviations are highly affected by occasional poor mix-ing conditions in the chamber after the expansion is com-pleted. We have observed a higher R2 value in cases with high concentration of cloud particles (R2∼0.35) (Figs. 8a, b, 9a, b) and significantly lower value (R2∼0.01) in cases with low concentrations and smaller sizes of cloud particles as might be expected based on the relative sample volumes. Analysis of run 1292.01 showed that the column fraction had no effect on the R2value in this run (Table S3).
3.5 Implications for atmospheric measurements The misclassification of quasi-spherical ice as liquid droplets can pose a problem with in situ atmospheric measurements and especially in mixed-phase clouds, particularly when at-tempting to determine ice phase transition and longevity. Ice fraction calculations using current measurement techniques can be significantly affected by the potential misinterpreta-tions highlighted by the results shown in these cloud cham-ber experiments. In the atmosphere, there are additional pos-sible crystal rounding mechanisms, e.g. equilibrium thermal roughening near 0◦C, a surface coating of solutions, kinetic roughening at high supersaturations and latent heat-induced melting of the surface during growth at high temperatures
Figure 9. CASPOL polarisation and SIMONE depolarisation comparison for runs (a) no. 1292.01, (b) no. 1291.07, (c) no. 1291.12 and (d) no. 1298.20. For details, see Table 1. Mean particle diameter is colour coded. Black reference line is the 1 : 1 ratio.
and supersaturation. In addition, frozen droplets retain their rounded appearance until sufficient growth occurs. There-fore, it is not possible to infer subsaturated conditions in the atmosphere merely by sampling rounded crystals (Nelson, 1998) and the measured ice fraction may be prone to signif-icant underestimation. In any case of small quasi-spherical particle detection at sub-zero temperatures in the atmosphere, we recommend to use multiple instruments for intercompar-ative analysis.
Aspherical fraction derived from CASPOL data can be compared to other instruments with greater confidence when the PSD is fully covered by the overlapped size and con-centration range of the instruments with sufficient number of particles for aspherical fraction derivation with low stan-dard deviation. However, artefacts such as shattering, com-pression and coincidence (Lance et al., 2012; Wendisch and Brenguier, 2013) that may occur in airborne measurement may also lead to a mis-estimation of the ice fraction. In this study, due to low concentrations, particle coincidence in the CASPOL sample volume is minimal. In cases where small particle arrival rates and concentrations do not exceed the values reported here, the findings of this study may be ap-plicable.
The comparison of remote sensing and PBP measurements is not a straightforward process (i.e. bulk vs. single parti-cle and single complexity vs. mixed-complexity ensembles of particles). Many single particle and ensemble measure-ments laboratory techniques in particular have proven diffi-cult to adopt when translated to real atmospheric environ-ments. These techniques often provide complementary data
rather than comparable data (Lynch, 2001) and research in this area continues (e.g. Ray and Anderson, 2015).
Recent efforts to classify clouds (e.g. Krämer et al., 2016; Luebke et al., 2016) by their microphysical properties do not account for particle morphology; the morphology of small ice formed in situ in cirrus clouds or cirrus of liquid origin in the first steps of homogeneous freezing may affect the scattering properties and hence the solar radiation budget. According to the findings in this paper, submicron features might be present, but undetectable using some instruments at lower temperatures or for small particle sizes (< 7 µm). These phenomena may increase scattering and thus intensify cooling. The lack of these features in liquid origin clouds in warmer subzero temperature may allow more efficient warm-ing. However, this needs to be further investigated.
4 Conclusions
We have presented an instrumental set-up for combined sin-gle cloud particle and ensemble measurements for assess-ment of the relative optical ice and liquid responses in each case. The results were used to examine the asphericity evolu-tion during adiabatic expansion, sublimaevolu-tion and regrowth as well as to assess the potential impact on phase discrimination by the different measurement techniques. We report observa-tions of supercooled and frozen droplets and small ice habits including spheroids in a series of CLOUD chamber experi-ments at −30, −40 and −50◦C.
Poor agreement was found between PPD-2K and CASPOL asphericity for small ice crystals in the experiments at −40 and −50◦C. However, in the frozen droplet
experi-ments these instruexperi-ments were in good agreement (Fig. 7a). We have shown that the small quasi-spherical ice particles produced in the sublimation process exhibit a similar optical behaviour to that of water droplets as measured by the PPD-2K using variance analysis, and in the CASPOL, using polar-isation analysis for high PSD overlap at −30◦C. The analy-sis of the PPD-2K scattering patterns for water droplets and sublimating ice shows the similarity of the spherical states and the difficulty in applying phase discrimination. There-fore, in liquid-origin cirrus observations of small spheroids (< 35 µm) in subsaturated conditions, none of the instru-ments can confidently distinguish ice from water. These re-sults indicate that small quasi-spherical ice misclassifica-tion might similarly concern numerous optical instruments, impactors and other probes not examined here. Järvinen et al. (2016c) proposed a hypothesis of surface frost layer de-velopment on the frozen droplets during the freezing and ini-tial growth periods. However, the contribution to, for exam-ple, the net polarisation signature by this very thin layer is too weak to be detected by the CASPOL and SIMONE if the particles retain their sphericity. At this stage, the phase of small spherical particles cannot be unambiguously defined with any of the instruments examined here. Nonetheless, there is evidence that scattering patterns may differ for quasi-spherical ice and water due to small deviations from spheric-ity as indicated by changes in a complexspheric-ity analysis metric (e.g. Schnaiter et al., 2016; Järvinen et al., 2016c; Voigt et al., 2017) and appearance of speckled patterns which could be used to solve the phase ambiguity. An increase in resolu-tion in future versions of these optical instruments might bet-ter amplify such difference and allow easier discrimination as well as revealing additional subtle morphological features and associated processes. However, in atmospheric measure-ments, small particle detection may be contaminated by shat-tering; therefore coincidence should be addressed before any comparison can be made.
We conclude that in these simulated atmospheric con-ditions the polarisation and depolarisation signatures from frozen droplets have higher R2 values at higher concentra-tions of small particles and can be comparable above cer-tain concentration and size thresholds. These findings and the derived instrumental differences may be used in the in-terpretation of atmospheric measurements of frozen droplets from field measurements using combined remote and in situ measurement approaches as well as a pathway for further re-search and development for improvements to these instru-ments.
Data availability. Datasets from all the collaboration instruments are stored on Lisbon servers, ordered by campaign serial num-bers, and can be accessed from the collaboration website: http:// cloud.sim.ul.pt/. Access requests should be directed to the CLOUD project administrator. Backups of the data measured by University of Manchester are stored on the departmental server of the School of Earth and Environmental Sciences in Database3.
Appendix A
Figure A1 presents the temperature profile of the comple-mentary adiabatic expansions at −40 and −50◦C. The re-sulting RH conditions are annotated on the right y axis.
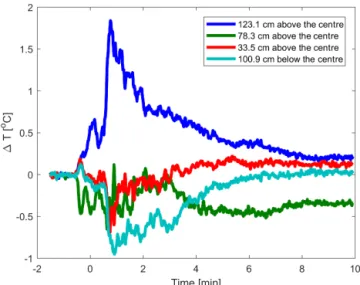
Figure A2 presents the residuals from the mean temper-ature in the vertical direction, relative to the centre of the chamber during the first expansion of run no. 1292.01. Most of the non-uniformities in temperature across the chamber occur at the very end of the expansion.
Figure A1. Temperature (T ◦C) profiles and RH, versus time for (a) run no. 1276.05 (−40◦C) and (b) run no. 1298.12 (−50◦C).
Figure A2. CLOUD chamber vertical temperature residuals relative to the centre of the chamber. First expansion of run no. 1292.01.
The Supplement related to this article is available online at https://doi.org/10.5194/amt-10-3231-2017-supplement.
Competing interests. The authors declare that they have no conflict of interest.
Acknowledgements. We would like to thank CERN for supporting CLOUD with important technical and financial resources. We express great appreciation for the CLOUD collaboration. This research has received funding from the EC Seventh Framework Programme (Marie Curie Initial Training Network “CLOUD-TRAIN” no. 316662). The SIMONE measurements were funded by the CERN CLOUD project. The PPD-2K instrument was fully funded by the Deutsche Forschungsgemeinschaft within project SCHN 1140/2-1. The CAPS and 3V-CPI instruments used in this work, and support staff were supplied by the UK National Centre for Atmospheric Science (NCAS).
Edited by: Pierre Herckes
Reviewed by: four anonymous referees
References
Abdelmonem, A., Järvinen, E., Duft, D., Hirst, E., Vogt, S., Leisner, T., and Schnaiter, M.: PHIPS–HALO: the airborne Particle Habit Imaging and Polar Scattering probe – Part 1: Design and operation, Atmos. Meas. Tech., 9, 3131–3144, https://doi.org/10.5194/amt-9-3131-2016, 2016.
Ackerman, A. S., Fridlind, A. M., Grandin, A., Dezitter, F., Weber, M., Strapp, J. W., and Korolev, A. V.: High ice water content at low radar reflectivity near deep convection – Part 2: Evaluation of microphysical pathways in updraft parcel simulations, Atmos. Chem. Phys., 15, 11729–11751, https://doi.org/10.5194/acp-15-11729-2015, 2015.
Baumgardner, D., Jonsson, H., Dawson, W., O’Connor, D., and Newton, R.: The cloud, aerosol and precipitation spectrometer: a new instrument for cloud investigations, Atmos. Res., 59, 251– 264, https://doi.org/10.1016/S0169-8095(01)00119-3, 2001. Baumgardner, D., Newton, R., Krämer, M., Meyer, J., Beyer,
A., Wendisch, M., and Vochezer, P.: The Cloud Particle Spectrometer with Polarization Detection (CPSPD): A next generation open-path cloud probe for distinguishing liquid cloud droplets from ice crystals, Atmos. Res., 142, 2–14, https://doi.org/10.1016/j.atmosres.2013.12.010, 2014.
Baumgardner, D., Abel, S. J., Axisa, D., Cotton, R., Crosier, J., Field, P., Gurganus, C., Heymsfield, A., Korolev, A., Krämer, M., Lawson, P., McFarquhar, G., Ulanowski, Z., and Um, J.: Cloud Ice Properties: In Situ Measurement Challenges, Meteorological Monographs, 58, 9.1–9.23, https://doi.org/10.1175/AMSMONOGRAPHS-D-16-0011.1, 2017.
Borrmann, S., Luo, B., and Mishchenko, M.: Application of the T-matrix method to the measurement of aspherical (ellip-soidal) particles with forward scattering optical particle
coun-ters, J. Aerosol Sci., 31, 789–799, https://doi.org/10.1016/S0021-8502(99)00563-7, 2000.
Buck: Buck Research CR-1A User’s Manual, Appendix 1, available at: http://www.hygrometers.com/wp-content/uploads/ CR-1A-users-manual-2009-12.pdf (1 May 2016), 1996. Burton, S. P., Ferrare, R. A., Hostetler, C. A., Hair, J. W., Rogers, R.
R., Obland, M. D., Butler, C. F., Cook, A. L., Harper, D. B., and Froyd, K. D.: Aerosol classification using airborne High Spectral Resolution Lidar measurements – methodology and examples, Atmos. Meas. Tech., 5, 73–98, https://doi.org/10.5194/amt-5-73-2012, 2012.
Byers, H. R. and Braham, R. R.: Thunderstorm structure and circulation, J. Meteor., 5, 71–86, https://doi.org/10.1175/1520-0469(1948)005<0071:TSAC>2.0.CO;2, 1948.
Cober, S. G., Isaac, G. A., Korolev, A. V., and Strapp, J. W.: Assessing Cloud-Phase Conditions, J. Appl. Me-teorol., 40, 1967–1983, https://doi.org/10.1175/1520-0450(2001)040<1967:ACPC>2.0.CO;2, 2001.
Connolly, P. J., Flynn, M. J., Ulanowski, Z., Choularton, T. W., Gallagher, M. W., and Bower, K. N.: Calibration of the Cloud Particle Imager Probes Using Calibration Beads and Ice Crys-tal Analogs: The Depth of Field, J. Atmos. Ocean. Technol., 24, 1860–1879, https://doi.org/10.1175/JTECH2096.1, 2007. Cotton, R., Osborne, S., Ulanowski, Z., Hirst, E., Kaye, P. H.,
and Greenaway, R. S.: The Ability of the Small Ice De-tector (SID-2) to Characterize Cloud Particle and Aerosol Morphologies Obtained during Flights of the FAAM BAe-146 Research Aircraft, J. Atmos. Ocean. Tech., 27, 290–303, https://doi.org/10.1175/2009JTECHA1282.1, 2010.
Dias, A., Ehrhart, S., Vogel, A., Williamson, C., Almeida, J., Kirkby, J., Mathot, S., Mumford, S., and Onnela, A.: Temper-ature uniformity in the CERN CLOUD chamber, Atmos. Meas. Tech. Discuss., https://doi.org/10.5194/amt-2017-114, in review, 2017.
Droplet Measurement Technologies Manual: CAPS operator man-ual, DOC-0066 Revision F, DMT, Boulder, Colorado, USA, 2011.
Duplissy, J., Merikanto, J., Franchin, A., Tsagkogeorgas, G., Kan-gasluoma, J., Wimmer, D., Vuollekoski, H., Schobesberger, S., Lehtipalo, K., Flagan, R., Brus, D., Donahue, N., Vehkämäki, H., Almeida, J., Amorim, A., Barmet, P., Bianchi, F., Breitenlechner, M., Dunne, E., Guida, R., Henschel, H., Junninen, H., Kirkby, J., Kürten, A., Kupc, A., Määttänen, A., Makhmutov, V., Mathot, S., Nieminen, T., Onnela, A., Praplan, A., Riccobono, F., Rondo, L., Steiner, G., Tome, A., Walther, H., Baltensperger, U., Carslaw, K., Dommen, J., Hansel, A., Petäjä, T., Sipilä,M., Stratmann, F., Vrtala, A., Wagner, P., Worsnop, D., Curtius, J., and Kulmala, M.: Effect of ions on sulfuric acid-water binary particle forma-tion II: Experimental data and comparison with QC-normalized classical nucleation theory, J. Geophys. Res.-Atmos., 121, 1752– 1775, https://doi.org/10.1002/2015JD023539, 2016.
Elliott, J. W. and Smith, F. T.: Ice formation on a smooth or rough cold surface due to the impact of a supercooled water droplet, J. Eng. Math., 102, 35–64, https://doi.org/10.1007/s10665-015-9784-z, 2015.
Emersic, C., Connolly, P. J., Boult, S., Campana, M., and Li, Z.: Investigating the discrepancy between wet-suspension-and dry-dispersion-derived ice nucleation efficiency of
mineral particles, Atmos. Chem. Phys., 15, 11311–11326, https://doi.org/10.5194/acp-15-11311-2015, 2015.
Gallagher, M. W., Baumgardner, D., Lloyd, G., Beswick, K., Freer, M., and Durant, A.: Detection and Analysis of High Ice Concen-tration Events and Supercooled Drizzle from IAGOS Commer-cial Aircraft, Geophys. Res. Abstr., EGU2016-2924, EGU Gen-eral Assembly 2016, Vienna, Austria, 2016.
Garrett, T. J., Navarro, B. C., Twohy, C. H., Jensen, E. J., Baum-gardner, D. G., Bui, P. T., Gerber, H., Herman, R. L., Heymsfield, A. J., Lawson, P., Minnis, P., Nguyen, L., Poellot, M., Pope, S. K., Valero, F. P. J., and Weinstock, E. M.: Evolution of a Florida Cirrus Anvil, J. Atmos. Sci., 62, 2352–2372, 2005.
Gayet, J.-F., Mioche, G., Shcherbakov, V., Gourbeyre, C., Busen, R., and Minikin, A.: Optical properties of pristine ice crystals in mid-latitude cirrus clouds: a case study during CIRCLE-2 experiment, Atmos. Chem. Phys., 11, 2537–2544, https://doi.org/10.5194/acp-11-2537-2011, 2011.
Gayet, J.-F., Mioche, G., Bugliaro, L., Protat, A., Minikin, A., Wirth, M., Dörnbrack, A., Shcherbakov, V., Mayer, B., Garnier, A., and Gourbeyre, C.: On the observation of unusual high con-centration of small chain-like aggregate ice crystals and large ice water contents near the top of a deep convective cloud during the CIRCLE-2 experiment, Atmos. Chem. Phys., 12, 727–744, https://doi.org/10.5194/acp-12-727-2012, 2012.
Glen, A. and Brooks, S. D.: A new method for measur-ing optical scattermeasur-ing properties of atmospherically relevant dusts using the Cloud and Aerosol Spectrometer with Po-larization (CASPOL), Atmos. Chem. Phys., 13, 1345–1356, https://doi.org/10.5194/acp-13-1345-2013, 2013.
Guida, R., Carrie, P., De Menezes, L., Duplissy, J., Fayet, F., Kirkby, J., Mathot, S., Minginette, P., Onnela, A., Rochez, J., Thomas, G., Wasem, A., and Wilhelmsson, M.: An ultra-pure gas system for the CLOUD experiment at CERN, in: 2012 IEEE Nuclear Sci-ence Symposium and Medical Imaging ConferSci-ence (NSS/MIC), 27 October–3 November 2012, Anaheim, CA, 1199–1203, 2012. Guida, R., Carrie, P., De Menezes, L., Duplissy, J., Fayet, F., Haider, S., Kirkby, J., Mathot, S., Minginette, P., Onnela, A., Rochez, J., Thomas, G., Wasem, A., and Wilhelmsson, M.: Development of the gas system for the CLOUD experiment at CERN, in: Nuclear Science Symposium and Medical Imaging Conference (NSS/MIC), 2013 IEEE, Seoul 27 October–2 November 2013, 1–5, 2013.
Heymsfield, A. J., Miloshevich, L. M., Schmitt, C., Bansemer, A., Twohy, C., Poellot, M. R., Fridlind, A., and Gerber, H.: Homo-geneous Ice Nucleation in Subtropical and Tropical Convection and Its Influence on Cirrus Anvil Microphysics, J. Atmos. Sci., 62, 41–64, https://doi.org/10.1175/JAS-3360.1, 2005.
Hinds, W. C.: Aerosol Technology John Wiley and Sons, New York, 424, 1982.
Hirst, E., Kaye, P. H., Greenaway, R. S., Field, P., and Johnson, D. W.: Discrimination of micrometre-sized ice and super-cooled droplets in mixed-phase cloud, Atmos. Environ., 35, 33–47, https://doi.org/10.1016/S1352-2310(00)00377-0, 2001. Irvine, E. A. and Shine, K. P.: Ice supersaturation and the potential
for contrail formation in a changing climate, Earth Syst. Dynam., 6, 555–568, https://doi.org/10.5194/esd-6-555-2015, 2015. Järvinen, E., Ignatius, K., Nichman, L., Kristensen, T. B., Fuchs,
C., Hoyle, C. R., Höppel, N., Corbin, J. C., Craven, J., Du-plissy, J., Ehrhart, S., El Haddad, I., Frege, C., Gordon, H.,
Joki-nen, T., Kallinger, P., Kirkby, J., Kiselev, A., Naumann, K.-H., Petäjä, T., Pinterich, T., Prevot, A. S. H., Saathoff, H., Schiebel, T., Sengupta, K., Simon, M., Slowik, J. G., Tröstl, J., Virta-nen, A., Vochezer, P., Vogt, S., Wagner, A. C., Wagner, R., Williamson, C., Winkler, P. M., Yan, C., Baltensperger, U., Don-ahue, N. M., Flagan, R. C., Gallagher, M., Hansel, A., Kulmala, M., Stratmann, F., Worsnop, D. R., Möhler, O., Leisner, T., and Schnaiter, M.: Observation of viscosity transition in a-pinene secondary organic aerosol, Atmos. Chem. Phys., 16, 4423–4438, https://doi.org/10.5194/acp-16-4423-2016, 2016a.
Järvinen, E., Kemppinen, O., Nousiainen, T., Kociok, T., Möh-ler, O., Leisner, T., and Schnaiter, M.: Laboratory in-vestigations of mineral dust near-backscattering depolar-ization ratios, J. Quant. Spectrosc. Ra., 178, 192–208, https://doi.org/10.1016/j.jqsrt.2016.02.003, 2016b.
Järvinen, E., Schnaiter, M., Mioche, G., Jourdan, O., Shcherbakov, V. N., Costa, A., Afchine, A., Krämer, M., Heidelberg, F., Jurkat, T., Voigt, C., Schlager, H., Nichman, L., Gallagher, M., Hirst, E., Schmitt, C., Bansemer, A., Heymsfield, A., Lawson, P., Tri-coli, U., Pfeilsticker, K., Vochezer, P., Möhler, O., and Leisner, T.: Quasi-Spherical Ice in Convective Clouds, J. Atmos. Sci., 73, 3885–3910, https://doi.org/10.1175/JAS-D-15-0365.1, 2016c. Jeanne, M., Walter, S., and Philip, C.: The Ice Particle Threat to
Engines in Flight, in: 44th AIAA Aerospace Sciences Meeting and Exhibit, Aerospace Sciences Meetings, American Institute of Aeronautics and Astronautics, 2006.
Jensen, E. J., Lawson, P., Baker, B., Pilson, B., Mo, Q., Heyms-field, A. J., Bansemer, A., Bui, T. P., McGill, M., Hlavka, D., Heymsfield, G., Platnick, S., Arnold, G. T., and Tanelli, S.: On the importance of small ice crystals in tropical anvil cirrus, At-mos. Chem. Phys., 9, 5519–5537, https://doi.org/10.5194/acp-9-5519-2009, 2009.
Jensen, E. J., Pfister, L., Bui, T.-P., Lawson, P., and Baumgardner, D.: Ice nucleation and cloud microphysical properties in tropi-cal tropopause layer cirrus, Atmos. Chem. Phys., 10, 1369–1384, https://doi.org/10.5194/acp-10-1369-2010, 2010.
Jensen, E. J., Diskin, G., Lawson, R. P., Lance, S., Bui, T. P., Hlavka, D., McGill, M., Pfister, L., Toon, O. B., and Gao, R.: Ice nucleation and dehydration in the Tropical Tropopause Layer, P. Natl. Acad. Sci. USA, 110, 2041–2046, https://doi.org/10.1073/pnas.1217104110, 2013.
Johnson, A., Lasher-Trapp, S., Bansemer, A., Ulanowski, Z., and Heymsfield, A. J.: Difficulties in Early Ice Detec-tion with the Small Ice Detector-2 HIAPER (SID-2H) in Maritime Cumuli, J. Atmos. Ocean. Tech., 31, 1263-1275, https://doi.org/10.1175/JTECH-D-13-00079.1, 2014.
Johnson, B., Turnbull, K., Brown, P., Burgess, R., Dorsey, J., Baran, A. J., Webster, H., Haywood, J., Cotton, R., Ulanowski, Z., Hesse, E., Woolley, A., and Rosenberg, P.: In situ observations of volcanic ash clouds from the FAAM aircraft during the erup-tion of Eyjafjallajökull in 2010, J. Geophys. Res.-Atmos., 117, D00U24, https://doi.org/10.1029/2011JD016760, 2012. Jones, H. M., Haywood, J., Marenco, F., O’Sullivan, D., Meyer,
J., Thorpe, R., Gallagher, M. W., Krämer, M., Bower, K. N., Rädel, G., Rap, A., Woolley, A., Forster, P., and Coe, H.: A methodology for in-situ and remote sensing of microphysical and radiative properties of contrails as they evolve into cirrus, At-mos. Chem. Phys., 12, 8157–8175, https://doi.org/10.5194/acp-12-8157-2012, 2012.