HAL Id: hal-00326646
https://hal.archives-ouvertes.fr/hal-00326646
Submitted on 4 Oct 2008
HAL is a multi-disciplinary open access
archive for the deposit and dissemination of
sci-entific research documents, whether they are
pub-lished or not. The documents may come from
teaching and research institutions in France or
abroad, or from public or private research centers.
L’archive ouverte pluridisciplinaire HAL, est
destinée au dépôt et à la diffusion de documents
scientifiques de niveau recherche, publiés ou non,
émanant des établissements d’enseignement et de
recherche français ou étrangers, des laboratoires
publics ou privés.
Software Tools Dedicated for an Automatic Analysis of
the CT Scanner Quality Control’s Images
Tarraf Torfeh, Stéphane Beaumont, Jeanpierre Guédon, Nicolas Normand,
Eloïse Denis
To cite this version:
Tarraf Torfeh, Stéphane Beaumont, Jeanpierre Guédon, Nicolas Normand, Eloïse Denis. Software
Tools Dedicated for an Automatic Analysis of the CT Scanner Quality Control’s Images. 2007,
�10.1117/12.707343�. �hal-00326646�
Software Tools Dedicated for an Automatic Analysis of the CT
Scanner Quality Control’s Images
Tarraf Torfeh
a, Stéphane Beaumont
b, JeanPierre Guédon
a, Nicolas Normand
a, Eloïse Denis
a aIRCCyN/IVC – UMR CNRS 6597,
1Image & Video Communication, École polytechnique de
l’Université de Nantes, La Chantrerie, BP 50609, 44306 Nantes Cedex 3 – France
bQualiFormeD SARL, Centre Hospitalier Départemental, 85925 La Roche Sur Yon, France
ABSTRACT
This paper deals with the CT scanner images quality control, which is an important part of the quality control process of the CT scanner, which consists of making measurement in images of dedicated phantoms.
Standard methods consist of scan explorations of phantoms that contain different specific patterns1, 2. These methods rely on manual measurements with graphics tools in corresponding images (density, position, length…) or automatic measurements developed in softwares3, 4 that use some masks to determine the region of interest (ROI). The problem of these masks is that they may produce wrong results in case of misalignment of the phantom.
We propose a new method that consists, firstly of developing software tools that are capable of performing an automated analysis of CT images of three standard phantoms, LAP5 , GEMS6 and CATPHAN6007, in terms of slice thickness, spatial resolution, low and high level contrast, noise and uniformity. The method we have developed is completely automatic because it uses some protocols and special treatments in the images to automatically detect the position and the size of the ROI. Secondly, to test the performances of our software tools, we develop two digital phantoms which reproduce the exact geometry and composition of the physical phantoms, i.e. some perfect CT images of the real phantoms, and a complete set of distorted digital phantoms which represent the “perfect” phantom distorted by noise and blur calibrated functions to test the performances of our automated analysis software.
Keywords: ALG, CT, METR.
1. INTRODUCTION
The main goal of a medical imaging system is to produce images in order to provide more accurate timely and cost effective diagnosis. Producing an image involve many electronic components and massive amounts of data processing, which affects the quality of images being produced and makes the purpose of these images harder to achieve. Thus, image quality control is crucial to ensure a safe and efficient diagnosis and treatment of diseases.
Standard methods consist of scan explorations of phantoms that contain different specific patterns1, 2. These methods rely on manual measurements with graphics tools in corresponding images (density, position, length…) or automatic measurements developed in softwares3, 4 that use some masks to determine the region of interest (ROI) for quantization In this article we concentrate on the physical aspect of CT image quality, and we describe a software that is capable of performing an automatic CT image quality control in order to make faster more precise, objective and complete, the process of CT image quality control.
2. MATERIALS AND METHODS
2.1 The phantoms or Physical Tests-Objects (PTO)
Physical Test-Objects are used for the purposes of calibration and evaluation of the performance of CT scanners. The software we have developed performs an automated analysis of images of three phantoms, LAP5, GEMS6 and
a
CATPHAN6006 used for the quality control of the CT scanner. These objects contain specific metallic or plastic patterns included in a soft tissue equivalent envelop, in order to obtain images that offer the possibility of controlling different parameters.
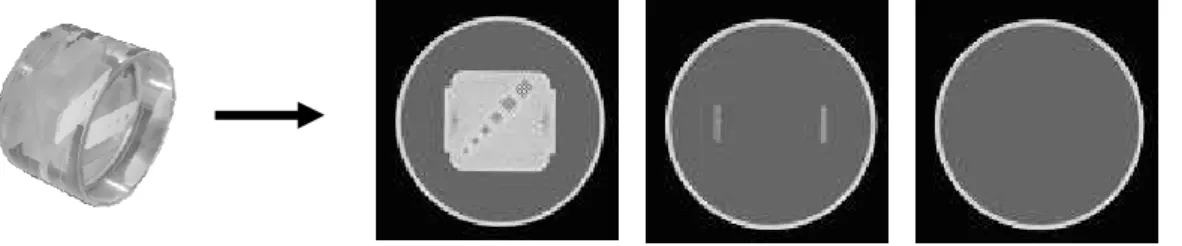
The LAP5 phantom allow to compare the reference point of the laser skin marking system with the reference of the CT scanner when it is used for radiation therapy applications. It contains a 3cm thick plaque of acrylic, with several slots on each of its sides: 1 longitudinal transverse slot, 1 anterior slot and 2 lateral frontal slots (Cf. figure 7). Frontal and lateral Laser misalignments are then calculated based on the positions of these slots in the corresponding images. Each slot is 3 mm wide. The slice thickness for the CT examination of the phantom is 1mm or less and the slice distance is 1 mm. Theses distances are chosen to facilitate the analyse. In theory, we obtain two types of images as we can see in figure 1, one with slots and the other one without slot because the slice is in the transverse slot. By observing the number of images of each type we can calculate the misalignment in Z direction, i.e. in feet to head direction.
Figure 1. Two images issued from LAP phantom, the first one outside of the transverse slot and the second inside of the slot.
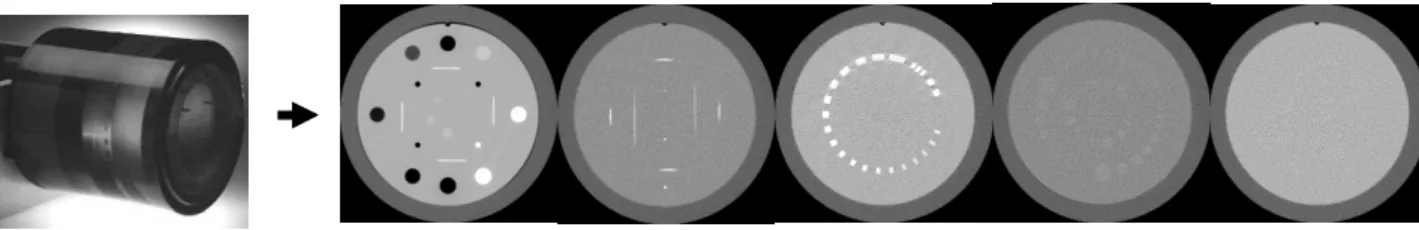
The phantom GEMS6 is used to make a daily control of the CT scanner image quality. It has three main sections as shown in figure 2. The first is composed from a 2cm thick plaque of acrylic fixed inside of a water cylinder of 15cm diameter. This plaque contains different slots organized in 6 pattern groups, characterized by the wide of slots and gaps in between. The second section is composed from a polyester thin (1mm) plate with 5 circular holes with different diameters, while the third part is a uniform zone filled with water.
Figure 2. Three images issued from GEMS phantom, the first (left) to control slice thickness, alignment, spatial resolution; the second (center) to control the contrast and the third (right) to control geometric distortions, noise and uniformity.
The phantom CATPHAN6007 is designed to allow the assessment of different image quality parameters in a more detailed and precise way than the GEMS phantom for example. The phantom is used during the acceptance of the CT and the monthly controls. It is composed from five sections (Figure 3):
• CTP404 is composed from three parts. The internal part, designed to test the practical volume artefact phenomena with five acrylic spheres of different diameters. The second part of the CTP404 section used to estimate the slice thickness and misalignment errors, contains two pairs of 23° wire ramps, and four high contrast holes of 3mm diameter positioned 50mm apart the center which are used to check the spatial linearity and the pixel size. The external part contains seven high contrast sensitometric targets. This section is also used to control geometric distortions.
• The section CTP591 is also used to control the slice thickness. It contains 3 pairs of opposed beads ramps, two with 27° angle and 0.28mm diameter beads spaced 1mm in the z direction (feet to head) and one with 7° and 0.18mm diameter beads spaced 0.25mm in the z axis. The width is 40mm in the z axis direction for the 27° ramps and 6mm for the 7° ramp.
• The CTP528 section is used to build the practical Modulation Transfer Function (denoted pMTF). It contains 21 aluminium patterns of 2mm thickness and casted into epoxy. It reproduces 21 spatial frequencies between 1 line pair/cm to 21 line pair/cm.
• The CTP515 section used to evaluate the low contrast resolution. It contains supra-slice and sub-slice contrast targets with different diameters and length in the z direction.
• The last section is the CTP486. It is used to evaluate image noise and uniformity and it is cast from uniform material.
Figure 3. Sections from left to right, CTP404, CTP591, CTP528, CTP515, CTP486.
2.2 Digital Tests-Object (DTO)
In order to facilitate the quality control development process of our different algorithms and to test their limits, digital phantoms were being generated. These phantoms must be as much realistic as possible. Images from these phantoms as well as the factors that affect the quality control algorithms, such as phantom misalignment pixel size, slice thickness, noise and blur are being simulated. These images are constructed in pixels. By varying each of the factors mentioned above, the robustness of the algorithms and the effect of each factor can be evaluated.
Three types of DTO have being generated, which correspond to the physical phantoms used.
2.2.1 LAP
The first DTO is dedicated to simulate the LAP phantom (figure 4). Dimensions of the DTO (phantom and slot sizes) and the acquisition mode (slice thickness, number of images, image size and ScanFOV) are defined by the end user. The main goal of this DTO is to assess the accuracy of the algorithms used to calculate laser positioning; laser misalignment is also being simulated: The user can characterized the desired misalignment with respect to the x, y and z axis.
Figure 4. Two images from of 512² pixels size representing the DTO LAP, with 200mm as phantom size, 1mm slice thickness, 300mm SFOV, 0.5mm, 3mm and 4mm misalignments with respect to z, y and x axis. The first image (left) is located outside the slot, and the second one is located half inside and half outside the slot.
2.2.2 GEMS
The second DTO is dedicated to simulate the GEMS phantom (Figure 5). The noise and blur are being introduced with this type of DTO.
Figure 5. Image of the DTO GEMS with SD (noise) = 2 and FWHM (blur) = 4 pixels.
These images are 512² pixels size. The white circular border is centred at the image’s center; it is 12 pixels wide with a radius of 223 pixels. Pixels inside this area have a value of 120.
The first image is composed from a rectangular area of 260x280 pixels with a grey value of 120. On the left and the right of this area there are three horizontal dark lines with 2 pixels height, separated by two pixels each one from the other. The line in the middle is 15 pixels long and the others are 10 pixels long. The six groups of patterns are each made from five inclined dark lines separated by four bright lines. These lines are respectively from top to bottom, 5 pixels, 4,3,2,1 and 1 pixel wide.
The second image is composed from a rectangular area of 235x78 pixels size; pixels inside this area have a value of 8. Five circular shapes are lying inside this area with diameters equal to 20, 16, 12, 8 and 6 pixels with a pixels value equal to zero.
The third image is a uniform image repeats the characteristics of the previous image but with a uniform background zero grey value that simulates water.
Knowing the characteristics of each digital phantom, and the exact amount of noise and blur that will be introduced, we apply our algorithms to retrieve the computed parameters. The entered parameters are then compared with the estimated ones in order to assess the accuracy of the algorithms
Noise is simulated with a function that generates a white Gaussian distributionas described in Eq. (1). The standard deviation of the probability distribution function is given by the user. As described in [8], the procedure of generating white noise follows these steps; for each pixel in the image: add 12 random numbers, subtract 6 to make the mean equal to 0 and finally multiply by the standard deviation. The number generated is then added to the pixel value.
∑
= − ⋅ + = 12 1 6 ) ( ) ( ) ( k k RND SD i Init I i Noise I , (1)where INoise(i) is the noised intensity grey value and IInit(i) is the initial grey value. SD is the desired standard deviation
and RND is a random number (of constant distribution) between 0 and 1.
The blur is simulated by convolving the DTO with a two-dimensional Gaussian function, a Point Spread Function (denoted PSF). The Full Width at Half Maximum (denoted FWHM) of the PSF is given in pixels by the user. The two-dimensional function is written according to the formula:
2 FWHM 2 2 1 N j 2 2 1 N i . ) 2 ( Ln . 4 e 2 FWHM ) 2 ( Ln . 4 ) j , i ( PSF
− − + − − − ⋅ × = π , (2)where i and j are the pixel position and N x N is the size of the PSF in number of pixel (N = 4 . FWHM + 1).
1 5 9 1 3 1 7 2 1 2 5 2 9 3 3 0,000 0,002 0,004 0,006 0,008 0,010 0,012 0,014
Figure 6. Two-dimensional Gaussian function with FWHM = 8 pixels.
The comparison of the Fourier transform of the PSF with the pMTF allows for assessing the accuracy of the algorithms.
2.2.3 CATPHAN
Images representing the sections of the CATPHAN600 phantom are also being simulated but algorithms used to control the correspondent parameters are not yet being implemented within this DTO.
4.FWHM+1 4.FWHM+1
2.3 Measurements of test parameters 2.3.1 Laser positioning test (LAP)
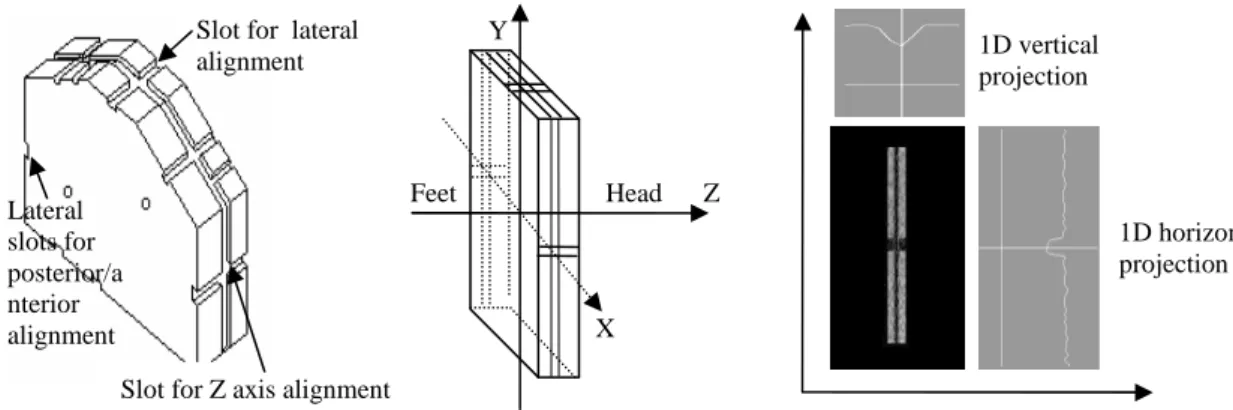
The set of LAP images forms a 3D model of the phantom (figure7). The position of each slot in the 3D model is an indication of the phantom alignment. To calculate these positions, the 3D model is projected with respect to the directions (+x, –x and y). Each of the three resultant projections is a 2D matrix with a cross representing the slot’s position. The 1D projection of each 2D matrix in the vertical and horizontal directions has a shape represented in figure 7 and their centers indicate the position of the correspondent slot. Thereby, calculating the positions of these centers, i.e. center of the full width at half maximum of the 1D profile, allows finding the phantom misalignment.
Figure 7. An outline representing the process of calculating LAP phantom misalignment.
2.3.2 Image quality control
Image analysis and quantization are done by calculating the mean (M) and the standard deviation (SD) of the CT values within different region of interest (denoted ROI), or by calculating distances in pixels between two points. Shapes of the ROI differ with respect to phantom’s characteristics. Their initial reference positions and sizes can be adjusted by the user. These ROIs form masks within each image and measurements are acquired with respect to each test. Before any measurements are done, image registration is used to detect the phantom’s position. This avoids erroneous measurements in case of phantom misalignment. The phantom’s correct position is found by automatically detecting distinctive features within each image, these features should be distinct and efficiently detectable. The first step of image registration consists of detecting phantoms translation with respect to x and y axes. In many situations, this is done by detecting the circular border of the phantom. If this border is not visible, other features with specific homogenous repartition inside the image are detected. Borders or features are detected by projecting all images or a ROI inside the image with respect to vertical and horizontal directions. The centers of the projections are treated with specific thresholds which allows to find translations with respect to the horizontal (left/right) and vertical direction (up/down) simultaneously. The second step of the registration process of the mask consists of detecting a specific object with a known location in the image. Knowing the angle formed between the center of the phantom and the center of this object, rotation misalignment of the phantom with respect to z axis is then calculated.
2.3.2.1 GEMS phantom tests
Figure 8 shows the first type of images issued from GEMS phantom as well as the one-dimensional vertical projection after a threshold equal to 100 times the maximum intensity pixel in the image. The position and the width of the rectangular shape inside this projection allow to find the real center of the phantom and the size of the rectangular plate inside it. The same calculation is done in the other direction.
Figure 8. On the left, image issued from GEMS phantom and its vertical projection on the right. Feet Head Lateral slots for posterior/a nterior alignment
Slot for lateral alignment
Slot for Z axis alignment
X Z Y 1D horizontal projection 1D vertical projection Centre Width of the plaque
2.3.2.1.1 Slice thickness and alignment tests
Slice thickness and alignment are measured in the ROI showed in figure 9.
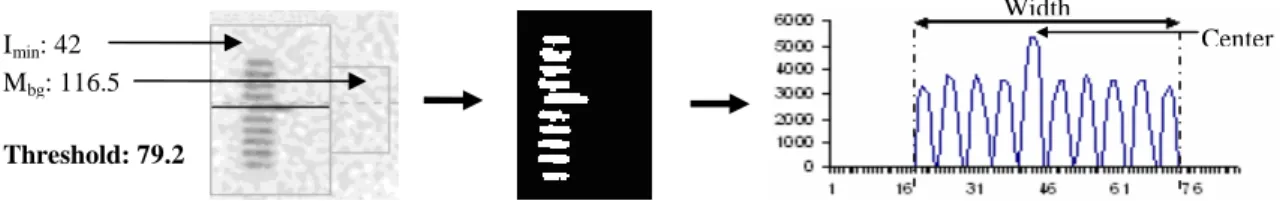
Figure 9. Slice thickness measurement: original image of the ROI (left), the same image after the threshold (middle). On the right is the projection of this binary image.
Our method consists of measuring the FWHM of the group of the lines. To find the FWHM, a binary image is being produced using a threshold which is called half maximum CT number, the resulting image is then projected in horizontal axis; the FWHM is equal to the width of the non-null values in the projection. The threshold used is equal to:
P max min I bg M bg M Threshold = − −
×
, (3)where Mbg is the mean CT value of the background, measured in the area adjacent to the group of lines, and max
min I is the minimum or maximum (this depends on the contrast, background intensity/pattern) CT number inside the rectangular area surrounding the group of lines. P is a percentage value, equals to 50% in the case of FWHM, which is the full width at 50%. The slice thickness is finally determined by multiplying the FWHM with the tangent of the angle formed by this ramp of holes (27° for the GEMS phantom) and by adding a increment equal to the half distance between 2 holes. This measurement is done with the two ramps and the final result is the mean of the two values. We apply the same method to calculate the full sensitivity slice profile by using successive values of P in Eq. (3).
The misalignment of the CT’s positioning light is calculated by finding the position of the longest line with respect to the group. This position corresponds to the maximum value in the one-dimensional projection.
2.3.2.1.2 High contrast scale test
The second parameter to control in this image is the high contrast scale, HCS, i.e. the difference between the mean value of the CT signal in a 10x10mm² ROI located in the acrylic plate and the mean value of the CT signal in an identical ROI located in the background (water).
2.3.2.1.3 Spatial resolution: Practical MTF computation
The spatial resolution is calculated from the measurements acquired from the six groups of cyclic bar patterns. These patterns are automatically extracted from the image according to the following algorithm:
• Apply a one-dimensional median filter, this filter has a slope of 45 degrees and its size is 5 pixels. • Perform an image segmentation with a threshold equal to 75
• Count the number of regions inside the interesting part of the image. • While the number of regions is bigger than 6
• Dilate all the regions previously found with a 2D structuring element of 3x3 pixels size • Apply an erosion the final regions using the same structuring element
• Find the gravity centers and the sizes of the 6 regions
After finding the positions and sizes of each group, new ROIs are constructed at the same position but with a size that is equal to 80% of the calculated sizes.
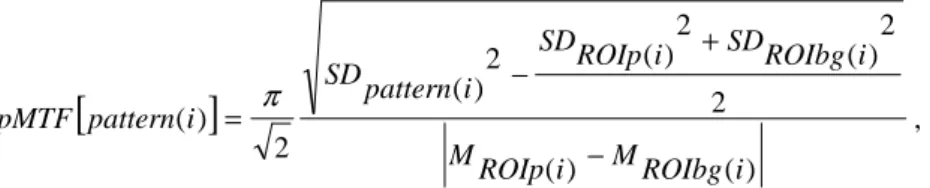
A practical modulation transfer function (pMTF) is then calculated with the formalism proposed by Droege9 where the pMTF is given from measurements of the standard deviation of the pixel values of each group of patterns:
Threshold: 79.2 Imin: 42
Mbg: 116.5
Width
[
]
) ( ) ( 2 2 ) ( 2 ) ( 2 ) ( 2 ) ( i ROIbg M i ROIp M i ROIbg SD i ROIp SD i pattern SD i pattern pMTF − + − = π , (4)where pMTF[pattern(i)] is the pMTF value for the frequency corresponding to the pattern group (i), SDpattern(i) is the SD
of the pixel values of group of patterns (i), SDROIp(i) and SDROIbg(i) are the SD of the pixel intensity value in two ROIs
having the same size of the pattern group (i), the first is located in a homogenous region with same composition than the pattern and the second lays in the background medium, while M ROIp(i) and M ROIbg(i) are the mean values of the pixel
intensity within the same ROIs. A zero frequency patterns are represented with a rectangular ROI located in the border between the acrylic (bg medium) and the water (pattern material) image in figure 10-c.
Applying this formula in a perfect 2D object leads to a constant function with a value of
π
/
2
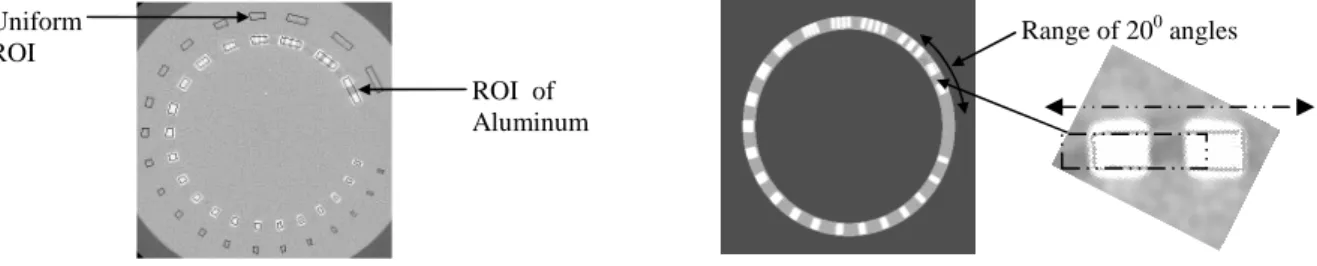
that corresponds to the 1D slicing of the 2D Gaussian.Figure 10. The 6 groups of patterns to be analysed (left), the corresponding segmented image (middle) and the image of these patterns each one delimited with a rotated rectangle.
2.3.2.1.4 Low contrast scale test
Low contrast scale (LCS) is tested with the second image. After finding the center of the phantom, its rotation angle is calculated by detecting the position of the two holders of the polystyrene plate in an 625x72mm² area (figure 11-b).
Figure 11. ROI used to calculate low contrast resolution
Four rectangular ROI are used to calculate the low contrast scale (LCS), i.e. difference between the mean value of the intensity pixel mean value in the two ROI located in the polystyrene plate (Mbg1, Mbg2) and the mean value of intensity
pixel mean value of the two ROI located in the water (MW1, MW2).
2.3.2.1.5 Low contrast detectability test
The number of visible circular ROI is also calculated. ROI is considered visible when:
N P i SD C P ref C bg M i M − ≥ × − × , (5) where
(
M
bg1M
bg2)
/
2
bgM =
+
represents the background signal, Mi the mean CT values of the ROIi. PC representsthe percentage of the reference contrast Cref (in this case LCS) that has to be present in the ROIi in order to be visible and
PN is the lack of visibility due to the noise represented by SDi the standard deviation of the CT values in the ROIi.
ROIp(i) ROIbg(i) pattern(i) Zero frequency Rotation angle MW1 MW2 Mbg1 Mbg2
2.3.2.1.6 Geometric distortion, noise and uniformity tests
The center of the last GEM phantom image is calculated by the projection method where the circular external acrylic envelop of the phantom is detected. These parameters are also used to evaluate the geometric distortions by a comparison between the dimension in pixel and the real size of the phantom. Then five ROIs are built, one located in the center of the image and the other four distributed in periphery. Noise is estimated by SD of the intensity pixel in the central ROI and the uniformity by a comparison between all fives ROIs.
2.3.2.2 CATPHAN600 phantom
2.3.2.2.1 Sensitometry, practical volume artefact, Slice thickness and pixel size tests (section CTP404)
The registration of the measuring mask of ROI on the image is done after localisation by the software of four holes showed in the figure 12. Positions and size of the four squares where the algorithm search the presence of each hole are given by the user.
Figure 12. CTP404 section with ROIs used to acquire measurements.
Pixel size can be calculated by a comparison of the number of pixels between the 2 opposite hole centers and the real distance 50mm. By detection of the border of the phantom and comparison of its size with the real dimension, the system evaluates also the geometric distortions.
Slice width and misalignment errors are measured using the four wire ramps. This method is already described in (2.3.2.1.1). The increment value used here is zero because ramps are continuous wires and the angle is 23°.
The scanner ability to image volume averaged spheres is calculated using Eq (5) which defines the visibility of a circular ROI positioned on one of the five inner acrylic spheres. The background is a circular ROI located in a uniform zone at the same periphery of the acrylic spheres with a radius equal to the radius of the biggest sphere.
The last test consists of evaluating the stability of the CT numbers and in consequence the stability of the electronic density (ED) conversion. The super user of the system establishes the reference correlation between the electronic density relative to the water and the CT Number of each material (Table 1). The algorithm fits these data with two linear curves. Then the quality control consists to estimate the deviation in comparison with this model.
Table 1. Characteristics of the 7 sensitometric targets: electronic density relative to the water and CT number.and the two correspondent curves on the right.
Electronic density CT number Air 0.0010 -932.3 PolyMethylPentene (PMP) 0.853 -172.6 Polyethylene (LDPE) 0.944 -84.1 Polystyrene (PS) 1.017 -31 Acrylic (PMMA) 1.146 116.4 Delrin (POM) 1.353 341.8 Teflon (PFTE). 1.867 928.8
Wire ramp (Max) 5 acrylic spheres (Mi, SDi)
4 holes Background (Mbg ramp)
One of the 8 high contrast sensitometric targets
Background (Mbg alias)
CT number
E.D .
2.3.2.2.2 Slice thickness: section CTP591
Before applying the measuring mask of ROI, the system detects the position of the 6 ramps by projection method after to apply a grey level threshold equal to 50 on the image. The same registration method is also used for the CTP515 and CTP528 sections.
The method used to calculate slice thickness was previously presented in 2.3.2.1.1 for the GEMS phantom. Differences are the increments which are 0.5mm and 0.125mm respectively for the thick and thin ramp, and angles which are respectively 27° and 7° for the thick and thin ramp. The wide of the thin ramp in the z direction (6mm) is taken into account by the system which tests automatically if a part the CT slice can be outside of this ramp. In this case, the system gives the measurement using the thick ramps.
Figure 13. CTP591 (left) and its 1D vertical projection (right).
2.3.2.2.3 Spatial resolution: Practical MTF computation (section CTP528)
The method used to calculate the center of the phantom in the section CTP591 is also used here. The rotation angle of the phantom is retrieved by calculating the position of the biggest pattern group in the image. To do so, a ring shaped image is constructed as shown in figure 14 using two circles centered at the phantom’s centers; an outer circle (radius= D + 3mm) and an inner circle (radius = D - 3mm), where D is the distance between the phantom’s center and the patterns. A rectangular ROI with the same size and distance of the biggest patterns is then constructed and scanned over the resulting image. The scanned positions cover an arc of 20° (from 15° to 35° with a step of 0.5°). The mean CT value inside the ROI is calculated for each angle, and the angle with the biggest mean value represents the angle of the studied pattern. Knowing the real and the calculated angle of this pattern, the rotation angle of the phantom can be retrieved.
Figure 14. CTP528 (left). Ring shaped image (middle) and an outline representing the search procedure for the position of the biggest pattern (right).
Eq. (4) is used to calculate the pMTF. For each group of patterns MROIp(i) and SDROIp(i) are calculated within ROIs located
in a region at the same range of the corresponding patterns with a 12mm bigger distance, while a ROI of Aluminium is simulated by duplicating the Aluminium area of the biggest pattern group as shown in figure 14, this ROI is used to calculate MROIbg(i) and SDROIbg(i).
2.3.2.2.4 Low contrast delectability test (section CTP515)
The center of the phantom is calculated using the same method already applied for the section CTP591. The rotation angle is retrieved by calculating the position of a specific target within the Supra-slices. The target chosen is the biggest one with the highest contrast. Its position is calculated by correlating a 30mm2 ROI that contains a circle of 14mm diameter. Pixels inside the circle have a value of 50, and the others 45.
Ramps with 0.18mm diameter beads Ramps with 0.28mm diameter beads Centre Width Range of 200 angles Uniform ROI ROI of Aluminum
Low contrast resolution is calculated by counting the number of visible ROI within each of the six groups (3 groups of sub-slices and 3 supra-slices). The visibility procedure is the same as in the CTP404 section. To measure the CT value in the background of the supra-slice, 3 circular ROI are used. These ROIs are adjacent to the measured targets and have the size of the second biggest supra-slice as shown in figure 15., the CT mean values are calculated in each ROI, the result is the mean of the three values. The same procedure is applied to the sub-slice targets.
Figure 15. CTP515 section
2.3.2.2.5 Noise and uniformity tests
Finally, noise and uniformity are calculated within the CTP486 section in the same manner for the GEMS phantom.
3. RESULTS
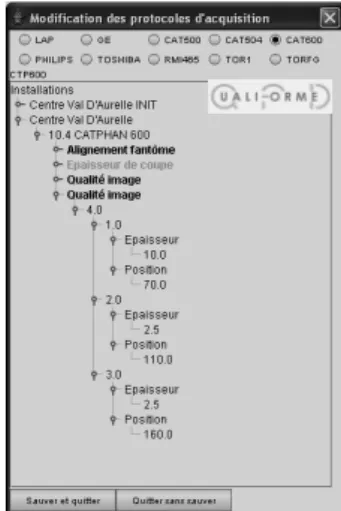
Images for the quality control have been acquired using a “GE Medical System CT scanner (Light speed RT)”. In order to accomplish the test automatically and to simplify the control process, an acquisition protocol had to be defined in advance by the super user of the software in an interface as shown in figure 16. This protocol gives the software the position of each image inside the whole set of images which allows to loop automatically and to acquire right measurements associated with right control parameters. Therefore, 4 steps are needed to establish a control; (1) choose the installation, (2) choose the exam, (3) filter the images and (4) execute the control process. Results are then displayed in a list containing control parameters and their corresponding tolerance values. Another option allows a “Step by Step” control; it consists of detailing the control process and allows visualizing all the ROIs and the calculation details related to all parameters within each image.
Figure 16. Protocol windows : installation name, protocol name, types (phantom alignment, slice thickness, image quality and sensibility profile) and descriptions of the series.
An Intel double processor of 3.6GHZ Pc is used. The control time takes approximately 30 seconds for the CATPHAN600, 20 seconds for the GEMS and 1second for the LAP phantom. The image quality (spatial resolution contrast, noise and uniformity) for the CATPHAN600 and GEMS phantoms is controlled using two modes, bone and standard. In addition to this, the CATPHAN600 control contains one image for the geometric distortion, pixel length, laser alignment, electronic density, 11 images to test 11 different slice thicknesses while the GEMS phantom control
Correlation ROI Sub-Slices Supra-slices
contains 7 images for the slice thickness and laser alignment controls. The LAP phantom control is done using 11 images.
3.1 LAP
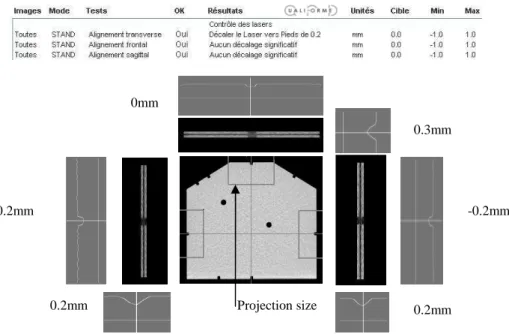
Figure 17 shows the automatic and the “Step by Step” results of the LAP phantom control process.
Figure 17. The LAP control automatic results (top image). The outline (bottom of the image) is the “Step by Step” control process. LAP image is in the center surrounded by all the projections used to calculate the misalignment. Results indicate that misalignment in Z direction is equal to 0.2mm, while no misalignments were found in Posterior/Anterior and Left/Right directions. These results are consistent with the manual control results.
3.2 GEMS
Figure 18 shows the GEMS phantom control process (automatic and “Step by Step).
Figure 18. On top are the final results of the GEMS control. The bottom images: from left to right, parameters calculated are: on the first image, the high contrast scale resolution, HCS=114.9HU. In the second image the low contrast scale, LCS= 8HU and the number of visible according to Ep. (5), 5 ROI are considered visible (PC=10 and PN=35). Three parameters are calculated within the third image, the size of the phantom (214.8mm), noise (3.9HU) and uniformity (0.7HU). The last image is the pMTF (Droege). The frequency is expressed in Line pair/cm.
Projection size 0.3mm 0.2mm -0.2mm 0.2mm 0.2mm 0mm pMTF (lp/cm)
3.3 CATPHAN600
Figure 19 shows the CATPHAN600 phantom control process (“Step by Step” and automatic).
Figure 19. The five images on top (from left to right), the first image is the CTP404 section, parameters controlled are: phantom size (149.4mm), pixel size(0.351mm), number of visible ROI (2), maximum deviation of electronic density (-1.49%), CT number of Air(-926.4). the second image is the CTP591 section and used to calculate slice thickness 4.723), the real slice thickness is 5mm. The third image is the CTP515 section, number of visible ROI of each group is : Supra-slice1 (9 ROI), Supra-slice2(4 ROI), Supra-slice3(5 ROI), Sub-slice1(2 ROI), Sub-slice2(1ROI) and sub-slice3(2 ROI). The fourth image is used to calculate the pMTF ; the pMTF is shown in the bottom-left of this figure. The MTF values of 21 frequencies are calculated. The last image is used to calculate the noise (19.7HU) and uniformity (1HU). The automatic control process is shown in the table illustrated at the right bottom side.
4. DISCUSSION
DTOs simulating real phantoms are being generated in order to control our algorithms.
A large panel of LAP Digital Test-Objects with different shifts allows to confirm that our algorithm gives the misalignment of the CT’s light positioning with a precision of half pixel size for left/right and anterior/posterior directions and half slice thickness for the Z direction.
A large panel of blur and noise function were applied on the perfect GEMS DTO. After generation of distorted DTOs, the software measured the pMTF and noise level with our alogorithm. In all situations it recovered the entry value of the noise. For the pMTF, see Eq. (4), the software in the DTO mode compares the Fourier transformation of the PSF used to disturb the perfect DTO with the pMTF. The pMTF using Droege method and the Fourier transform of the PSF where three PSF with different FWHM are shown in figure 20. From left to right, FWHM= 3pixels, 5 pixels and 7 pixels. The corresponding frequencies in line pair per pixel at 50% and 5% of MTF are respectively: (0.2 and 0.15), (0.12 and 0.09) and (0.09 and 0.06) the first value corresponding to the pMTF and second one to the Fourier transform of the PSF. The obtained pMTF equals to the theoretical MTF by a multiplying factor constant, and this might be due to the Droege formulae (going from 2D to 1D normal Gaussian).
.
Figure 20. Comparison of the pMTF and the Fourier transform of the PSF, the points (■) represent the pMTF calculated for each frequency, and the lines are the Fourier transform of the PSF.
pMTF pMTF pMTF lp/pixel lp/pixel lp/pixel pMTF (lp/cm )
5. CONCLUSION
Software capable of performing an automatic CT image quality control has been described in which new algorithms for detecting the position of the phantom have been used. These algorithms allow detecting the translation and rotation of the phantom with respect to the center of the image; translation and rotation are then applied to all the ROIs in the image before acquiring any measurements. The information a priori of object’s geometry along with translation and rotation that were calculated are used to determine the desired positions of the ROIs in each image.
Furthermore, a technique of generating digital test objects has been described. The DTOs is a digital representation of the phantom, and it is designed to have almost the exact geometry of the physical phantom. DTOs are used in order to facilitate the implementation of the algorithms and the possibility of introducing noise and blur allows testing the accuracy and the limits of these algorithms.
Images issued from CT scanners have been controlled with these algorithms, almost all control parameters have been calculated, slice thickness, spatial resolution, contrast, noise, uniformity. Results are more accurate, user independent, quantitative and time saving comparing to conformal manual CT image quality control.
Automatic quality control along with digital phantoms proved to be an important technique which helps to improve the CT image quality control. Future work will concentrate to finishing the development of the DTOs that model the CATPHAN600 phantom and to introduce some new tools to have a complete automatic quality control for the on-board imaging system installed on the new linear accelerator used for radiation therapy treatments.
REFERENCES
1. American Association of Physics in Medicine Radiation Therapy (AAPM)- Committee Task Group 39 : “Specification and acceptance testing of CT scanners”.A. Eisenberg, Guide to Technical Editing, Oxford University, New York, 1992.
2. IMPACT. CT Scanner Acceptance Testing. ImPACT Information Leafli 1. 2001 “http//www.impactscan.org/acceptance.htm”.
3. Andreas Jahnen, “Quality Control for Optimal Medical Images”, Centre de Recherche Henri Tudor, 29, Avenue John F. Kennedy, L-1855 Luxembourg.
4. “AutoQA Lite for CT Scanners”, The Institute For Radiological Imaging Sciences, Inc. 3 Hillcrest Drive suite 202a *Frederick, MD 21703*.
5. LAP PatPos invent laser system, LAP GmbH Laser Applikationen, Zeppelinstr. 23, 21337 Lueneburg, Germany.
http://www.LAP-Laser.com
6. QA Phantom Ref: 46241852G1, GE Medical Systems.
7. Catphan ® Manual, the Phantom Laboratory Inc., Legrys Road, Cambridge, NY 12816, June 1997. “http//www.phantomlab.com/catphan.html”.
8. Steven W. Smith. The Scientist & Engineer's Guide to Digital Signal Processing, second edition.