HAL Id: hal-01111789
https://hal.archives-ouvertes.fr/hal-01111789
Submitted on 31 Jan 2015
HAL is a multi-disciplinary open access
archive for the deposit and dissemination of sci-entific research documents, whether they are pub-lished or not. The documents may come from teaching and research institutions in France or abroad, or from public or private research centers.
L’archive ouverte pluridisciplinaire HAL, est destinée au dépôt et à la diffusion de documents scientifiques de niveau recherche, publiés ou non, émanant des établissements d’enseignement et de recherche français ou étrangers, des laboratoires publics ou privés.
processes of growth and tertiarisation in developed
economies reversible? An evolutionary perspective
Benoît Desmarchelier, Faïz Gallouj
To cite this version:
Benoît Desmarchelier, Faïz Gallouj. Endogenous growth and environmental policy: are the processes of growth and tertiarisation in developed economies reversible? An evolutionary perspective. [Research Report] Université Lille 1, CLERSE. 2010. �hal-01111789�
ServPPIN: The Contribution of Public and Private Services to European Growth and Welfare, and the Role of Public-Private Innovation Networks
WP 1: New service developments and the contribution of private and public services to growth and welfare
WP 7 (foresight)
Deliverables
Endogenous growth and environmental policy: are the processes of growth and tertiarisation in developed economies reversible? An evolutionary perspective
Benoît Desmarchelier Faïz Gallouj Clersé, Université Lille 1
The European Commission
Abstract:
The starting point for this article is the idea put forward by Gadrey (2008, 2010) that environmental problems and a policy of addressing them by introducing an environmental tax could trigger economic contraction and downscaling and a shrinking of the service sector in developed economies. The purpose of this article is to test these hypotheses using an evolutionary simulation model. To this end, we use a model of endogenous growth and structural change into which an environmental dimension is incorporated. The results of our simulations certainly reveal structural change within service industries but no change in the distribution of employment between services and manufacturing. Furthermore, we show that the environmentally desirable stagnation of labour productivity in the capital goods sector is compatible with a largely positive growth trend in the economy as a whole, with the development of knowledge-intensive business services apparently able partially to offset the stagnation of productivity in the capital goods sector. We conclude by emphasising the need for environmental innovation in service activities and casting doubt on the long-term effectiveness of an environmental tax in the fight against pollution.
Endogenous growth and environmental policy: are the processes of growth and tertiarisation in developed economies reversible? An evolutionary perspective1
Benoît Desmarchelier Faïz Gallouj Clersé, Université Lille 1
Introduction
The theoretical debates on how to explain and evaluate the development of the service sector set the post-industrial and neo-industrial schools against each other in the 1970s. The post-industrialists (Bell, 1973; Fourastié, 1949) saw the advent of the service economy as an ineluctable consequence (which was not to be perceived negatively) of the conjunction of a productivity law and a demand law. For their part, the neo-industrialists (Gershuny, 1978, Gershuny and Miles, 1983; Bacon and Eltis, 1978; Attali, 1981, Lipietz, 1980), more or less implicitly, took a negative view of the process of tertiarisation; for them, manufacturing industry was the engine of growth and deindustrialisation a pathology. The intensity of these debates has gradually faded, with the post-industrialist perspective becoming more firmly established as contemporary economies have been recognised as being irredeemably service economies. Thus public policies have supplemented defensive strategies aimed at curbing the process of deindustrialisation with offensive strategies aimed at exploiting the resources of the service sector (in particular potential sources of jobs).
The concept of sustainable development, which emerged out of an essentially industrial and technological background (Djellal and Gallouj, 2009), initially served to reinforce the argument that the development of the service sector was an irreversible process, a trajectory that economies were locked into. After all, although some services are acknowledged to be particularly harmful to the environment (particularly transport), the dominant general hypothesis is that the assumed intangibility of services tends to make them environmentally friendly. Services, it is argued, are almost by their very nature „green‟ activities (OECD, 2000).
In some particularly stimulating studies, one of the leading European proponents of the post-industrialist school, Jean Gadrey (2008; 2010), suggests that this optimistic view of a service economy that will be asymptotically dominant in the long term should be revised. In a prospective analysis that can be described as neo-industrial, he argues that „the historical trend towards an increase in the share of services in total employment and value added will be modified and possibly reversed in developed countries, as will the trend towards economic growth and productivity gains, as they are currently defined and measured’ (Gadrey, 2008). In other words, the historical process of service sector expansion is reversible and the future of services, like that of other activities, will be heavily dependent on their link to the environmental problematic. Furthermore, economic contraction or downscaling (décroissance, literally de-growth) appears to be a plausible scenario2
.
Gadrey‟s argument is that service economies, contrary to certain preconceived ideas, are also damaging to the environment. The intangibility of services is not necessarily a criterion of environmental sustainability, since the production of intangible outputs depends directly and indirectly on non-renewable energy and natural resources just as much as that of tangible products does. The other criterion by which services are defined, namely the fact that they are interactive or co-produced (simultaneous physical presence of service provider and customer), is often synonymous with travel and hence with pollution. After all, the service economy is an economy based on mobility (on the part of customers, service providers or the medium of service provision). Furthermore, actually putting this coproduction into practice (known in management sciences as „servuction‟) requires the mobilisation of many tangible elements (physical spaces and technical tools) whose construction, operation and maintenance make use of non-renewable natural resources. From the perspective of coproduction, services appear almost „by nature‟ as particularly environmentally unfriendly.
In order to back up his argument, Gadrey suggests that one of the main explanatory models of service-sector growth, namely Baumol‟s unbalanced growth model (Baumol, 1967) should be modified to incorporate environmental externalities. According to this well-known model, the development of the service sector is made possible by the productivity gains achieved in the capital-intensive sectors (the so-called „progressive‟ sectors, mainly manufacturing industry). The workforce no longer required in these sectors is in effect
2 Gadrey (2008) does, after all, advance the hypothesis that „many necessary changes in the production (of goods or services) will be accompanied by a reduction in labour productivity, at least as it is currently measured‟ (p.13).
transferred to the so-called „stagnant‟ sectors (services for the most part), which are characterised by a low level of automation and lower productivity gains.
Thus Gadrey takes the view that if environmental externalities are internalised (by means of taxes or other mechanisms), the revised version of Baumol‟s model leads to different conclusions. The internalised environmental externalities can be likened to the assumed fixed cost „of a stagnant service (provided by nature)’ that refuses to adapt to productivity gains in its „work‟. In this way, Gadrey introduces an element of stagnation into manufacturing production, which was initially assumed to be progressive by nature. The cost of this stagnant element could make the labour factor relatively less costly than using more productive but polluting technologies. Thus manufacturing firms could be encouraged to switch to more labour-intensive technological trajectories. Service firms, for their part, would find it more difficult to follow similar trajectories because their production process is by its nature already labour-intensive. If reflected in their prices, the additional costs the tax would impose on them should cause the volume of demand for services to decline, which would free up workers for employment in the manufacturing sector.
The conclusion of Gadrey‟s argument is that, if environmental externalities are taken into account, the historical process of tertiarisation in our economies should be reversed: the service sector will shrink and there will be a return to more labour-intensive processes in the traditional sectors, which today are highly capital-intensive (including agriculture). Moreover, Gadrey (2008) does not exclude a reduction in productivity and growth over the long term (economic contraction hypothesis), since it is highly likely that „the costs of nature’s services per unit produced in manufacturing industry’ will increase in future.
The aim of this article is to use a multi-agent computer model to test the hypothesis that the historical process of growth in the share of services in wealth and employment will be reversed and, more generally, that economic activity will contract. It is divided into three sections. The first is given over to analysis of the main factors required to model the tertiarisation of an economy (the explanatory variables for service sector growth). In the second section, we develop a growth model that accounts for the dynamic of service sector growth and for the relationship between services and economic growth. To this end, we adapt an evolutionary growth model that draws on Dosi et al. (2006, 2008a and b) and then carry out a number of simulations in order to test the model‟s behaviour over the long term, and in particular the role played by intermediate services. Finally, in section 3, we consider the modelling of environmental policies and test the validity of the hypotheses of economic contraction and reversal of the service sector‟s growth dynamic.
1. The determinants of service sector development in industrialised economies
In the economic literature (Fuchs, 1968; Stanback, 1979; Gadrey, 1996; Schettkat and Yocarini, 2006; Lorentz and Savona, 2008), three main factors determining the increase in the share of GDP and employment attributable to the service sector are identified: 1) lower growth in labour productivity in service industries than in manufacturing; 2) the shift in end consumer preference towards services, and 3) the demand for services from firms. In introducing the dynamic of service sector development into our growth model, these three determinants will have to be taken into account.
1.1 Differential productivity growth
The law of differential productivity growth is the main explanation to be found in the literature for the high rate of service sector expansion. The basic premises for this argument were already outlined by Fourastié (1949) and it lies at the heart of studies by Fuchs (1968) and, in particular, Baumol‟s unbalanced growth model (or law) (Baumol, 1967) referred to in the introduction. In this model, the economy is divided into two sectors: 1) a sector (described as non-progressive or stagnant) in which, allowing for its low capital intensity, labour productivity is constant; 2) a sector (described as progressive) in which labour productivity is increasing because of the introduction of technologies. According to Baumol, most services belong to the non-progressive sector. Few productivity gains can be realised there, since the opportunities for automation are limited, with the end product often being synonymous with the labour factor itself. Assuming that end consumers‟ budgetary coefficients are constant and that wages, which are the same for all workers in the economy, rise at the same rate as productivity gains in the progressive sector (manufacturing industry), then the progressive sector will shed surplus manpower, which will find employment in the service sector. Thus employment in manufacturing should tend asymptotically towards zero. Similarly, the growth rate in the economy should also tend towards zero (if the economically active population remains constant), since the sector in which productivity remains constant will account for all activity.
Baumol’s model has given rise to certain criticisms. It should be noted that, by way of response to these criticisms, Baumol himself (1986, 1989, 2002) proposed an amended model that takes into account the sometimes pervasive introduction of computer technology into
services. Thus this new model comprises three sectors: 1) a sector with increasing productivity (e.g. durable goods); 2) a sector in which productivity is constant (e.g. theatres, concerts); 3) an intermediate sector in which productivity is asymptotically stagnant, i.e. productivity begins by rising before stagnating because of the sector’s hybrid composition (this applies, for example, to IT, which comprises hardware and software).
Thus those service industries that are currently experiencing some productivity gains combine two types of inputs: a progressive input (technological equipment) and a stagnant input (mental or intellectual work). Initially, the reduction in the price of productive capital outweighs the unprecedented rise in labour costs. Over the longer term, however, this increase in labour costs will always prevail eventually. The rise in the cost of the service will automatically reduce demand in the long term, or at least prevent it from increasing in volume. Consequently, the sector will cease to grow in real terms. Noting that activities as crucial as R&D are potentially affected by this phenomenon, Baumol concludes that long-term economic growth in capitalist economies could tend towards zero (Baumol, 1983 and 2002).
All things considered, the hypothesis of productivity gain differentials between goods and services remains relevant (Gadrey 1996, Outlon 1999), even though some have undeniably seen significant productivity gains (Gadrey, 1996; Outlon 1999) and economic theory faces formidable methodological problems when it comes to measuring productivity in services (Griliches, 1992; Gadrey, 1996; Djellal and Gallouj, 2008).
1.2 Individual consumer preferences
Favouring an explanation based on productivity differentials, Baumol makes the assumption that the share of services in final demand is constant. This assumption is debatable (Summers, 1985; Schettkat and Yocarini, 2006). The explanation for service sector expansion in which the determining factor is increased final demand for services, i.e. a shift in consumer preferences, is based on Engel‟s law, which states that the share of non-basic goods in household consumption rises as household income increases. It does not necessarily state that the consumption of basic goods (particularly food) declines in favour of non-basic goods but rather that consumption of the former increases less quickly than income. Thus service economies continue constantly to consume more goods (Gadrey, 2008, 2010).
Jonathan Gershuny (1978)3, adopting a neo-industrial perspective, uses Engel‟s law in a particularly original way to support the argument that the service society is, in reality, a self-service society. In his analysis, the trade-off is not between self-services and goods but between service functions (food, housing, leisure, transport, education, health functions).These various functions can be fulfilled in two different ways, either through the formal sphere (in which case the service is obtained from an outside provider) or through the informal sphere (in which case two factors are combined: a purchased good or piece of equipment and the domestic work necessary to put it to use). On the theoretical level, Gershuny does not refute Engel‟s law, namely the shift in final demand away from goods towards services. Rather, the hierarchy of needs is simply shifted from the opposition between goods (basic) and services (non-basic) to a hierarchy of functions (the leisure function, for example, is superior to (i.e. less basic than) the food function). Gershuny, it should be noted, deploys the productivity differential argument in order to explain the preference for self-service. After all, it is the low relative productivity in services and hence their higher price relative to goods that explains the preference for self-service.
1.3 The role of firms’ demand for services
One of the main criticisms directed at Gershuny‟s self-service theory is that it applies to households‟ final consumption of services but not to firms‟ demand for services (intermediate services). Now services to firms have been growing very strongly for several decades. The demand for intermediate services has played an important role in the tertiarisation of economic activities. It also calls into question the idea of an opposition between goods and services, which here emerge rather as complementary (Stanback, 1979).
Outlon (1999) shows that the decline in the growth rate revealed by Baumol‟s model is true only because, in the model, the stagnant sectors produce nothing but final services. If intermediate services are taken into account (i.e. services to firms and financial services), and even if such services are considered to be stagnant or asymptotically stagnant, then the rate of growth will rise automatically rather than decline. After all, the output of a worker employed in intermediate services increases when counted in terms of industrial goods by virtue of the productivity gains realised in the client manufacturing industry. Furthermore, any productivity
gains, even slight ones, achieved in the intermediate service sectors will help indirectly to increase productivity in the client manufacturing industry, which will be producing more goods while consuming fewer services. Thus Outlon‟s argument is primarily an accounting argument. The literature also a number of attempts (Antonelli, 1998; Camacho and Rodriguez, 2010) to validate empirically the effects of intermediate services on their clients‟ productivity. For Outlon, it will be noted, the growth in intermediate services cannot be explained by a change in firms‟ needs but rather by a cost-based argument. Thus, since intermediate services benefit from the productivity gains, however low they may be, they turn out to be relatively less expensive than directly employing the necessary labour. Thus manufacturing firms gradually substitute intermediate services for labour in order to increase their profit margins. Consequently, the economic trade-off leads them to outsource some of their internal functions. This is an explanation based on transaction costs. Although manufacturing firms and service firms can both engage in outsourcing, the outsourcing argument has often been called on to support the industrialist arguments that it is manufacturing industry that is the engine of growth and creator of jobs.
This explanation for the growth of services to firms, based on a transaction costs argument, is frequently encountered. However, it seems more relevant to operational services (e.g. cleaning, catering etc.) than to knowledge-intensive business services (KIBS), such as engineering, R&D and consultancy. As Gadrey et al. (1992, 1998) point out, strategic activities are not subcontracted and what can be observed in fact is that internal and external functions grow simultaneously. In the case of KIBS, therefore, the transaction costs argument is not sufficient and needs to be supplemented by one based on cognitive differentials (Gallouj, 2002; Toivonen, 2004). The growth in both these KIBS and the corresponding demand has more to do with a demand for competences and expertise generated by the increasing uncertainty and complexity of production and consumption processes (Gallouj, 2002). In other words, a company calls on a provider of intermediate knowledge-intensive services when it observes a „cognitive differential‟ between itself and the service provider. These intermediate services (which may be intermediate consumption in any sector but is sometimes also genuine intangible investment) are extremely important since they have two essential characteristics (Gallouj, 2002). Firstly, they are particularly innovative in themselves. They are more innovative than many manufacturing sectors. Secondly, they give rise to innovations and productivity gains in the client organisations (whether in manufacturing or services).
2. Tertiarisation and growth
A growth model that seeks to take account of the dynamic of service sector expansion or contraction will have to include all three of the factors driving the development of the service sector already mentioned above. Thus the model we are proposing will have the following characteristics: 1) income elasticity of final demand lower than unity for goods and greater than unity for services; 2) a final services sector in which productivity growth is lower than in the final goods sector; 3) a (knowledge-intensive) business services sector that serves all the other sectors of the economy and whose growth is explained more by a cognitive differential between firms in the corresponding sectors than by a cost differential.
2.1 The model
The model we are proposing to construct is not a formal calculation model like those of Outlon and Baumol. Rather it is a simulation model that has its roots in agent-based computational economics (ACE). Despite a lower degree of generality (the functions are specified and the parameters have to be set), computer modelling does have certain advantages:
- The calculating power is very high, which makes it possible to create complex, micro-based models.
- It is possible to retranscribe complex but non-optimising empirical behaviours in the form of algorithms.
- The empirical sources suggest a certain world view (stylised facts) which, when simulated, may prove to be coherent. If this world view is not coherent, or if it is based on an incomplete or invalid theory, either the computer will be unable to read the program or it will produce inconsistent time series for the key variables.
- In its programmed form, the model becomes a flexible tool that can subsequently be refined in a number of different ways and be used as a laboratory to test the effects of different economic or political contexts.
The model we are proposing has its roots in that developed by Dosi et al. (2006, 2008a and b), which it enhances in various ways. It is a vintage capital model. Consequently, capital goods are assumed to be heterogeneous. In this type of model, growth is dependent on capital accumulation, the rate of productivity gains in manufacturing industry and the rate at which
old capital goods are replaced by new ones. Thus they can be said to be explicitly industrialist in nature.
The choice of this type of (vintage capital) model can be justified in various ways:
- The environmental and ecological problematic is at the heart of our deliberations on economic contraction and the reversal of service sector expansion. Now as it happens, innovations in environmental technology are produced mainly in capital goods industries (Huber, 2008).
- Environmental policies could trigger a large-scale trend towards the replacement of existing machines by new, less polluting ones. With this type of model, the effect of a possible stimulation of short-term aggregate demand, and thus of a possible acceleration of growth, can be taken into account.
- Since we want to test the hypothesis of service sector contraction, our model has to take account of a dynamic of service sector development and thus has to be able initially to describe growth based purely on manufacturing industry. Although most growth models are able to describe such growth, vintage capital models are particularly explicit in presenting an industrial economy‟ growth engine. Our growth engine must also be capable of an endogenous shift towards service activities. Quite obviously, if this process of tertiarisation is to be taken into account, then the service sector has to be incorporated into the model.
2.1.1 An evolutionary multi-agent model
The model on which we draw and which we adapt to our particular problematic is an evolutionary multi-agent model developed by Dosi et al. (2006, 2008 a and b) in order to explain economic cycles endogenously. It consists of two manufacturing sectors: one produces capital goods using labour as the only factor of production, while the other purchases these capital goods and labour in order to produce a final good. The economically active population is assumed to be constant. For each time period, the sequence of events is as follows:
1. In Dosi et al.‟s model, firms in the final goods sector receive information on latest-generation machines from firms in the capital goods sectors. In the amended version we are proposing, on the other hand, producers of final goods choose a supplier randomly; the probability for a supplier of being chosen is proportionate to his competitiveness . This competitiveness is measured as follows:
is the productivity of the machine provided by supplier
is a positive real number that reflects the sensitivity of final goods producers to the competitiveness of the capital goods supplier. The higher this number is, the greater market selection in the choice of supplier will be.
is its price, which is measured as follows4 :
In this price equation, is the capital goods producer‟s profit margin5 and is the macroeconomic wage, such that:
where is the level of wage indexation to labour productivity and is average macroeconomic productivity6.
2. In Dosi et al.‟s model, final goods producers, having chosen a supplier, decide on their replacement investments. Let be the productivity of a final goods producer‟s machine k and b a (positive real) parameter that reflects the final goods producer‟s psychology. Machine
k will be replaced if:
4 represents labour productivity in the capital goods firm. For simplicity‟s sake, it is identical initially to the productivity of the machine produced and sold.
5 As all profit margins in our model are identical, regardless of sector, they are denoted by the term in all sectors.
6 The model we are proposing will comprise 4 sectors. If , , , are, respectively, labour productivity in the final goods firm i, the capital goods firm , the final service firm and the intermediate service firm and N is the total number of firms, then average macroeconomic productivity is:
The final goods producer will replace its capital goods more frequently the higher b is. Thus it makes its investment decisions on the basis of an imperfect measure (since there is no strict trade-off between the cost and the advantages of the replacement) and an arbitrary parameter that has its roots, one might say, in the notion of animal spirits.
In Dosi et al.‟s model, the final goods producer‟s entire stock of machines is compared, as just outlined above, to the new machine offered by the supplier. In our amended model, on the other hand, the comparison will be restricted to half of the final goods producer‟s machines, namely those that are least productive7.
3. A final goods producer‟s capital stock determines its production capacity.
Consequently, the „direct‟ productivity of any machine is unitary. However, the machines differ in the productivity A they confer on the workers. Consequently, a firm will invest in capacity when its anticipated order volume exceeds its production capacity, namely its capital stock . It should be noted that, since it takes its decisions in a situation of uncertainty as to its outlets, the firm will not invest until the missing capacity exceeds a certain threshold . The capital stock associated with this threshold will be written .
Thus in Dosi et al.‟s model, firm i‟s investment in capacity will be:
where
and
7 Our firm reviews only half of its capital goods for two reasons. Firstly, since, like Dosi et al., we take the view that the firm is not rational in its decisions on investing in capacity (cf. stage 3), there is no reason why it should behave rationally in its replacement decisions. Secondly, this choice of a limited review of the capital stock is justified for a technical reason, namely the faster calculating speed of computers. Of course, our model‟s behaviour is affected only at the margin: the GDP trend is slightly flatter when the firm replaces only half of its machines at most, but this does not alter any of our conclusions, and the behaviour of our other time series is not affected.
is the desired rate of use of the capital stock and the capital stock required to produce . In our amended model, is, by simplification, equal to 1.
represents the desired level of production. This is the anticipated order volume, plus the desired level of stocks. In our model, the desired stock level is zero and anticipated demand is adaptive, as in one of the scenarios considered by Dosi et al. (2006).
=
represents the volumes actually ordered from the firm in the previous period and is a positive number between 0 and 1 that determines the speed with which the firm adapts to changes in demand.
In our model, the rule governing firms‟ investment in capacity is slightly different from that in Dosi et al.‟s model, since we take the view that the firm acquires the entire capital stock it requires at the point at which the required capacity exceeds the target . Thus in our model, the investment rule is the following:
Investments in capacity and replacements are an order sent to the capital goods firm. This latter will require a certain period of time to complete the order and so the final goods producers will have to wait for the whole of that period of time before receiving their new machines.
4. The firms decide on the number of workers to hire. For a capital goods firm, the volume of labour sought is :
represents labour productivity in capital goods firms8. These firms operate on a just-in-time basis, hence the presence in the numerator of denoting the quantities of machines actually ordered.
For final goods producers, the volume of labour required is :
where is average labour productivity in the firm. If is the final goods producer‟s capital stock,
If and are the labour actually obtained by a capital goods firm and a final goods producer respectively, the volumes produced are given by the relations:
where is the output of the capital goods firms and that of the final goods producer.
5. The workers who are hired earn a wage, unlike those who are not working. This wage is used for consumption. In Dosi et al.‟s model, demand for consumption goods is defined on an aggregate basis by means of a dynamic replicator. Since we are planning subsequently (although not in the present paper) to model individual consumer behaviour with regard to pollution, we decided to model the individual consumer. This individual consumer selects a final goods producer i randomly in proportion to the latter‟s attractiveness .
8 It is not to be confused with , which is the labour productivity allowed by the capital good produced. The two productivity figures evolve concurrently when the firm innovates, but only will be affected by the use of intermediate services in the rest of the model.
is the market share of the final goods producer i in the preceding period, is a positive real number representing consumer sensitivity to this attractiveness and is the product price, such that:
The pricing rule adopted is the unit contribution margin (difference between sales revenue and variable costs). This pricing rule is frequently used in evolutionary vintage capital models (Ciarli et al., 2010). One of its advantages is that it prevents the wages paid being too low relative to the sales prices of the final products. However, the sale price does not take account of the capital stock, which is costly for the firm9. Thus in view of the regular expense incurred in making frequent purchases of new capital goods, firms record negative profits, in some cases for several consecutive periods. This is a particular weakness of this type of model. In order to counter this difficulty, we do as Dosi et al. do and allocate a significant volume of initial liquidity to the firms (see Annex 1).
For each consumer c, the quantities ordered are:
where is consumer c’s budget at time t. Let be the consumer‟s residual budget from the previous period. If the consumer/worker has managed to apply himself:
6. The machine tools are delivered.
9 A more conventional pricing method would have been based on average costs plus profit margin. This method takes account of the cost of the capital but, in view of the frequent purchases of machinery, the prices used in this method become inaccessible to consumers in evolutionary vintage capital models. This is why the contribution margin method is used in the pricing procedure.
7. Firms in the capital goods sector innovate. A capital goods firm that makes profits will use part of them (half by convention10) to finance its R&D activities. The firm innovates if the following condition is fulfilled:
RND is a random draw using a uniform law U(0 ;1), represents the R&D
expenditure of firm and is a scale parameter. If the condition is satisfied, then the firm has succeeded in developing a new prototype. However, this prototype may be more or less efficient relative to the current technology. In our model, the capital goods firm performs a new draw using a uniform law U(-0.5 ;0.5) in order to reassure itself about its prototype‟s level of performance. If the result is positive, the new prototype is retained and will be put into production in the following period. In this case, the new machine‟s productivity will be that of the old machine, supplemented by the result of the random draw. It will be noted that
, labour productivity in the capital goods firm, is also increased by the same amount.
8. The firms calculate their profits, which are added to their liquid assets.
The final goods producer i‟s profit in period t is written
is the volumes sold (they may be lower than those produced, in which case there will be an involuntary build-up of stocks )
is the capital volume actually received by the firm in period t. may be lower than the volume of capital goods ordered. In our version of the model, after all, the firm pays only for those machines it has received and, in contrast to Dosi et al., if a firm‟s order has not been completed in period t, the client firm may change supplier in the following period.
For capital goods firms, profits are written thus:
10
This share of profits committed to R&D is not realistic, it is true, but it does have the advantage of making the computer calculations quicker without fundamentally altering the model‟s behaviour.
where denotes the volumes of machines actually produced and sold.
9. Those firms whose liquid assets become negative are withdrawn from the market and immediately replaced by new ones, which are copies of one of the survivors. This implies that the number of firms in the model is constant. Again, this is a fairly strong but common hypothesis in evolutionary models (cf., among others, Dosi et al., 2006, 2008a and b; Ciarli et al., 2010; Lorentz and Savona, 2008).
2.1.2. Adding service sectors and incorporating the factors driving tertiarisation
Like most multi-sectoral growth models, the model described above consists solely of manufacturing industries, and the distinction between intermediate and final goods industries explicitly highlights the way in which the engine of industrial growth operates. In order to take account of the dynamic of service sector development, we propose, firstly, to add two sectors, namely the final and intermediate services sectors, and, secondly, to introduce three factors driving tertiarisation: productivity differential, the role of intermediate services and the evolution of consumer preferences.
The final services sector we are incorporating has the characteristics discussed by Baumol. This sector is stagnant, that is to say that the firms within it do not themselves generate any productivity gains, although they may benefit from productivity gains by making use of intermediate services. Services cannot be stocked and are consumed at the same time as they are produced. Consequently, production takes place on a just-in-time basis, but firms‟ production capacities remain limited nonetheless. In concrete terms, final services firm makes adaptive forecasts based on the demand directed at it (i.e. on the basis of its output). Thus a firm‟s demand for labour is given by :
where is the firm‟s labour productivity.
If is the volume of labour obtained, the final services firm‟s maximum output in period t is given by:
The price of the final service is given by:
We also incorporate into our model a knowledge-intensive intermediate services sector. This sector is also stagnant, but it has the specific characteristic of being able to induce productivity gains in the other sectors of the economy (final and intermediate goods, as well as final services). The production capacity of knowledge-intensive service firm is determined by the number of workers . Thus its production capacity is given by:
This unitary productivity is the basis for price formation in the sector‟s firms. If is the price of the knowledge-intensive services, we have:
Drawing in particular on Gallouj (2002), we regard the knowledge-intensive service firm as being defined by a level of knowledge . In each period, firms in the three other sectors choose a knowledge-intensive service provider at random. They then compare their own level of knowledge (H) with that of the chosen service provider. If they note the existence of a cognitive differential, thus if >1, then they enter into a transaction. This
transaction proceeds as follows11 :
- The client firm draws a number using a uniform law U( ; ). The result will indicate its new level of knowledge, which may, at most, equal the supplier‟s.
- This new level of knowledge may give rise to an increase in labour productivity in the client firm, by facilitating an organisational innovation, for example. Thus this firm will make a new draw using a uniform law U (-0.25 ; 0.25). The result, if positive, will increase labour productivity in the client firm by the number drawn. Although a negative result is unlikely in reality, the interval of possible values is defined by [-0.25 ; 0.25] since, in this way, the firm has a one in two chance that the innovation will not take place. After all, a draw using an interval [0 ; 0.25] would mean that virtually every draw would have a positive result. It should
11
Our knowledge accumulation process is similar to that for material capital, but brings into play a number of random events. A similar approach can be found in Baumol, Litan and Schramm (2007): “business firms‟ investment in knowledge creation is analogous to their investment in new equipment that promises to make employees more productive. But unlike investment in a new machine, which has more or less predictable productivity-enhancing consequences, investment in knowledge discovery is fraught with uncertainty” (p. 51).
also be noted that the effect of this innovation on the client firm‟s productivity is assumed to be weaker than that of the capital goods producers‟ product innovations; however, the organisational innovation has the advantage of being applicable to all firms in the economy. It should further be noted that the organisational innovation generated by this transaction makes it possible to increase internal productivity in the capital goods firms.
- This innovation will gradually make the replacement investment less attractive for final goods producers. The reason is that, if the organisational innovation is successful, labour productivity on the final goods producer‟s machines will rise12
, such that the condition for making the replacement investment will be increasingly seldom fulfilled. Consequently, we have constructed a mechanism capable of shifting the model‟s engine of growth towards the service sector (in fact making it less and less tangible) in a way that is totally endogenous.
- In each period, KIBS firms spend money on training for their staff. This expenditure is proportional to their revenue. If denotes the volume of services produced, the firm makes a draw using a uniform law U(0 ; 1) in order to ascertain whether this training actually increases its employees‟ knowledge. There will be an increase if:
where is the share of revenue invested in staff training. If the training is successful, the firm‟s knowledge will increase by the result of a new draw U(0 ; 0.5).
- The intermediate services firms hire their new staff at the end of each period. In view of the sums invested in staff training, when an individual is hired he or she remains hired. In other words, employees are hired for an indefinite period in the knowledge-intensive services sector. The corollary of this is that a hire becomes very risky and thus firms in the sector will hire at the most just one employee per period if there are employees without work (and therefore available) and if demand for their services has exceeded their production capacities by a sufficiently large margin. If denotes the threshold beyond which a new hire is sought and is the demand for the KIBS firm‟s services, then this firm will make an offer of employment if:
12 After all, all the productivities of the firm‟s machines are increased, such that the condition will be less frequently satisfied.
- Final services firms‟ entries and exits from the market obey the same rules as those set out above. A firm exits when its liquidity becomes negative and it is immediately replaced by a new firm that is a copy of one of the survivors. However, KIBS firms do not obey this rule since they quit the market when their market share becomes zero. The reason for this is that when a KIBS firm has not been selected during a particular period, it cannot innovate (its innovations are, after all, a function of its revenues). Consequently, it will never again be selected by a client because of the relative cognitive lag it displays.
- As far as final demand is concerned, a consumer‟s budget is distributed between goods and services in accordance with Engel‟s law. We assume that final goods, viewed in their entirety, are basic products, while final services are non-basic products. It is further assumed that services have always been a part of individuals‟ consumption behaviour and that goods will also always be a part of that behaviour. Because of these assumptions, Engel‟s (diachronic) law will take the form of a variable that obeys a logistical law and is used to decide on the sums allocated to the consumption of goods and services. If and are, respectively, the minimum and maximum share of the budget allocated to the consumption of services and is a scale parameter:
Thus the share of the budget allocated to the consumption of goods will be given by .
All things considered, these significant changes should mean that the model is able to generate growth in a wholly endogenous way, as well as a shift in demand and output towards service activities.
In presenting the variables that explain the development of the service sector, we paid particular attention to firms, and in particular to knowledge-intensive services. In his discussion of Baumol‟s model, Outlon (1999) formally demonstrates that these services are capable of producing perpetual growth. However, his model fails to go beyond an explanation for the growth of KIBS based on transaction costs. Our model, on the other hand, incorporates an explanation for their growth based on the cognitive differential between providers and customers (Gallouj, 2002). Furthermore, intermediate services in our model can generate productivity gains for their customers. We will see in section 3 that this view of intermediate services strongly influences the long-term meso and macroeconomic effects of an environmental policy. For the moment, in the absence of an environmental policy and in order to highlight the role of the business services sector, we will present the results of our simulations, firstly without and then with such a sector.
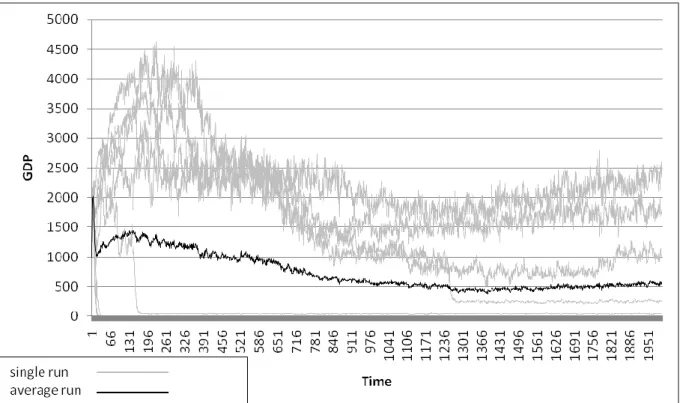
a) Simulations without business services
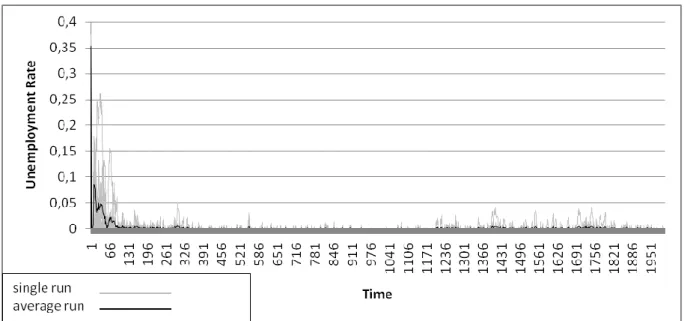
Figure 2: The unemployment rate series corresponding to the simulations in Figure 1.
In the scenario without business services, the GDP time series (Figure 1) are very erratic: in some of them long-term GDP tends towards zero whereas in others it is positive and stagnant or slightly increasing. Nevertheless, these time series all share one characteristic, namely that they have a (lengthy or sudden) phase of contraction. The unemployment rate (Figure 2) evolves accordingly, such that it increases strongly in all the stimulations to the point where it reaches an average asymptotic value of 90% of the economically active population.
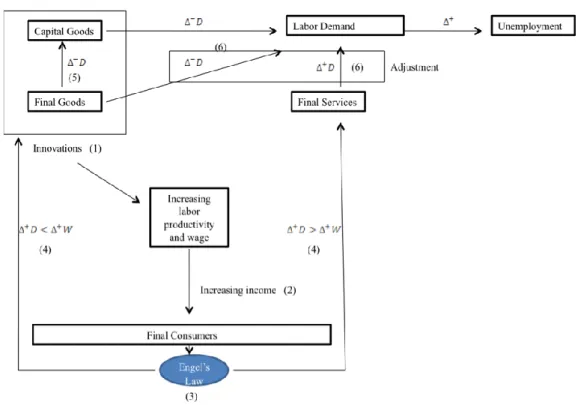
How can this contraction be explained, when the most pessimistic scenario, the one outlined by Baumol (1967), suggests that the level of GDP will stabilise and not decline? This contraction can be interpreted in two ways. Firstly, the level of aggregation is different from that in Baumol‟s model (1967), since in this scenario our model includes an intermediate goods sector but no intermediate services sector. Now since it manifests itself in a shift in household consumption away from final goods towards final services, Engel‟s law leads to the jobs lost in the consumer goods sector being replaced by jobs in the final services sector. However, Engel‟s law does not apply to the production sphere and thus the same does not apply to the jobs lost in the capital goods sector. In concrete terms, as final demand shifts towards services, producers of consumer goods order fewer capital goods, while the firms that produce them continue to make productivity gains. Consequently, they dismiss workers, which reduces overall demand and causes the economy to go into recession (Figure 3). The
second factor that explains the economic contraction is the fact that our model has no stabilising mechanism, except the stabilising role played by wages increase, which is indexed to productivity gains.
Figure 3 : Tertiarisation of final demand without business services: the advent of a vicious circl
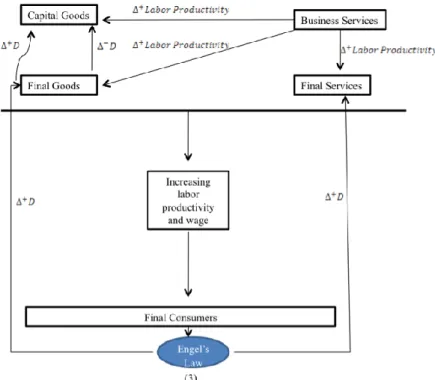
b) Simulations with knowledge-intensive business services
Thus the preceding scenario (without intermediate services) is far from being satisfactory, but it does provide an opportunity to envisage the mechanism by means of which intermediate services might potentially stabilise the GDP dynamic and avoid contraction. After all, intermediate services may be a source of new jobs for those workers made redundant by the capital goods sector. However, one necessary condition must be fulfilled. The loss of jobs in the capital goods sector and the creation of other jobs in the business services sector must coincide temporally. In the case of the labour shed by the final goods sector and its absorption by the final services sector, this coincidence is ensured by Engel‟s law, i.e. by the emergence of new needs among final consumers. In the second scenario, we use the hypothesis that knowledge-intensive services expand as a result of firms‟ need and demand for knowledge (Gallouj, 2002). The temporal coincidence arises out of the fact that
this knowledge can generate organisational innovations and hence productivity gains in the client firm, which in our model reduces that firm‟s incentive to replace its current capital goods. Consequently, this retroactive mechanism enables us to introduce the possibility of a temporal coincidence between reduced demand for capital goods and increased demand for business services. The logical consequence is that our time series should become more stable. The aim of this section will be to verify this intuition.
As Gallouj (2002) shows, knowledge-intensive business services are not only among the most innovative services but they also trigger innovations and productivity gains in their client firms. Consequently, in addition to their stabilising effect already alluded to above, these services also constitute a direct and indirect engine of growth. As we shall see, this engine of growth is initially additional to rather than a substitute for manufacturing industry as an engine of growth. From this point of view, our analysis is very close to that of Stanback (1979) and corroborates the argument put forward by Gadrey (2008, 2010) that a service economy continues to consume increasing amounts of goods.
Figure 5: The ten unemployment series corresponding to the previous GDP series
In the scenario with intermediate services, the GDP time series (Figure 4) produced by our simulations are much more stable and homogeneous than in the scenario without business services. The unemployment series (Figure 5) evolve accordingly and describe an economy permanently very close to full employment. Underlying these macroeconomic dynamics is a very pronounced transfer of labour towards the service sector (Figure 6), which implies that the business services sector has compensated for the loss of jobs in the capital goods sector. After all, as Figure 7 shows, the trend towards the tertiarisation of intermediate production runs parallel to that towards the tertiarisation of final production. In contrast to the speed with which final production becomes tertiarised, however, the tertiarisation of intermediate production is a much slower process13, reflecting a long period of complementarity between capital goods and production services.
13 As can be seen, the level of employment in the capital goods sector has still not finished declining at the end of the 2000 periods of our simulations, while in the KIBS sector it is continuing to rise. In final production, on the other hand, employment stabilises quickly.
Figure 6 : Tertiarisation of jobs in the ten simulations.
Figure 7 : Decomposition of the sectoral distribution of jobs
The slowness of the shift towards the service sector in intermediate production can be explained by two retroactive loops that have conflicting effects on the demand for capital goods. Firstly, the replacements of capital goods are reduced by the productivity gains achieved through the use of intermediate services (see footnote 12). Secondly, the productivity gains made possible by intermediate services have the advantage of being applicable to all sectors of our simulated economy. Consequently, the growth in these services
is able to sustain the growth of macroeconomic productivity gains (Figure 8), and hence that of wages and final demand, which ultimately sustains final goods producers‟ investments in extra capacity.14
Figure 8: Evolution of overall productivity over time
To conclude, intermediate services have a direct effect, in that they reduce the demand for capital goods, and an indirect effect, which is mediated through their influence on macroeconomic productivity gains and wage levels, which sustains the demand for these goods. This is what explains the slow pace of the shift towards the service sector in intermediate production (see figure 9). At the same time, the effect of business services on productivity gains enables the trend in GDP growth to remain steady even when the majority of jobs are concentrated in the service sector. It should be pointed out, however, that this increasing tertiarisation of productive systems does not imply any decrease in the production
14
A significant limitation of our model becomes apparent here: the growth in the demand for capital goods cannot be fully met because the economically active population is assumed to remain constant. However, the labour shortage is not very great, as the relatively weak increases in unemployment in Figure 5 suggest. This observation also reveals the potentially explosive nature of service-sector expansion based on intermediate services. Moreover, it is closely akin to Outlon‟s conclusion that the GDP growth rate is an increasing function of the share of intermediate services in total employment, although it offers a different way of explaining it. For Outlon, the impact of intermediate services on GDP growth was, after all, a purely accounting phenomenon, whereas here it arises out of the fact that the productivity gains made possible by the consultancy services can be applied to the economy as a whole and not just to manufacturing firms. It should also be pointed out that, while the trend towards an acceleration of growth is not actually observed in real economies, this is also because the final services sector is very heterogeneous and not all the actors in it (local community-based services particularly) make use of consultancy services, which is not the case in our simulated economy.
of goods (Figure 10). This observation is in line with that of Gadrey (2008, 2010) and may give rise to environmental problems.
Figure 9: The two contradictory effects of business services on capital goods demand
3. The service economy and environmental policy
For Gadrey (2008, 2010), service economies are also environmentally damaging, firstly because they are characterised by the increasing production and consumption of goods (see Figure 10) and secondly because the production of services is itself polluting. This pollution is linked to the material environment required for the service relationship (buildings, computer equipment etc.) and also to the interactive nature of that relationship, which often requires service providers and their customers to be in the same place, and hence the use of some means of transport or another.
In order to counter this environmental damage, Gadrey (2008, 2010) proposes that the emissions of both manufacturing and service firms should be heavily taxed. The origin of the pollution generated by service industries means they are more restricted in their ability to adapt to such a tax than their counterparts in manufacturing. After all, if the tax is sufficiently high, manufacturing firms may find it more profitable to switch to more labour-intensive and less polluting production processes15. Service firms, on the other hand, which are already highly labour-intensive, will not be able to make such a switch. It would in any event be of little use since it is the interactive aspect of the service relationship that is the cause of the pollution. Consequently, the tax will lead to increases in the cost of providing services, and hence in their price to consumers. This increase will automatically reduce the volume of demand for services, which ought to free up labour that might once again find employment in manufacturing. Thus according to Gadrey (2008, 2010), the environmental tax will trigger a process of contraction, in both the economy as a whole and the service sector in particular.
Our intuition is that the addition of an intermediate services sector should cause this argument to be amended. After all, if it is these intermediate services that are sustaining economic growth in a service economy, then it might reasonably be assumed that forgoing the productivity gains in the capital goods sector will not necessarily have any great effect on the rate of macroeconomic productivity gains. We further hypothesise that the organisational innovations made possible by the intermediate services are only weakly polluting, which may provide a basis for reconciling a reduction in pollution with continued economic growth. In the following section, our model is amended to incorporate an environmental dimension.
15
This argument (which appears in Gadrey, 2008, 2010) presupposes that the labour productivity gain from mechanisation is negatively correlated with environmental productivity.
3.1 The model with an environmental dimension
We propose introducing environmental policy into our growth model in the shape of a Pigouvian tax on greenhouse gas emissions (GES). In order to observe the effects of this tax on macro and meso-economic dynamics, the following elements are added to the model:
- Capital goods are now described in terms of two forms of productivity: labour productivity A and environmental productivity B. Let be the quantity produced by a final goods firm; its emission level will be given by:
is the firm‟s environmental productivity. This productivity is calculated on the basis of the average of the environmental productivities of the firm‟s k machines:
The environmental productivity of a firm that produces capital goods is merged with that of the machine put up for sale. Thus the level of emissions for a producer
is given by:
Given that the interactive aspect of service activities is a source of pollution (Gadrey, 2008), a (final or intermediate) service firm‟s emission level can be considered proportional to the number of customers .
is a positive real number. In our simulations, it is less than unity. This choice is obviously arbitrary, as is the decision to opt for a linear relationship between the level of pollution and the number of customers. However, as we are advancing the (simplifying) hypothesis that service firms do not engage in environmental innovation, this choice does not really have any effect on the model‟s macroeconomic dynamic.
- The unitary tax T is assumed to be such that . It represents the price to be paid in compensation for the emission of one unit of greenhouse gas. If is the amount of environmental taxes to be paid by a firm i, we have:
- These taxes will be added to firms‟ costs. Firms will, therefore, pass these new costs on in their sales prices.
For a capital goods firm, the price becomes:
D is a dummy variable that has the value 0 when there is no tax and the value 1
when the tax is applied. This is a convenient way of showing the effect of the introduction of a tax on firms‟ behaviour in the course of the simulation. By analogy, the final goods firms‟ new price will be:
In the case of (final and intermediate) service firms, the sale price becomes:
where is the expected volume of services produced by the firm. The presence of , the level of pollution, means the service firm makes short-sighted forecasts of the number of customers it will have in period t. On the other hand, the forecasts of volumes to be produced are always made on the basis of adaptive forecasts. This difference of approach can be
explained by the fact that, in the model, customer numbers are less volatile than the volumes of services ordered.
- The rule governing decisions on replacing a machine will also be affected. Thus a machine k will from now on be replaced by one from supplier when:
- Capital goods suppliers‟ competitiveness index will also be altered by the introduction of a tax. In other words, once the tax is in force, final goods producers will also have to put a value on their machines‟ environmental productivity. The new index will be written thus:
- As far as the capital goods producers‟ innovation behaviour is concerned, an ideal scenario is assumed in which the firm is able to change its innovation trajectory when the tax is introduced. In concrete terms, prior to the tax, the firm innovates but is little concerned with the effect of the innovation on its machine‟s environmental productivity. Thus when the firm has adopted a new prototype, a new draw using a uniform law U(-0.5 ;0.5) is carried out. The result is added to the former environmental productivity , whether it is positive or negative16. After the tax is introduced, however, the firm reverses its priorities. Thus a prototype machine will be adopted if its environmental productivity is greater than that of the machine currently on sale, regardless of the evolution of labour productivity. This hypothesis of a change of innovation trajectory has been adopted in order to provide an analytical framework that is close to the scenario addressed by Gadrey (2008).
- Consumer preferences are not altered by environmental taxes, for several reasons: (1) Since firms add the tax in full to their sale prices, consumers will already be suffering a reduction in their purchasing power, particularly as far as service industries are concerned, for which the model does not provide any opportunities for environmental innovations.
16Thus we are assuming that there is a non-linear relationship between the environmental productivity of capital
goods and the productivity that these capital goods confer on labour. Such a relationship can be justified by the literature on environmental Kuznets curves (Panayotou, 2000).
(2) It is assumed in the model that all firms that are able to do so will introduce environmental innovations. In other words, final consumer preferences would neither slow down nor accelerate the environmental innovations if they existed.
(3) We are concerned with growth and structural change; policies directed at consumers (labels etc.) serve merely to influence choices between identical or substitutable products (Valente and Bleda, 2009, for example) and not between goods and services, which are known to be complementary (Stanback, 1979).
3.2 The results of the simulation
Given that developed economies are service economies, the tax comes into effect from period 500 onwards, i.e. once the shift in employment towards the service sector is complete. The effect of four levels of tax on GDP is illustrated in Figure 11.
Figure 11: Sensitivity of GDP to the level of the Pigouvian tax
The higher the rate of tax, the deeper the initial recession will be. This phenomenon is explained by the immediate increase in the price paid by consumers. The higher the rate of tax, the greater the decline in real incomes and, consequently, in consumer demand, which causes a sharper decline in production when the tax level is high. However, it is not the contraction scenario that emerges in the long term. All the scenarios are, after all,
characterised by a resumption of growth, although the trend is changed compared to the scenario without the tax. The slowdown in the GDP growth trajectory is explained by a certain uncoupling of the growth trend from overall productivity, due to the stagnation of the labour productivity of capital goods (Figure 14). Nevertheless, the trend remains positive by virtue of the effect of knowledge-intensive services on overall productivity. In parallel with the evolution of GDP, the unemployment rate (Figure 12) rises sharply but eventually returns to its pre-tax level as growth resumes.
Figure 13a: Effect of the 5 Euro tax on the sectoral distribution of jobs between the major aggregated sectors
Figure 13b: Effect of the 5 Euro tax on the sectoral distribution of jobs
In order to explain this resumption of growth, we focus on the evolution of the sectoral distribution of jobs. At first sight (Figure 13a), nothing has really changed. However, at a
more detailed level of analysis (Figure 13b), the situations are more contrasting, with a shift in employment from final to intermediate services.
The first thing to note is that it is the final products sectors (both goods and services) that have been affected by the tax. This reflects the effect of the price increase on final demand. The intermediate sectors, on the other hand, saw a growth in employment levels at the time the tax was introduced. We have, after all, been considering a scenario tending towards the ideal, in which the environmental tax is accompanied by a change in technological trajectory for manufacturing firms. Thus final goods producers exchange their old polluting machines en masse for cleaner machines, giving rise to the cyclical increase in employment in the capital goods sector. Employment in this sector ultimately fares a little better in the medium term than in the scenario without tax (Figure 7), since intermediate services have a little less influence on final goods producers‟ replacement investment decisions (in our model, our hypothesis is that these services have no effect on the machines‟ environmental productivity).
In the case of intermediate services, the growth in employment levels can be explained by two factors. Firstly, firms‟ demand for these services depends more on strategic considerations (knowledge differential) than on price considerations. It could be said that, as the regulatory environment changes, the increasing demand for knowledge-intensive services can be justified by the need to adapt that firms may experience. Secondly, the employment growth also stems from KIBS providers‟ reluctance to dismiss their employees. After all, as Gallouj (2002) notes, retention of their workforce is a necessary condition of their survival17. Running parallel to these shifts in the distribution of employment that help partially to sustain final demand, the change in capital goods producers‟ technological trajectory, which causes their machines‟ labour productivity to stagnate, gives rise to only a slight fall in the macroeconomic productivity growth rate (Figure 14). This phenomenon can be explained by the organisational innovations brought about by intermediate services.
17 Gallouj (2002) notes in this regard that „the organizational memory of KIBS firms is heavily dependent on the loyalty of its staff. The loss of certain members of staff produces an effect akin to amnesia or a cognitive haemorrhage‟ (p.274).
Figure 14: Macroeconomic productivity and average labour productivity made possible by capital goods in the 5 Euros tax scenario
This increase in macroeconomic productivity leads to a rise in wages, and thus also in demand, which helps gradually to lift the GDP growth trend. For all that, however, is this growth cleaner? Figure 15 shows that the answer is a positive one.