Atomic structure calculations and beam-foil
observations of La IV
E´ mile Bie´mont, Mathieu Clar, Saturnin Yoca Enzonga, Vanessa Fivet, Pascal Quinet, Elmar Tra¨bert, and Henri-Pierre Garnir
Abstract: Relativistic Hartree–Fock and multiconfigurational Dirac–Fock calculations of atomic structure and transition rates have been carried out in trebly ionized lanthanum (La3+, Z = 57). The calculations have to cope with configuration
interaction effects but also with the very complex situation of the collapse of the 4f wave function. The calculations are compared to experimental data obtained with beam-foil spectroscopy in the extreme ultraviolet, at ion energies that favour the production of the spectrum La IV. Besides lines known from sliding spark discharges, many more lines are observed that have not yet been identified. Time-resolved measurements yield three level lifetimes in La IV that agree roughly with the results of our own calculations.
PACS Nos: 32.30.Jc, 32.70.Cs, 34.50.Fa, 31.15.ag, 31.15.xr
Re´sume´ : Des calculs Hartree–Fock relativistes de structures atomiques et de taux de transition et des calculs a` l’aide de l’approche multiconfigurationnelle de Dirac–Fock ont e´te´ effectue´s dans le lanthane trois fois ionise´ (La3+, Z = 57). Ces
calculs doivent prendre en compte l’interaction de configuration mais aussi la situation tre`s complexe associe´e a` la contraction de l’orbitale 4f. Les calculs ont e´te´ compare´s aux donne´es expe´rimentales obtenues a` l’aide de la spectroscopie faisceau-lame dans l’ultraviolet lointain a` des e´nergies qui favorisent l’e´mission du spectre de La IV. Outre les raies spec-trales connues a` partir des spectres d’e´tincelles glissantes, beaucoup de raies supple´mentaires ont e´te´ observe´es qui n’ont pas encore e´te´ identifie´es. Les mesures re´solues dans le temps ont permis d’obtenir trois dure´es de vie dans La IV qui sont en accord satisfaisant avec les re´sultats de nos calculs.
[Traduit par la Re´daction]
1. Introduction
The spectra of moderately ionized lanthanides are of con-siderable interest in several fields of physics, including quantum information, lighting industry, laser materials, and stellar physics [1–5]. Our knowledge of these spectra is still very fragmentary. Recently, there has been a revival in the interest in trebly ionized lanthanides, and several spectral analyses have been completed on the basis of VUV high-resolution observations. Among the spectra considered, let us mention, e.g., Nd IV [6, 7] and Tm IV [8]. Observations of inner-shell excited configurations in triply ionized cerium
Ce3+ have also been reported very recently by Reader and
Wyart [9]. Theoretical investigations of 4fN ground-state
configurations have been carried out in Nd IV and Pr IV [10].
Investigations of radiative properties of triply ionized lan-thanides so far appear to have been limited to Ce IV [11– 15], Pr IV [16, 17], Nd IV, Pm IV, Sm IV, Eu IV, Gd IV [18], Yb IV [19], and Lu IV [20, 21].
In astrophysics, the intensities of (mostly) ground-state transitions, based on oscillator strength data, are interpreted in terms of elemental abundances. Abundance measurements of rare earth elements are also needed for constraining cal-culations of nucleosynthesis (for references and most recent work, see [22–26]). The stellar spectra are generally domi-nated by neutral atoms and by ions in low charge states. The occurrence of doubly ionized rare earth spectra has been discussed in CP star environments (e.g., [27, 28]). Ac-cording to the ionization equilibrium defined by the Saha equation, lines of trebly ionized lanthanides are also ex-pected to appear in hot star spectra, but, because of a lack of atomic data, they have not yet been recognized and inves-tigated.
Laboratory observations of the spectra of such rare earth ions have achieved high wavelength resolution and accuracy (e.g., [29–33]). However, with classical light sources such as a sliding spark, the observations have been limited to the re-cording of time-integrated spectra. Recent additions to the databases on rare earth ions in low charge states have been achieved by laser excitation (time-resolved laser-induced Received 25 September 2009. Accepted 10 November 2009.
Published on the NRC Research Press Web site at cjp.nrc.ca on 14 January 2010.
E´ . Bie´mont, V. Fivet, and P. Quinet. Institut de Physique Nucle´aire, Atomique et de Spectroscopie (IPNAS), Universite´ de Lie`ge, B-4000 Lie`ge, Belgium; Astrophysique et Spectroscopie (ASPECT), Universite´ de Mons, B-7000 Mons, Belgium. M. Clar and H. Garnir. Institut de Physique Nucle´aire, Atomique et de Spectroscopie (IPNAS), Universite´ de Lie`ge, B-4000 Lie`ge, Belgium.
S.Y. Enzonga. Institut de Physique Nucle´aire, Atomique et de Spectroscopie (IPNAS), Universite´ de Lie`ge, B-4000 Lie`ge, Belgium; CEPAMOQ, Faculty of Sciences, University of Douala, P.O. Box 8580, Douala, Cameroon.
E. Tra¨bert.1Astronomisches Institut, Fakulta¨t fu¨r Physik und Astronomie, Ruhr-Universita¨t Bochum, D-44780 Bochum, Germany.
fluorescence spectroscopy) at Lund (e.g., [27, 34–39]). There also are several lifetime measurements on electric-dipole forbidden transitions (M1, E2) in singly charged ions circulating in a storage ring [40, 41].
In the present work, we are working towards a calcula-tional description of rare earth ions in the next few higher charge states and an understanding of the spectra that in-cludes transition probabilities, with energy benchmarks mostly from the older studies and with time-resolved spectra and lifetime information obtained by beam-foil spectroscopy (BFS) (for references on the technique, see [42]). BFS is a versatile technique that reaches all charge states of all ele-ments, and is presently the only practical technique to meas-ure excited level lifetimes in the picosecond to nanosecond range in an ion such as La3+ (Xe-like). The complexity of
this atomic system turns out to challenge both measurement and calculation.
2. Calculations in La IV 2.1. Available data
La3+ belongs to the xenon isoelectronic sequence. Its
ground state is 5p6 1S
0 and the observed excited
configura-tions are of the type 5p5nl. The major difference, however,
between the electronic structure of La IV and that of Xe I results from the fact that the 5p54f configuration in La IV is
much lower in energy than that of Xe I, and consequently, becomes the first excited configuration. (For an early treat-ment of this problem, see [43].) This is due basically to a collapse of the 4f orbital, which appears mostly in lantha-num.
As mentioned earlier, the first investigations of the spec-trum of La IV are due to Epstein and Reader [33], who ob-served 368 lines in a spectral range extending from 300 to 5000 A˚ . They were able to determine 17 even and 32 odd levels giving rise to 190 transitions. All the levels of the 5p6, 5p55d, 5p56s, 5p56d, and 5p57s configurations and half
of those of the 5p54f configuration were classified. These
levels have been used in our calculations as is discussed in the next subsection.
2.2. Results obtained through the relativistic Hartree– Fock approximation
Calculations of atomic structures in trebly ionized lantha-nides, and in La IV more specifically, are very challenging. They are expected to be simpler than in neutral or singly ionized elements of the same group, mostly because the con-figurations appear energetically more widely separated.
However, we must face the problem of the collapse of the f orbitals, which is not easily described in a realistic way. This collapse has been described previously (e.g., [24]). It is clearly visible in La along the Cs isoelectronic sequence (see Fig. 3 of [24]) and appears stronger and stronger in the lanthanide group when the number of electrons is increasing in the 4f shell (see Fig. 4 of [24]). Another characteristic, which limits strongly the calculations in the lanthanide spec-tra, is the huge number of levels arising from the 4fN
config-urations, which leads to very large energy matrices and imposes a drastic limitation to the number of configurations one is able to introduce in the CI expansions. One has thus to adopt permanently a compromise between the accuracy of the calculations and the tractable dimensions of the problem. In the present work, two physical models were considered in the framework of the relativistic Hartree–Fock (HFR) ap-proximation modified for the inclusion of core-polarization (CP) effects [44, 45].
The first model, designated as HFR+CP(A), includes the following configurations: 5s25p6, 5s25p56p, 5s25p57p,
5s25p54f, 5s25p44f2, 5s25p45d2, 5s5p65d, 5s5p66s, 5s5p54f5d
(even parity) and 5s25p55d, 5s25p56d, 5s25p56s, 5s25p57s,
5s25p44f5d, 5s25p45d6p, 5s25p45d7p, 5s25p46s6p, 5s25p35d3,
5s5p64f, 5s5p66p, 5s5p54f2, and 5s5p55d2 (odd parity). CP
effects were considered through a pseudopotential in the Hartree–Fock equations and through a correction to the di-pole moment operator. The adopted electric didi-pole polariz-ability corresponds to a La11+ ionic core, i.e., a
d = 0.47 a03
[46]. The cut-off radius has been chosen as the mean HFR radius of the 4d orbital, i.e., rc= 0.76 a0.
A least-squares fit procedure of the Slater and spin-orbit integrals was applied to the configurations observed experi-mentally. This procedure aims at improving the agreement between the experimental and the calculated energy levels. The adjusted parameters are the mean energy of the config-uration (Eavg), the Slater integrals for direct (Fk) and
ex-change (Gk) electrostatic interaction, and the spin-orbit
integrals (znl). For the configurations that are not
experimen-tally known, Slater integrals were multiplied by a scaling factor (0.85), as suggested by Cowan [44], but the spin-orbit integrals were kept at their ab initio values. All the levels published by Epstein and Reader [33] were introduced into the fitting procedure. The agreement between experimental and theoretical energy levels was excellent, the mean devia-tion amounting to 164 cm–1 for the even parity and to
173 cm–1 for the odd parity levels.
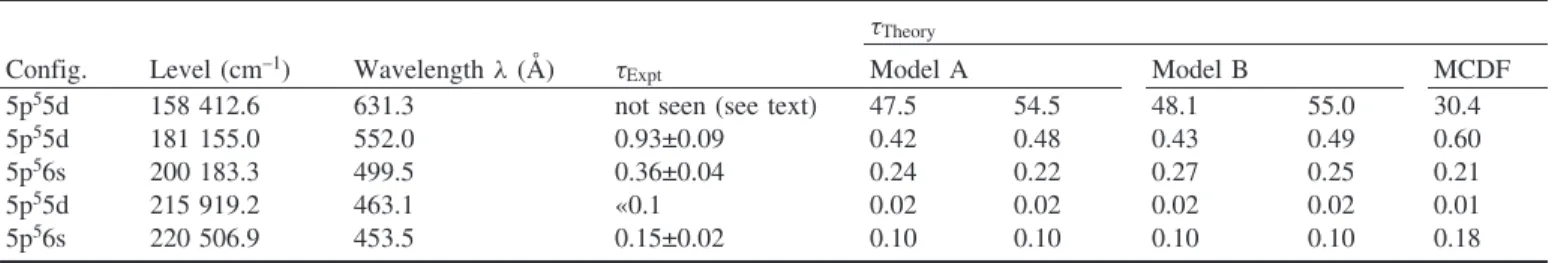
Table 1. Results of our lifetime measurements and comparison with theoretical (HFR+CP) and MCDF lifetimes t (all in ns) for levels belonging to the 5p55d and 5p56s configurations (J = 1). The level energies are from Epstein and Reader [33]. For the two (HFR+CP)
models A and B, the two results quoted have been calculated without (left column) and with (right column) core-polarization effects in-cluded. For the details of the various models, see the text.
tTheory
Config. Level (cm–1) Wavelength l (A˚ ) t
Expt Model A Model B MCDF
5p55d 158 412.6 631.3 not seen (see text) 47.5 54.5 48.1 55.0 30.4
5p55d 181 155.0 552.0 0.93±0.09 0.42 0.48 0.43 0.49 0.60
5p56s 200 183.3 499.5 0.36±0.04 0.24 0.22 0.27 0.25 0.21
5p55d 215 919.2 463.1 «0.1 0.02 0.02 0.02 0.02 0.01
Table 1 shows a comparison between the theoretical life-time values obtained with the HFR+CP(A) model and the experimental beam-foil results described in the next section. We observe that the experimental values are systematically longer than the theoretical results. This could eventually be explained by insufficient valence correlation introduced in the theoretical model.
To verify this assumption, a second model HFR+CP(B) was developed in which we have tried to increase the va-lence interactions not considered in the above description. We have added to HFR+CP(A) the configurations: 5s25p55f,
5s25p46s2, 5s25p46p2, 5s25p44f6p, 5s25p45d6s, 5s25p45d7s,
5s25p45d6d, 5s25p45d7d (even parity) and 5s25p57d,
5s25p44f6d, 5s25p44f6s, 5s25p46p6d, 5s25p46p7s (odd parity).
We kept a model potential with a La11+ionic core, identical
to the one described above. A similar fit procedure was adopted in which the same parameters as in model A were allowed to vary. The standard deviation of the fit was 132 cm–1for the even parity and 176 cm–1for the odd parity
levels. The lifetime results are reported in Table 1. We see from this table that the lifetimes obtained with the HFR+CP(B) model agree quite well with the results gener-ated by the model HFR+CP(A). However, in both cases, a substantial disagreement is observed when comparing with the beam-foil lifetime results (see hereafter). The discrep-ancy reaches about 50% of the beam-foil result for the 181 155.0 cm–1level and about 30% for the 200 183.3 cm–1
and 220 506.3 cm–1levels. Interestingly, the ratios of the
ex-perimental and theoretical lifetimes of the two 6s levels are almost the same.
2.3. Dirac–Fock approximation results
The HFR lifetimes have been compared with other theo-retical results obtained with a completely independent ap-proach, i.e., the multiconfiguration Dirac–Fock (MCDF) approximation using the GRASP0 (general purpose relativis-tic atomic structure package) code developed by Norrington after the original work by Grant et al. [47–49]. The calcula-tions have been carried out with the EAL (extended average level) option, which optimizes a weighted trace of the Ham-iltonian, the weighting factor being proportional to 2J + 1.
Our MCDF approach included 15 nonrelativistic configu-rations: 5s25p6, 5s25p56p, 5s25p54f, 5s25p44f2, 5s25p46p2,
5s5p65d, 5s5p66s (even parity) and 5s25p55d, 5s25p56d,
5s25p56s, 5s25p57s, 5s25p45d6p, 5s25p46s6p, 5s5p64f,
5s5p66p (odd parity). The number of configurations is
smaller than that used in our large HFR+CP(B) calculations. Our present computer resources were not suitable for a much larger computation.
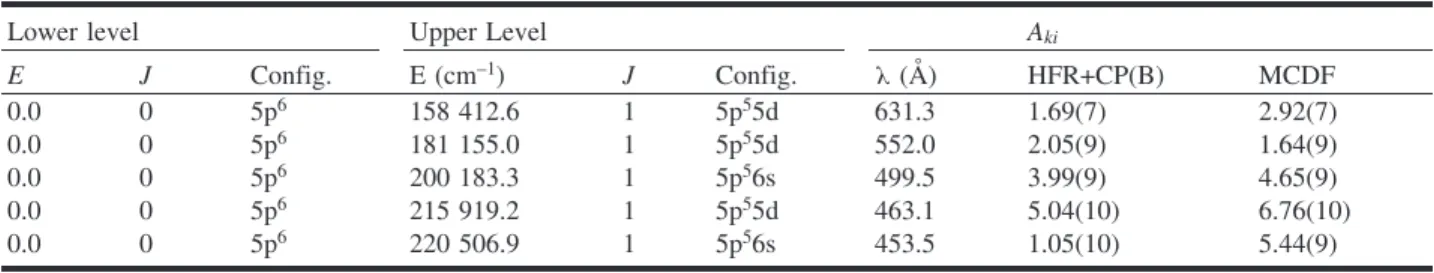
In Table 2, we report the transition probabilities obtained with MCDF for the 5p6-5p55d and 5p6-5p56s spectral lines.
The transition probabilities, obtained in the Babushkin (length) gauge, have been corrected using the experimental wavelengths. The agreement between Babushkin and Cou-lomb (velocity) gauges was found good (in most cases within 10%). The MCDF results compare reasonably well with the HFR+CP(B) data (within a factor of two), except for the transition at 453.5 A˚ , which relates to one of the 6s levels. Table 1 shows a comparison between the MCDF, HFR, and beam-foil lifetime results (see hereafter) obtained in the present work.
3. Measurements
3.1. Main characteristics of the BFS experiment
The BFS experiment employed a 2 MV van de Graaff heavy ion accelerator at IPNAS (Universite´ de Lie`ge). The exit channel (cylindrical with a conical entrance section) of a radiofrequency ion source (operated with a mixture of about equal amounts of oxygen and argon gas [50]) was drilled in a lanthanum rod so that sputtered material could be formed into a beam of singly charged La ions.
Light emitted by the 6 mm diameter ion beam, after strip-ping and excitation in a thin (areal density 20 mg/cm2)
car-bon foil, was observed at right angles by an R = 1 m Seya-Namioka spectrometer equipped with a Pt coated 1200 lines/ mm diffraction grating. The 0.1 mm wide entrance slit of the spectrometer was situated 10 mm from the ion beam axis. The focal plane image was projected directly onto a cryogenically cooled Osprey CCD camera system. The 1040 pixel columns of the CCD detector used in combina-tion with the spectrometer dispersion of about 0.2 A˚ per channel allowed to observe a spectral section of about 200 A˚ width at each spectrometer setting. Overall, spectra were recorded to cover the wavelength range from about 400 to 860 A˚ with a wavelength resolution slightly better than 1 A˚ , at three ion beam energies (0.7, 1.3, and 1.7 MeV). Based on experience with Xe (Z = 54) ions [51], an ion beam energy of 0.7 MeV was expected to be optimal for the production of La3+ ions (
57 139
La). Indeed, the La IV lines showed most brightly at this ion beam energy setting, whereas La V was more prominent at the higher ion beam energies. The present paper focuses on a discussion of the La IV spectrum and properties.
A beam of 0.7 MeV La ions experiences an energy loss in the foil of about 80 keV, reducing the ion velocity to 0.93 mm/ns. To record decay curves, the foil was displaced along the beam axis by up to 7.25 mm upstream from the field of view of the spectrometer, corresponding to a time Table 2. Comparison between HFR and MCDF transition probabilities Aki(in s–1) for 5p6-5p55d and 5p6-5p56s transitions.
Lower level Upper Level Aki
E J Config. E (cm–1) J Config. l(A˚ ) HFR+CP(B) MCDF 0.0 0 5p6 158 412.6 1 5p55d 631.3 1.69(7) 2.92(7) 0.0 0 5p6 181 155.0 1 5p55d 552.0 2.05(9) 1.64(9) 0.0 0 5p6 200 183.3 1 5p56s 499.5 3.99(9) 4.65(9) 0.0 0 5p6 215 919.2 1 5p55d 463.1 5.04(10) 6.76(10) 0.0 0 5p6 220 506.9 1 5p56s 453.5 1.05(10) 5.44(9)
after excitation of up to about 7 ns. The beam current was about 100 nA. At each position, the light measurements were normalized to a fixed ion beam flux entering the elec-trically isolated excitation chamber, which acted as a Fara-day cup, and thus small variations of the ion beam intensity could be corrected for. The basic layout of the beam-foil measurement system has been reported earlier [52].
The spectrometer was roughly calibrated in wavelength setting and coverage by earlier observations. However, beam-foil spectroscopy is known to be mono-isotopic, and therefore in-beam reference lines can come only from La spectra. Epstein and Reader [32, 33] present lines and rela-tive intensities based on their observations of sliding spark spectra. Although their strongest lines (La IV 5p6 1S
0-5p5 nl
transitions) were recognized in our spectra and served as an-chors of the wavelength scale, the relative line intensities in our beam-foil spectra turned out very different from theirs. This is probably a result of the different excitation process (low-density vacuum spark vs. high-density environment in the carbon foil) and the time-resolved observation in our work (vs. time-integrated spectra in theirs). The appearance of the spectra is also affected by the wavelength-dependent detection efficiency of CCD cameras, which is relatively low in the wavelength range near and above 800 A˚ [53]. However, even at a low detection efficiency, our simultane-ous recording of a spectral section is a major asset, because several spectral lines can be studied simultaneously, and the (often time-dependent) influence of blends and of spectral background contributions can be recognized.
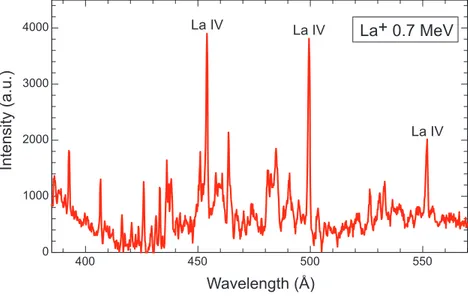
A sample of the spectrum registered at 0.7 MeV is shown in Fig. 1, in which three prominent lines of La IV are marked. The line intensities show the same trend when vary-ing the charge state distribution by changvary-ing the ion beam energy and are consistent with their identification by Epstein and Reader [33]. Most of the prominent lines given by Ep-stein and Reader in the wavelength range of present interest arise from the decay of levels with a lifetime of the order of 1 ns and less. Their prominent 631 A˚ line was not seen here at all (not even at a distance from the foil and with extended exposure times); the upper level of this intercombination transition has an estimated lifetime near 50 ns, and therefore in time-resolved measurements like ours, the signal rate of this transition may well be two orders of magnitude lower than is typical for the other lines.
Another problem affecting our spectra is the rather low spectral resolution. Our spectral feature lines are about 5 channels wide [full width at half maximum (FWHM) 1 A˚ ]. At this resolution, we find many lines to be blended. If the blending lines are generic to beam-foil excitation (where usually many more lines are observed than in lower-density light sources), then the lines most likely arise from core-cited or multiply excore-cited ions for which no calculations ex-ist. At our resolution, several of the known lines of La IV and La V are also blended with each other, the latter transi-tions appearing generally weaker than the former ones at the ion beam energies chosen for the present analysis.
3.2. Atomic lifetime measurements
Because of the constant velocity of the ions leaving the excitation foil, observations of the ion beam at different dis-tances from the foil relate to observations at proportionally
different, but specific times after excitation. For up to 34 spectra recorded at a given wavelength setting but at differ-ent foil positions corresponding to ion flight times of up to 7 ns away from the foil, decay curves were constructed from the line amplitudes obtained by multi-line fitting to the spec-tral features in each CCD spectrum. This procedure is prac-tical only with a multichannel detector, and it is superior because it deals effectively with background contributions that either depend on spectral position or time after excita-tion, or both. A sample decay curve is shown in Fig. 2.
Beam-foil excitation is non-selective; this results in the production of a range of ion charge states (the spectra of neighbouring ions often overlap each other) and in the exci-tation of a plethora of individually weak spectral lines that arise from the multitude of excited levels. The exciter foil suffers damage by ion irradiation. In our experiment, the foils usually lasted for about one hour each. In this situation, the use of a CCD camera represents a major improvement over spectral scanning techniques and assures both better data accumulation (counting statistics) and constancy of conditions across a spectral range. Figure 3 shows how the spectral background shape varies across a spectrum; it also varies with the energy of the ion beam, because much of the perceived background actually results from line blends (the composition of which change with the charge state dis-tribution). Moreover, these background line blends vary with the time after excitation (distance of the ions from the ex-citer foil); the blends are most severe near the foil, whereas downstream of the exciter foil whole line clusters disappear. Much higher spectral resolution than is presently available would be needed to disentangle these blends. Consequently, we present decay data for only the few dominant lines in our spectra.
There also are problems that are specific to the evaluation of decay curves. Among these are the mathematical difficul-ties of nonlinear fits and the imperfect means of distinguish-ing in many cases whether a decay curve represents a sdistinguish-ingle exponential (plus background) or two or more decay compo-nents. In our study, the data points used for the construction of decay curves are the results of fits to line profiles in spec-tra, and the background is taken care of at that process step. The actual decay curve analysis then uses two exponentials only (three were tried, but failed to yield stable results) and takes the finite width of the field of view of the detection system into account. Figure 2 shows a typical example; the decay curves of the three lines shown in Fig. 1 are fitted easily by a dominant fast and a weaker slow component, representing a distinct primary decay component and a clearly different cascade tail. Attempts at adding more com-ponents did not return stable results. Our data yield apparent lifetimes for these three levels that carry (statistical) error bars of 10 to 20 ps, or 2% for the longest and 5% of the shortest lifetime. However, the experimental conditions add further uncertainties.
The energy loss in the exciter foil is of order 10%, reduc-ing the ion velocity by about 5%. We take roughly half of that (2%) as an estimate of the ion velocity scale error (equivalent to the time scale error) relating to foil thickness (manufacture and exposure to the ion beam). A larger uncer-tainty relates to the influence of radiative cascades that arise from nonselective excitation of many levels in a level
scheme with many decay chains. Very fast cascades may boost the apparent initial population of the levels of interest, slow cascades contribute to a cascade tail, and cascade life-times close to that of a given level of interest may distort the decay curves in ways no multiexponential fit can reli-ably disentangle.
Without direct cascade measurements or at least a valid level population and cascade path model, we can make only educated guesses on the uncertainty associated with the persistent beam-foil problem of non-selective excitation. Explorative calculations of cascades possibly feeding the three levels of primary interest show the following situa-tion: for the 552.0 A˚ line, a very slow cascade is expected that at some 17 ns exceeds the lifetime range we can meas-ure, another one of about 1 ns that is close to the primary
(but with a small branching ratio for feeding the level of interest), and a fair number of much faster decays of indi-vidually low amplitude. For the 499.5 A˚ line, quite a num-ber of cascade levels with lifetimes of a few nanoseconds are expected, which fit to the observed cascade tail of ap-proximately 2 ns, plus a few fast decays. The situation is largely the same for the 453.5 A˚ line. Given the multitude of near-degenerate levels in higher shells, it is not possible to determine many cascade paths with high reliability. The general picture described, however, should be insensitive to computational detail. In combination with the uncertainty of the variation of the ion energy loss in the foil (which changes under irradiation), the overall lifetime measurement uncertainty is estimated to be of order 10% (see results in Table 1).
Fig. 1. Sample spectrum of a foil-excited La ion beam near the foil (where the lines of interest are most prominent), with prominent La IV lines marked.
Fig. 2. Decay curve of the 500 A˚ line of La IV constructed from fits to the line profile in 30 individual spectra recorded at various foil positions. The CCD signal is proportional to the number of photons detected. The statistical error bars are smaller than the data symbol dots. The fit procedure employed two exponentials (for the primary decay and a cascade tail, with approximate lifetimes indicated); the algorithm takes the spatial resolution of the detection system into account.
4. Discussion
The present work reports the first lifetime data obtained for a specific trebly ionized ion of the lanthanide group. The results show the feasibility of both the calculations and the beam-foil measurements, but they also illustrate the complexity of the situation.
On the theoretical side, the reasonably complex atomic models adopted illustrate the necessity to consider core po-larization effects in the calculations, but they also reflect the difficulty to model in a realistic way the collapse of the 4f orbital that is strongly embedded in the 5s and 5p core. It is somewhat disappointing to find that various extensive cal-culational models yield lifetime predictions that scatter con-siderably. Further investigations are required to better understand and represent effects, such as the orbital collapse in all the ions of the lanthanide group.
The experimental difficulties are largely inherent to the beam-foil technique and the non-selective excitation in the beam-foil interaction. The multichannel detection scheme, however, represents a major improvement.
As discussed in Sect. 3, a possible explanation of the dis-crepancy between theory and experiment might be the pres-ence of strong cascades in the BFS experiment, with the consequence that the experimental lifetimes might appear somewhat too long. This is a plausible qualitative explana-tion, but extensive further measurements would be needed to settle this question quantitatively.
If we assume that the measured lifetimes are reliable, the discrepancies between theory and experiment might be ex-plained by the assumption that the calculated lifetimes are too short. This cannot be entirely ruled out in view of the complexity of the situation with the collapsing orbitals. In
fact, such an observation might help to guide further calcula-tions. An underestimate of the core polarization effects would indeed mimic the systematics of the observed mismatch of theory and experiment. However, the size of the modification of the dipole polarizability parameter and of the cut-off radius that would be necessary for obtaining agreement between theory and experiment appears unrealistic.
Another possible explanation refers to the neglect in the adopted model of some strongly interacting configurations. We have carefully examined that possibility, but we were unable to detect such configurations.
To summarize, the differences between theory and experi-ment remain puzzling, and further experiexperi-mental and theoret-ical work is needed to clarify the situation. In spite of these limitations and problems encountered, the present work opens the way and provides an incentive for further gations for the benefit of, for example, astrophysical investi-gations of the atmospheres of hot CP stars that show a huge enhancement (compared with the solar case) of their lantha-nide content.
Acknowledgments
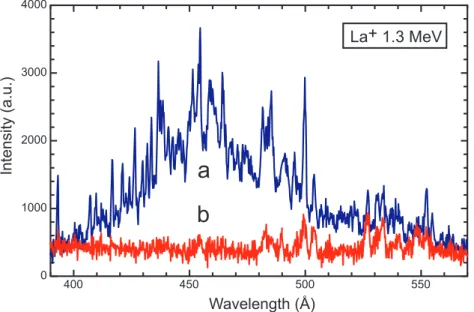
Financial support from the Belgian Institut Interuniversi-taire des Sciences Nucle´aires (IISN) and from the FRS-FNRS is acknowledged. ET thankfully acknowledges sup-port by the Deutsche Forschungsgemeinschaft (DFG). EB and PQ are Research Director and Senior Research Associ-ate, respectively, of the FRS-FNRS (Belgium). VF gratefully acknowledges a fellowship from FRIA. One of the authors (SEY) has received financial support from the Belgian DGCD through Grant No. PIC-MAC-1245 and a partial sup-port from the ICTP through the Grant No. OEA-AC-71. Fig. 3. Section of the beam-foil spectra of a 1.3 MeV La ion beam at two distances from the foil. The original spectra contain a non-uni-form background that originates from the CCD and readout electronics. This background can be represented by a smooth curve and sub-tracted from all spectra. In this example, the original ‘‘empty’’ spectrum at a foil position downstream of the field of view has been subtracted from the other spectra. The hump in the spectrum is a reproducible spectral feature, the shape of which changes with time after excitation. It represents a multitude of blended lines, probably of transitions in core-excited ions. The hump is most prominent in observa-tions that include the ion beam at the rear surface of the exciter foil (a) in the first 0.1 ns after excitation); some 1.4 ns later, the spectrum (b) is almost free of lines besides the ones of primary interest.
References
1. J.E. Lawler, G. Bonvallet, and C. Sneden. Astrophys. J. 556, 452 (2001). doi:10.1086/321549.
2. E.A. Den Hartog, J.E. Lawler, C. Sneden, and J.J. Cowan. Astrophys. J. 148, Suppl., 543 (2003). doi:10.1086/376940. 3. J.E. Lawler, E.A. Den Hartog, C. Sneden, and J.J. Cowan.
Astrophys. J. 162, Suppl., 227 (2006). doi:10.1086/498213. 4. J.E. Lawler, C. Sneden, J.J. Cowan, I.I. Ivans, and E.A. Den
Hartog. Astrophys. J. 182, Suppl., 51 (2009). doi:10.1088/ 0067-0049/182/1/51.
5. C. Sneden, J.E. Lawler, J.J. Cowan, I.I. Ivans, and E.A. Den Hartog. Astrophys. J. 182, Suppl., 80 (2009). doi:10.1088/ 0067-0049/182/1/80.
6. J.F. Wyart, A. Meftah, A. Bachelier, J. Sinzelle, W.-U¨ .L. Tchang-Brillet, N. Champion, N. Spector, and J. Sugar. J. Phys. At. Mol. Opt. Phys. 39, L77 (2006). doi:10.1088/ 0953-4075/39/5/L01.
7. J.-F. Wyart, A. Meftah, W.-U¨ .L. Tchang-Brillet, N. Cham-pion, O. Lamrous, N. Spector, and J. Sugar. J. Phys. At. Mol. Opt. Phys. 40, 3957 (2007). doi:10.1088/0953-4075/40/ 19/013.
8. A. Meftah, J.-F. Wyart, N. Champion, and W.-U¨ .L. Tchang-Brillet. Eur. Phys. J. D, 44, 35 (2007). doi:10.1140/epjd/ e2007-00173-x.
9. J. Reader and J.-F. Wyart. Phys. Rev. A, 80, 042517 (2009). doi:10.1103/PhysRevA.80.042517.
10. J.-F. Wyart, A. Meftah, J. Sinzelle, W.-U¨ .L. Tchang-Brillet, N. Spector, and B.R. Judd. J. Phys. At. Mol. Opt. Phys. 41, 085001 (2008). doi:10.1088/0953-4075/41/8/085001. 11. J. Migdałek and W.E. Baylis. J. Quant. Spectrosc. Radiat.
Transf. 22, 127 (1979). doi:10.1016/0022-4073(79)90033-5. 12. J. Migdałek and M. Wyrozumska. J. Quant. Spectrosc.
Ra-diat. Transf. 37, 581 (1987). doi:10.1016/0022-4073(87) 90061-6.
13. A.V. Glushkov. Opt. Spectrosc. 72, 293 (1992).
14. Z.G. Zhang, S. Svanberg, P. Quinet, P. Palmeri, and E´ . Bie´-mont. Phys. Rev. Lett. 87, 273001 (2001). doi:10.1103/ PhysRevLett.87.273001. PMID:11800875.
15. I.M. Savukov, W.R. Johnson, U.I. Safronova, and M.S. Sa-fronova. Phys. Rev. A, 67, 042504 (2003). doi:10.1103/ PhysRevA.67.042504.
16. K.D. Sen and A. Puri. Chem. Phys. Lett. 156, 505 (1989). doi:10.1016/S0009-2614(89)87320-8.
17. M. Stanek and J. Migdałek. J. Phys. At. Mol. Opt. Phys. 37, 2707 (2004). doi:10.1088/0953-4075/37/13/008.
18. V.A. Dzuba, U.I. Safronova, and W.R. Johnson. Phys. Rev. A, 68, 032503 (2003). doi:10.1103/PhysRevA.68.032503. 19. J.-F. Wyart, W.-U¨ .L. Tchang-Brillet, N. Spector, P. Palmeri,
P. Quinet, and E´ . Bie´mont. Phys. Scr. 63, 113 (2001). doi:10.1238/Physica.Regular.063a00113.
20. A.V. Loginov and V.I. Tuchkin. Opt. Spectrosc. 90, 631 (2001). doi:10.1134/1.1374646.
21. G.P. Anisimova, A.V. Loginov, and V.I. Tuchkin. Opt. Spectrosc. 90, 315 (2001). doi:10.1134/1.1358433.
22. N. Grevesse. Phys. Scr. T8, 49 (1984). doi:10.1088/0031-8949/1984/T8/008.
23. G.M. Wahlgren. Phys. Scr. T100, 22 (2002). doi:10.1238/ Physica.Topical.100a00022.
24. E´ . Bie´mont and P. Quinet. Phys. Scr. T105, 38 (2003). doi:10.1238/Physica.Topical.105a00038.
25. E´ . Bie´mont. Phys. Scr. T119, 55 (2005). doi:10.1088/0031-8949/2005/T119/010.
26. G. Rugel, T. Faestermann, K. Knie, G. Korschinek, M. Pou-tivtsev, D. Schumann, N. Kivel, I. Gu¨nther-Leopold, R.
Weinreich, and M. Wohlmuther. Phys. Rev. Lett. 103, 072502 (2009). doi:10.1103/PhysRevLett.103.072502. PMID:19792637.
27. E´ . Bie´mont, H.P. Garnir, U. Litze´n, K. Nielsen, P. Quinet, S. Svanberg, G. Wahlgren, and Z.G. Zhang. Astron. Astrophys. 399, 343 (2003) . doi:10.1051/0004-6361:20021797. 28. E´ . Bie´mont, P. Quinet, and T.A. Ryabchikova. Mon. Not. R.
Astron. Soc. 336, 1155 (2002). doi:10.1046/j.1365-8711. 2002.05868.x.
29. G.L. Epstein and J. Reader. J. Opt. Soc. Am. 59, 1525 (1969).
30. J. Reader, G.L. Epstein, and J.O. Ekberg. J. Opt. Soc. Am. 62, 273 (1972). doi:10.1364/JOSA.62.000273.
31. J. Reader and G.L. Epstein. J. Opt. Soc. Am. 65, 638 (1975). doi:10.1364/JOSA.65.000638.
32. G.L. Epstein and J. Reader. J. Opt. Soc. Am. 66, 590 (1976). doi:10.1364/JOSA.66.000590.
33. G.L. Epstein and J. Reader. J. Opt. Soc. Am. 69, 511 (1979). doi:10.1364/JOSA.69.000511.
34. E´ . Bie´mont, H.P. Garnir, P. Palmeri, P. Quinet, Z.S. Li, Z.G. Zhang, and S. Svanberg. Phys. Rev. A, 64, 022503 (2001). doi:10.1103/PhysRevA.64.022503.
35. Z.G. Zhang, Z.S. Li, S. Svanberg, P. Palmeri, P. Quinet, and E´ . Bie´mont. Eur. Phys. J. D, 15, 301 (2001). doi:10.1007/ s100530170144.
36. E´ . Bie´mont, G. Kohnen, and P. Quinet. Astron. Astrophys. 393, 717 (2002) . doi:10.1051/0004-6361:20021055. 37. E´ . Bie´mont, P. Palmeri, P. Quinet, G. Paquin, Z.G. Zhang,
G. Somesfalean, and S. Svanberg. Mon. Not. R. Astron. Soc. 328, 1085 (2001). doi:10.1046/j.1365-8711.2001.04922. x.
38. E´ . Bie´mont, P. Quinet, Z. Dai, Z. Jiang, Z.G. Zhang, H. Xu, and S. Svanberg. J. Phys. At. Mol. Opt. Phys. 35, 4743 (2002). doi:10.1088/0953-4075/35/22/315.
39. H. Xu, Z. Jiang, Z.G. Zhang, Z. Dai, S. Svanberg, P. Quinet, and E´ . Bie´mont. J. Phys. At. Mol. Opt. Phys. 36, 1771 (2003). doi:10.1088/0953-4075/36/9/309.
40. D. Rostohar, A. Derkatch, H. Hartman, S. Mannervik, L.-O. Norlin, P. Royen, A. Schmitt, and X. Tordoir. Phys. Scr. 64, 237 (2001). doi:10.1238/Physica.Regular.064a00237. 41. A. Derkatch, L. Ilyinski, S. Mannervik, L.-O. Norlin, D.
Rostohar, P. Royen, and E´ . Bie´mont. Phys. Rev. A, 65, 062508 (2002). doi:10.1103/PhysRevA.65.062508.
42. E. Tra¨bert. Phys. Scr. 78, 038103 (2008). doi:10.1088/0031-8949/78/03/038103.
43. K.T. Cheng and C. Froese Fischer. Phys. Rev. A, 28, 2811 (1983). doi:10.1103/PhysRevA.28.2811.
44. R.D. Cowan. The theory of atomic structure and spectra. University of California, Berkeley. 1981.
45. P. Quinet, P. Palmeri, E. Bie´mont, M.M. McCurdy, G. Rie-ger, E.H. Pinnington, M.E. Wickliffe, and J.E. Lawler. Mon. Not. R. Astron. Soc. 307, 934 (1999). doi:10.1046/j.1365-8711.1999.02689.x.
46. S. Fraga, J. Karwowski, and K.M.S. Saxena. In Handbook of Atomic Data. Elsevier, Amsterdam. 1976.
47. I.P. Grant, B.J. McKenzie, P.H. Norrington, D.F. Mayers, and N.C. Pyper. Comput. Phys. Commun. 21, 207 (1980). doi:10.1016/0010-4655(80)90041-7.
48. B.J. McKenzie, I.P. Grant, and P.H. Norrington. Comput. Phys. Commun. 21, 233 (1980). doi:10.1016/0010-4655(80) 90042-9.
49. I.P. Grant and B.J. McKenzie. J. Phys. B: At. Mol. Phys. 13, 2671 (1980). doi:10.1088/0022-3700/13/14/007.
Instrum. Methods, 164, 193 (1979). doi:10.1016/0029-554X(79)90451-8.
51. H.-P. Garnir. J. Phys.: Conf. Ser. 130, 012009 (2008). doi:10.1088/1742-6596/130/1/012009.
52. T. Bastin. Doctoral thesis, I.P.N.E., Universite´ de Lie`ge, Lie`ge, Belgium. 1996.
53. H.-P. Garnir and P.-H. Lefe`bvre. Nucl. Instrum. Methods Phys. Res. B, 235, 530 (2005). doi:10.1016/j.nimb.2005.03.238.