HAL Id: hal-01904523
https://hal.archives-ouvertes.fr/hal-01904523
Submitted on 3 May 2019HAL is a multi-disciplinary open access
archive for the deposit and dissemination of sci-entific research documents, whether they are pub-lished or not. The documents may come from teaching and research institutions in France or abroad, or from public or private research centers.
L’archive ouverte pluridisciplinaire HAL, est destinée au dépôt et à la diffusion de documents scientifiques de niveau recherche, publiés ou non, émanant des établissements d’enseignement et de recherche français ou étrangers, des laboratoires publics ou privés.
Effects of soil process formalisms and forcing factors on
simulated organic carbon depth-distributions in soils.
Saba Keyvanshokouhi, Sophie Cornu, Francois Lafolie, Jérôme Balesdent,
Bertrand Guenet, Nicolas Moitrier, Nathalie Moitrier, Cédric Nougier, Peter
Finke
To cite this version:
Saba Keyvanshokouhi, Sophie Cornu, Francois Lafolie, Jérôme Balesdent, Bertrand Guenet, et al.. Effects of soil process formalisms and forcing factors on simulated organic carbon depth-distributions in soils.. Science of the Total Environment, Elsevier, 2019, 652, pp.523-537. �10.1016/j.scitotenv.2018.10.236�. �hal-01904523�
Effects of soil process formalisms and forcing factors on simulated organic carbon
1
depth-distributions in soils
2 3
Keyvanshokouhi, S.a,b, Cornu, S.a, Lafolie, F.c, Balesdent, J.a, Guenet, B.d, Moitrier, N.c, 4
Moitrier, N.c, Nougier, C.c, Finke, P.b 5
6
a- Aix-Marseille Univ, CNRS, IRD, INRA, Coll de France, CEREGE, 13545 Aix en 7
Provence, France 8
b- Ghent University, Department of Environment, Coupure Links 653, B-9000, 9
Belgium 10
c- EMMAH, INRA, Université d'Avignon et des Pays de Vaucluse, 84000 Avignon, 11
France 12
d- Laboratoire des Sciences du Climat et de l’Environnement (LSCE/IPSL), UMR8212 13
(CEA-CNRS-UVSQ), Université Paris-Saclay, 91198 Gif-sur-Yvette Cedex, France 14
15
16
*Manuscript (double-spaced and continuously LINE and PAGE numbered)-for final publication Click here to view linked References
Abstract
17
Soil organic carbon (OC) sequestration (i.e. the capture and long-term storage of 18
atmospheric CO2) is being considered as a possible solution to mitigate climate change, 19
notably through land use change (conversion of cropped land into pasture) and 20
conservation agricultural practices (reduced tillage). Subsoil horizons (from 30 cm to 1 21
meter) contribute to ca. half the total amount of soil OC, and the slow dynamics of deep OC 22
as well as the relationships between the OC depth distribution and changes in land use and 23
tillage practices still need to be modelled. 24
We developed a fully modular, mechanistic OC depth distribution model, named OC-VGEN. 25
This model includes OC dynamics, plant development, transfer of water, gas and heat, 26
mixing by bioturbation and tillage as processes and climate and land use as boundary 27
conditions. OC-VGEN allowed us to test the impact of 1) different numerical 28
representations of root depth distribution, decomposition coefficients and bioturbation; 2) 29
evolution of forcing factors such as land use, agricultural practices and climate on OC 30
depth distribution at the century scale. 31
We used the model to simulate decadal to century time scale experiments in Luvisols with 32
different land uses (pasture and crop) and tillage practices (conventional and reduced) as 33
well as projection scenarios of climate and land use at the horizon of 2100. We showed 34
that, among the different tested formalisms/parametrizations: 1) the sensitivity of the 35
simulated OC depth distribution to the tested numerical representations depended on the 36
considered land use; 2) different numerical representations may accurately fit past soil OC 37
evolution while leading to different OC stock predictions when tested for future forcing 38
conditions (change of land use, tillage practice or climate). 39
40
Keywords
41
Climate change, pasture, reduced tillage, organic matter, OC projection, model formalisms 42
1. Introduction
43
Soil organic matter is the largest terrestrial carbon reservoir that is in constant 44
exchange with the atmosphere and, consequently, a small change in this carbon reservoir 45
can have a strong effect on atmospheric CO2. Estimating the response of soil organic 46
carbon (OC) to climate change is crucial (Smith et al., 2008; Minasny et al., 2017) because 47
soil OC sequestration is being considered as a possible solution to mitigate climate change, 48
converting atmospheric CO2 into long-life soil organic carbon. Land use change 49
(conversion of cropped land into pasture) and conservation agricultural practices 50
(reduced tillage), considered as a strategy to sequester carbon in soil, have been 51
extensively studied (Paustian et al., 1997; Jobbágy and Jackson, 2000; Post & Kwon, 2000; 52
Lal, 2004). Nevertheless, the relationship between the OC depth distribution and changes 53
in land use and tillage practices is still poorly understood (Jobbágy and Jackson, 2000; 54
Lorenz and Lal, 2005) and controversial results have been reported concerning the effects 55
of tillage reduction (Haddaway et al., 2016). 56
Thus, there is an urgent need to better predict the OC stock evolution under land use, 57
management and climate change scenarios by the year 2100. Heretofore, most predictive 58
modelling efforts (Smith et al., 2005; Xu et al., 2011; Lugato et al., 2014; Wiesmeier et al., 59
2016) concentrated on the upper 30 cm of soil, e.g. those based on RothC (Coleman et al., 60
1997) or Century (Parton, 1996). These models describe OC as an ensemble of organic 61
pools with different decay dynamics, but do not consider other soil processes or depth 62
distributions. However, while the upper 30 cm (topsoil - A Horizon) of soil profile 63
represents the highest organic matter concentrations, recent studies show that subsoil 64
horizons (from 30 cm to 1 meter) contribute to 30 to 63 % of the total amount of soil OC 65
(Batjes, 2014). Consequently, OC stock prediction must not be restricted to the upper 30 66
cm of the soil but should also consider deep OC stocks. Indeed, Balesdent et al. (2018) 67
indicated that "using multilayer soil modules in global carbon models could help to 68
improve our understanding of soil–atmosphere carbon exchange". 69
However, deep OC dynamics is generally not considered in OC modelling approaches or 70
only to a limited extent (Nakane, 1978; Elzein and Balesdent, 1995; Baisden et al., 2002; 71
Guenet et al., 2013) because the transport mechanisms of OC into deep layers are not well 72
understood. Indeed, their direct measurement of deep OC evolution is limited due to very 73
low concentrations and very slow changes. Information on contribution of deep roots to 74
OC stock is rarely available while obtaining data on deep OC decomposition is not possible 75
without disturbing the processes involved. Therefore, these processes may be addressed 76
either by using tracers as stable C isotopes (Balesdent et al., 2018) or by modelling 77
approaches. Recent works emphasized the need for multilayer soil carbon modules 78
(Campbell and Paustian, 2015; Luo et al., 2016). He et al. (2016) suggested that Ecological 79
Soil Models “must better represent carbon stabilization processes and the turnover time of 80
slow and passive reservoirs when simulating future atmospheric carbon dioxide 81
dynamics"; 82
The processes responsible for deep OC stock change are transport of dissolved OC, 83
bioturbation, root input and decomposition. Several attempts were made to introduce 84
these processes in OC dynamic modelling. (e.g., Hilinski, 2001; Braakhekke et al., 2011; 85
Koven et al., 2013; Riley et al., 2014; Camino-Serrano et al., 2018). Nevertheless, for these 86
key processes, several numerical representations (including the equations and 87
parametrization) exist in the literature (e.g. Elzein and Balesdent, 1995; Jackson et al., 88
1996; Zeng, 2001; Koven et al., 2013 among others), and are often model-specific. The 89
impact of these different numerical representations on the simulated OC depth-90
distribution should be evaluated. But because of model-specific formalisms, it is difficult to 91
modify their parameterization because of their imbrication with the parameters of other 92
processes. 93
In addition, at the century scale, when considering climate change 1) explicit transfer of 94
water and heat should be considered and 2) inherent soil properties that are important for 95
OC dynamic, as soil texture, bulk density and hydraulic properties, cannot be considered 96
constant (e.g. Montagne et al., 2008; Boizard et al., 2013). As an example, soil OC content is 97
related to the soil bulk density, which influences soil hydraulic properties and thus soil 98
water content that in turn affect the OC decomposition. Because deep OC might be 99
thousands years old and interacts dynamically with soil development, OC dynamics must 100
be coupled with a model of pedogenesis. Therefore, the retroaction among soil properties 101
much be taken into account explicitly. 102
Based in this analysis, we developed a fully modular OC depth distribution model, called 103
OC-VGEN that provides a multilayer representation of the soil; takes into considerations 104
among soils properties while modelling OC dynamics; allow considering landuse and 105
tillage practices as well as most of the depth distribution processes considering their 106
different formalisms. 107
The motivations for the development of OC-VGEN are not to add one model to the long list 108
of existing soil C models (Campbell and Paustian, 2015), but to be able to test alternate 109
formalisms for a given process. Hereto, we build OC-VGEN in a modular platform VSoil 110
(Lafolie et al., 2014), that allows easy coupling of OC dynamics with other processes of soil 111
development that interact with OC itself through feed-back loops, such as bioturbation or 112
changes in soil chemistry, granulometry, porosity and hydraulic properties. Such model 113
will allow users to identify where uncertainty about process formulations impacts the 114
accuracy of relevant model outputs (such as OC depth distribution and its change over 115
time), and thus, where more research is needed before OC-modelling can be successful 116
and accurate. 117
OC-VGEN was then used to test the impact of 1) different numerical representations of 118
root depth distribution, OC decomposition coefficients and vertical transfer by 119
bioturbation; 2) forcing factors such as land use, agricultural practices and climate on OC 120
depth distribution at the century scale. Therefore, the model was tested on long-term 121
experiments on Luvisols that includes different land uses (pasture and crop) and tillage 122
practices (conventional and reduced) and was forced by projection scenarios of climate 123
and land use at the horizon of 2100. 124
2. Materials and Methods
126
2.1 Description of OC-VGEN model and its variations 127
OC-VGEN is a pedon scale, mechanistic model that takes into account factors of soil 128
formation (climate, organisms, relief, parent material and human activities on soil) as 129
initial or boundary conditions. It focuses on carbon dynamics and was developed in the 130
VSoil modelling platform (Lafolie et al., 2014; Brimo et al., 2018). Other processes are 131
fluxes of water, gas and heat, solid mixing processes such as bioturbation and tillage as 132
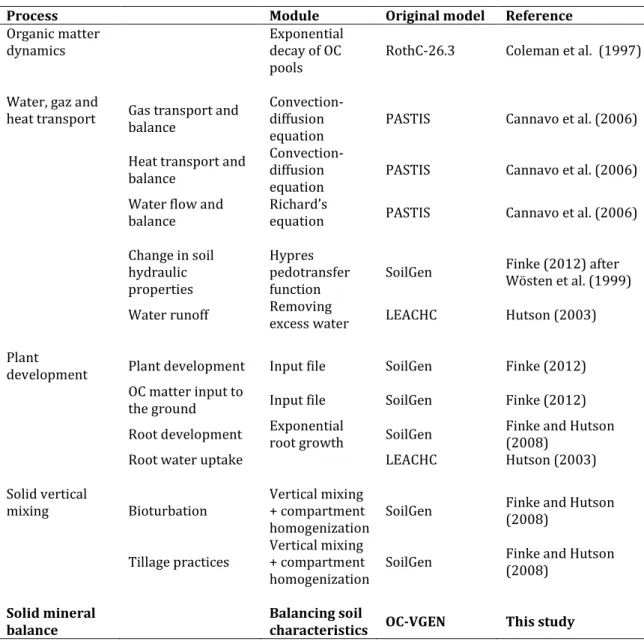
well as plant development (Table 1 and Figure 1). 133
134
2.1.1 The VSoil platform 135
VSoil (Lafolie et al., 2014; Brimo et al., 2018) is a component-based platform that 136
aims at designing, developing and implementing bio-geochemical and physical processes 137
in soil. There is clear distinction in this platform between knowledge defined as processes 138
and their mathematical representation defined as modules. Processes of any kind 139
(physical, chemical, biological) influencing soil properties occurring within soil or at its 140
boundaries (atmosphere and water table) can be described. Several numerical expressions 141
and computer codes (modules) can be proposed to represent each of the processes. The 142
modules associated to one process can differ by their numerical representations having 143
different levels of complexity (from fully mechanistic to empirical), or by the numerical 144
technique used to solve the equations or by the programming language (FORTRAN or 145
C++). The processes and the associated modules can represent an actual process 146
happening in the soil or an equation that leads to the evolution of soil properties. For 147
example, the dynamic estimation of soil hydraulic properties and mass balance equations 148
are defined as processes. 149
To build a model, a set of processes is selected, each process being associated to a module. 150
The platform makes the connection between the processes/modules according to the 151
defined input and outputs. Alternative versions of a same model can be designed by 152
changing the modules associated to one or more processes of that model. In this paper we 153
developed the OC-VGEN model in the VSoil platform as well as alternative versions of it by 154
changing one module at a time as described below. 155
156
2.1.2. Simulation protocol 157
The impact of different numerical representations and parameters of plant rooting depth 158
distribution, bioturbation and depth-dependent decomposition rate coefficient on the OC 159
depth distribution was analyzed by running the model, changing one formalism 160
(numerical representation or parameter) for each run. Table 2 summarizes the 6 161
formalisms: one reference run, three alternative formalisms for rooting depth (Alt1-162
RD_Jackson, Alt2-RD_Zeng, Alt3-RD_A/B, see also section 2.1.5), one alternative formalism 163
for a depth-dependent decomposition coefficient (Alt4-OC_DDCoeff, see also section 2.1.3) 164
and one alternative formalism for bioturbation (Alt5_Bioturb, see also section 2.1.6). 165
These alternatives were performed for three different land use/agricultural practices 166
known to affect OC in soil, namely cultivation with conventional tillage (M1) or reduced 167
tillage (M2) and pasture (M3) for one site (Mons; Table 3, see also section 2.2.1). This 168
made a total of 18 simulations (6 models run for 3 land use/practices - Table 2) 169
representing the past until 2011 AD. 170
More specifically, for each simulation, a warming run (spin-up) was designed to simulate 171
the initial state of the system. The spin-up runs consisted in a 300 years simulation except 172
for the OC_DDCoeff version of the model for which the spin-up duration was extended to 173
1000 years. This was done because after 300 years, this model version still showed 174
dependency of the initial situation. IOM was fixed as equal to the concentration of C 175
horizon (105-125 cm). Then 1939-2011 scenarios were simulated for cultivation with 176
conventional tillage, reduced tillage and pasture starting with the respective steady state 177
obtained by the corresponding version of the model. Climatic condition for these runs are 178
reported in Figure 2. 179
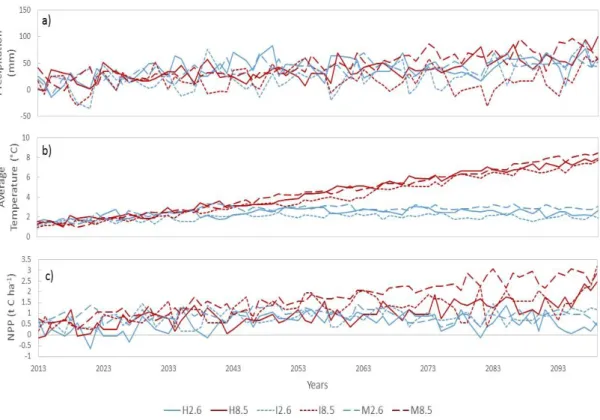
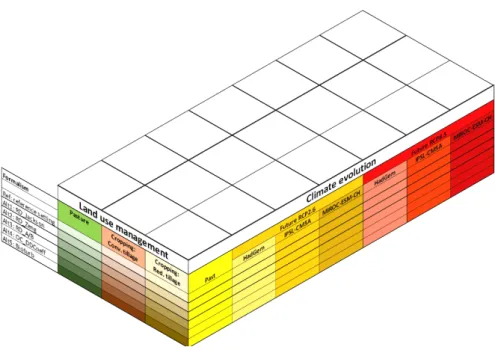
The impact of future climate change at horizon of 2100 was then analyzed based on 6 180
climatic scenarios (RCP2.6 and RCP8.5, each simulated by 3 climate models HadGEM, IPSL-181
CM5A and MIROC-ESM-CH, see Figure 3) for the three considered land use/tillage 182
practices and the 6 considered model versions. This resulted in 108 additional 183
simulations. These runs were designed as continuations of the previous one. Therefore, no 184
spin-up steps were run for equilibration purposes. 185
The over-all layout of these simulations is shown in Figure 4. 186
187
2.1.3. Description of the OC-VGEN modules 188
2.1.3.1 The OC dynamic module 189
The OC dynamic module was developed based on the Rothc-26.3 model (Coleman et al., 190
1997) with some adaptation based on SoilGen (Finke and Hutson, 2008). In this model, 191
fresh organic matter input is split between different pools (decomposable plant material 192
(DPM), resistant plant material (RPM), biomass (BIO), humus (HUM), inert organic matter 193
(IOM), Figure 1). Organic matter decomposes over time with half-life that differs strongly 194
among pools (a month for DPM; one to three years for BIO, three to ten years for RPM, 195
over 50 years for HUM, IOM is considered as stable in the model; Janik et al., 2002). 196
Decomposition rates additionally depend on moisture deficit, temperature, soil cover and 197
texture (Equation 1). 198
(1)
Where K(z) is the pool- and depth-dependent decomposition rate, K0,p is the pool
199
dependent decomposition rate coefficient which is constant over depth and r, are the rate 200
modifiers corresponding to T, the soil temperature calculated by the heat transfer module, 201
SC, the soil cover, and Wt, both the moisture deficit and the < 2 µm fraction. The term rz(z)
represents other depth dependent processes such as priming effect, i.e. the reduction of 203
decomposition rates at depth as a result of low fresh substrate supply (Guenet et al., 2013; 204
Shahzad et al., 2018). Koven et al. (2013) proposed an exponential function for rz(z), that
205
decreases with depth to account for those processes (Equation 2). 206
(2)
where zτ is the e-folding depth of the intrinsic decomposition rates. This depth was
207
optimized by Koven et al. (2013) to 40 cm. 208
Temperature, moisture deficit and < 2 µm fraction are also depth dependent and are 209
calculated using the same equations from the RothC26.3 model (Jenkinson and Coleman, 210
2008) 211
Soil moisture deficit corresponds to the difference between potential evapotranspiration 212
and precipitation, being vertically distributed according to air filled porosity depth profile 213
derived from the water transfer module. 214
At last, the partition coefficient among RPM/DPM pools in litter (the only pools 215
represented in litter) is a function of the vegetation type/land use. 216
This module was implemented in VSoil platform as a core of OC-VGEN model to account 217
for the dynamics of organic carbon in soil and used with rz(z) equals to one except for one
218
simulation in which the impact of the decomposition coefficient formalism on OC depth 219
distribution is evaluated (the scenarios are summarized in Table 2). While in the A 220
horizon, the OC decomposition rate corresponds to that calibrated in SoilGen, it decreases 221
exponentially below that horizon. 222
223
2.1.3.2. Water, heat and gas transfer modules 224
OC-VGEN uses Richard’s equation to simulate the flow of water and advection-diffusion 225
used to solve transport equations. It was developed after Pastis (Cannavo et al., 2006). 227
Upper boundary conditions in water module allow for surface infiltration, evaporation and 228
zero flux, while the lower boundary accounts only for free drainage in this study. When the 229
soil infiltrability is exceeded, a water runoff module simply returns a soil surface potential 230
to zero. Additionally, the soil cover fraction limits the evaporative flux at the upper 231
boundary. This fraction is a function of the vegetation. 232
Soil hydraulic properties are simulated by the model once a year by the Hypress 233
pedotransfer function based on the texture, OC and the bulk density (Wösten et al.,1999; 234
adapted by Finke, 2012). Soil bulk density, water content and porosity are used to 235
calculate soil heat capacity and thermal conductivity. Diffusive heat flux and transport by 236
water are simulated. 237
238
2.1.3.3. Plant development modules 239
The plant development modules aim at bringing organic carbon into soil and up taking 240
water from it. They consist in two modules: a plant development module and a module of 241
water uptake by roots (Figure 1). 242
The plant development module provides organic matter input and root distribution 243
profile. The organic matter input to soil consist in an input file indicating OC input through 244
Net Primary Production (NPP) or/and organic amendments. This input is subsequently 245
split between the above and below ground pools. Both pools then decay over time with 246
similar equations as described in organic matter dynamic module. The ratio of above to 247
below ground fresh organic input and the DPM/RPM ratio depend on the vegetation 248
type/land use. 249
The plant root depth distribution is defined by a root density function and a rooting depth. 250
The first consist in the formalism of root depth distribution while the latter is a parameter 251
of that formalism. 252
Generally, in literature the root depth distribution formalism is represented by an 253
exponential equation, with some variations among authors. OC-VGEN originally uses 254
Equation 3 for permanent vegetation considering a steady rooting profile. 255
(3)
where, RDF (mroot m-3soil) is the root density function calculated for each compartment 256
inside the maximum rooting depth, z, represents the depth (m) and α is equal to 4 m-1 257
based on Finke (2012). 258
Davidson et al. (1978) proposed a root density function for crops in which the root is 259
assumed to be growing within the year based on the pre-defined dates of planting, 260
germination and root maturity according to Equation 4. 261
(4)
in which, Rmax is the maximum root density at z=0, z is the soil depth and L is the depth of
262
the bottom of root zone, and is an empirical function of the number of days since 263
planting up till root maturity, originally developed for corn crops. At harvest, plant roots 264
are no longer active regarding the uptake of water from the soil. For more details, see 265
Davidson et al. (1978). This approach was used in OC-VGEN as used previously in the 266
SoilGen model (Finke, 2012) for crops. 267
On the other hand, Jackson et al. (1996) fitted the function developed by Gale and Grigal 268
(1987) to a global data set of root profile measurements and reached a global average 269
rooting distribution function (Equation 5) that is common for the different plant groups 270
(grass, shrubs, crop, trees). 271
(5)
where, β is the depth coefficient estimated by fitting to the measured data for each 272
vegetation type. β is equal to 0.943 and 0.961 with r2=0.88 and 0.82 for pasture and crop 273
respectively. 274
Zeng (2001) fitted a double exponential equation (Equation 6) on the rooting depths 275
reported by Canadell et al. (1996). This equation is an improved version of Jackson et al. 276
(1996). 277
(6)
with a equals 10.74 and 5.558 m-1, and b, 2.608 and 2.614 m-1, for pasture and crop 278
respectively. 279
The parametrizations for rooting depths result in three different root depth distribution 280
formalisms (Table 2). These formalisms include different choices for the distribution of 281
fresh organic matter over the litter layer (aboveground) and rooted layers (belowground), 282
which are expressed by above/below ground ratios (Table 2). . The two alternative 283
formalisms (Jackson et al., 1996; Zeng, 2001) and the corresponding parametrizations 284
were implemented in VSoil platform to create three alternative model versions 285
(RD_Jackson, RD_Zeng and RD_A/B – summarized in Table 2). Note, that in all the above 286
cases RDF is scaled to sum to 1 over the rooted zone. 287
Lastly, root water uptake calculation, a sink term in Richard’s equation, is based on 288
LEACHC (Hutson, 2003). This function optimizes the root water potential to minimize the 289
difference between the transpiration demand and the flux of water from the soil to the 290
roots taking into account the fraction of active roots present, the soil-water matrix 291
potential (m) and hydraulic conductivity (m s-1) at each soil layer. The transpiration 292
demand is calculated from the potential evapotranspitation and the vegetation 293
development provided by the crop development module. 294
295
2.1.3.4 Mass mixing modules 296
Mass mixing processes considered in OC-VGEN are bioturbation and tillage. 297
Bioturbation is classically described in the literature based on the diffusion equation 298
(Elzein and Balesdent, 1995; Jarvis et al., 2010; Tonneijck et al., 2016). 299
(7)
while D(z) is the diffusion coefficient and MOC, the organic carbon mass. D(z) has been
300
classically considered as constant through depth. Nevertheless, Jagercikova et al. (2014) 301
recently introduced the depth-dependent diffusion coefficient that exponentially 302
decreases in depth (Equation 8). 303
D(z) = D0 e-bz (8)
304
where D0 is the diffusion coefficient at the surface (m2 s-1) and b, the parameter of
305
exponential decrease (m-1). 306
Jagercikova et al. (2014), fitted Equation 8 to 137Cs activities measured on the long-term 307
experiment site considered in this study and obtained the following values of D0 and b for
308
the pasture profile: D0 = 5.42 ± 1.81 cm2 yr-1 and b = 0.04 ± 0.01 cm-1. No 137Cs was
309
detected below 50 cm suggesting a negligible bioturbation below that depth. 310
A different modelling approach for bioturbation, was introduced in SoilGen2.24 model 311
(Finke, 2012). In this approach a portion of each soil layer is distributed vertically among 312
the other soil layers of the bioturbated depth and then homogenized with the remaining 313
soil in each layer to predict the soil properties at each compartment after the process of 314
vertical mixing. The mixing proportions per layer and the mixing depths are yearly model 315
inputs. 316
Both formalisms include the redistribution of both soil solid and liquid phases. OC-VGEN 317
originally uses the approach used in SoilGen2.24. In addition, the diffusive bioturbation is 318
implemented in the VSoil platform as an alternative to allow for evaluation of the impact 319
of bioturbation formalism on OC depth distribution (the alternative model created using 320
this module is called Bioturb and is summarized in Table 2). 321
Tillage was implemented after SoilGen2.24 (Finke, 2012). In this model, as for 322
bioturbation, a portion of each soil compartment is distributed vertically among the other 323
soil layers of the tilled depth and then homogenized with the remaining soil in each layer 324
to predict the soil properties at each layer after the process of vertical mixing. A mixing 325
proportion per layer and the tilled depths are defined by the user and can very over time. 326
327
2.1.3.5. The mass balance process 328
A mass balance process was introduced in OC-VGEN to account for the changes applied to 329
soil OC and soil particles mass fraction (clay, sand and silt) through different processes. In 330
this approach the model does not exchange the value of each property (X), but the changes 331
applied, Δp(X), during the time increment, to that property X by a given process p. Each 332
process will produce a Δp(X) which is an input of the mass balance process. The mass 333
balance process will update the mass of X, MX, and provide the new value whenever it is
334
needed. The module associated to this process is based on equation 9. 335
(9) where, t represents the time step and n, number of processes modifying X.
336
337
2.1.4. OC-VGEN input data requirements, time step and depth discretization 338
OC-VGEN needs as initial conditions the characteristics of soil corresponding to the 339
distribution of different particle sizes (clay, sand and silt), OC content, bulk density and 340
water content and as boundary conditions the yearly time series of temperature, 341
precipitation and corresponding evapotranspiration as well as land use and vegetation 342
from the four existing land use/vegetation types (agriculture, pasture, coniferous and 343
deciduous woodland). 344
The time step of the model varies from a few seconds for the case of simulations of water 345
flow, to a day for simulation of OC dynamics, or to a year for application of tillage and 346
bioturbation. 347
The soil profile is discretized on layers of thickness ranging from few millimeters to few 348
centimeters. In this study we used a fixed layer thickness of 0.05 m down to 1.2 m depth. 349
350
2.2 Evaluation data set, forcings and statistical analyses 351
2.2.1. Evaluation data set 352
The evaluation dataset consists in soil characteristics collected on three Luvisol plots from 353
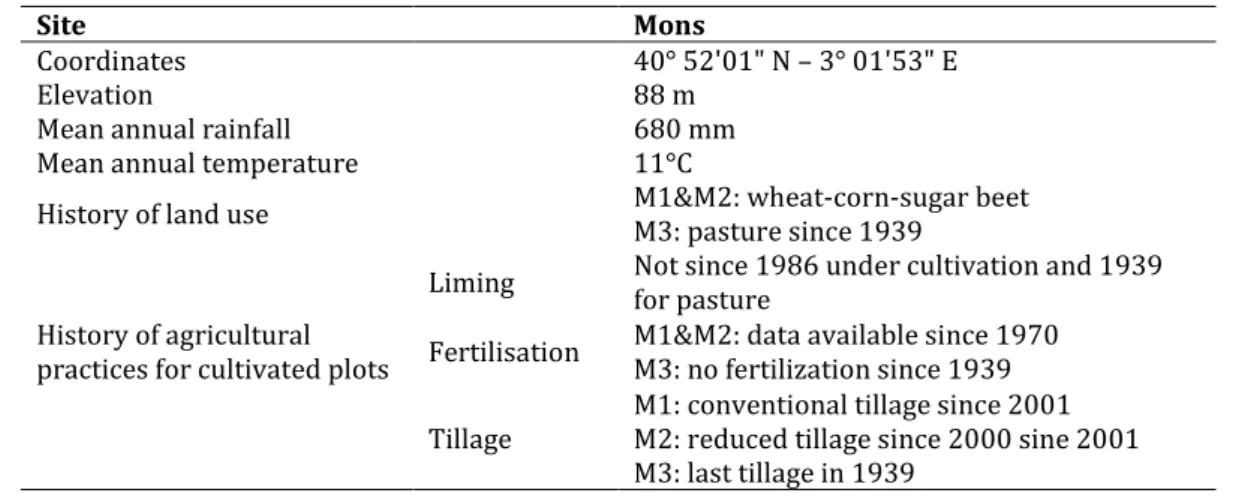
a long-term experiment on a Loess deposit, in the Paris Basin, at Mons. All plots were 354
cropped 260 years before present as shown on Cassini maps (Cassini, 1750). Seventy-two 355
years before the sampling date, one of the plots was converted to pasture while the other 356
two experienced differentiated tillage: one plot continued with conventional tillage, the 357
other experienced reduction in tillage depth and intensity over the last 10 years (Table 3). 358
Soil profiles were already extensively characterized by Jagercikova et al. (2014). 359
360
2.2.2. Forcing data set 361
Forcing data consist in climate, NPP, land use and tillage history. 362
For the spin-up runs, forcing data consist in input fluxes and climate of 1939-1958 period 363
and cultivation with conventional tillage as a land use (Figure 2). 364
For the 1939-2011 period, forcing data consisted in the land use history of the three above 365
described plots. OC inputs are known for the last 10 years for the two-cropped plots and 366
estimated at 5 until 1970 and then at 4 t ha-1 yr-1 from 1970 to 2001 (Figure 2c). This 367
decrease in OC inputs was due to an increase of the crop exportation with agriculture 368
intensification in the 70’s. For the pasture, they were estimated at 6.7 t ha-1 yr-1 based on 369
the annual yields estimated by the technical institute for pasture in this region of France. 370
Climate input data were provided by Meteo France for this site (SAFRAN grid; Quintana-371
Seguí et al., 2008) for the period extending from 1939 to 2011 (Figure 2). 372
For the 2011-2100 period, two economic scenarios were considered, the RCP 2.6 373
(greenhouse emissions decreasing after 2020) and RCP8.5 (emissions continue to rise) 374
IPCC scenarios (Vuuren et al., 2011). We used as input climate the bias-corrected outputs 375
produced within the ISI-MIP project (Warszawski et al., 2014) from three Earth System 376
Models (ESM) named the HadGEM, IPSL-CM5A and MIROC-ESM-CH for these two 377
scenarios (Figure 3a, b and c). The NPP was estimated by running the land surface model 378
ORCHIDEE (Krinner et al., 2005) forced by the climate fields of the three ESMs for the two 379
scenarios (RCP 2.6 and RCP8.5). The precipitation variations range from -20 to +50 mm, 380
temperature rise from 2 to 8 °C and NPP increase from 1 to 2.4 (t C ha-1) depending on 381
the considered scenario and on the selected ESM. 382
2.3 Data treatment 383
In order to estimate the impact of formalisms of the three selected processes (root depth 384
distribution, bioturbation and OC depth decomposition) on OC depth distribution we 385
compared, the OC stocks simulated using different formalisms at the end of the simulation. 386
Comparisons are presented in terms of percentage of variations, ΔOC, calculated in 387 Equation 10. 388 (10)
where OCRef stands for OC stock in mineral horizons simulated using the reference setting
389
of process formalism in OC-VGEN model (Ref in Table 2) and OCAlt, the OC stock simulated
390
by model versions built based on alternative formalisms (Table 2). Permanent above 391
ground OC layer (ectorganic) when existing (pasture) is considered in the total soil OC 392
stock calculation, but not in OC depth distribution analysis as this layer is not considered 393
to be in the soil profile. We specifically looked into deep OC stocks response to different 394
formalisms or parameters. Below 30 cm, OC stocks are considered as deep OC in this 395
study. 396
We also compared the OC stocks simulated by the different versions of the model to 397
measurements made on the long-term experiment plots to test the quality of the different 398
version of the model. We estimated the model–measurement discrepancy using statistics 399
of deviation as proposed by Kobayashi and Salam (2000). 400
The Mean Squared Deviation, MSD (Equation 11) was calculated as well as its three 401
components, being: the squared bias of simulation (Equation 12), the squared difference 402
between standard deviations of simulation and measurements (SDSD – Equation 13) and 403
the lack of positive correlation weighted by the standard deviations (LSC – Equation 14). 404 (11) 405 (12) 406 (13) 407
where SDs is the standard deviation of simulations and SDm that of measurements. 408
And finally, 409
(14)
410
Where r represents the correlation coefficient between the simulations and measurements 411 being: 412 (15) 413
The sum of the three component equals the MSD by definition. The lower the value of MSD, 414
the closer the simulation is to the measurement. 415
3. Results and discussion
417
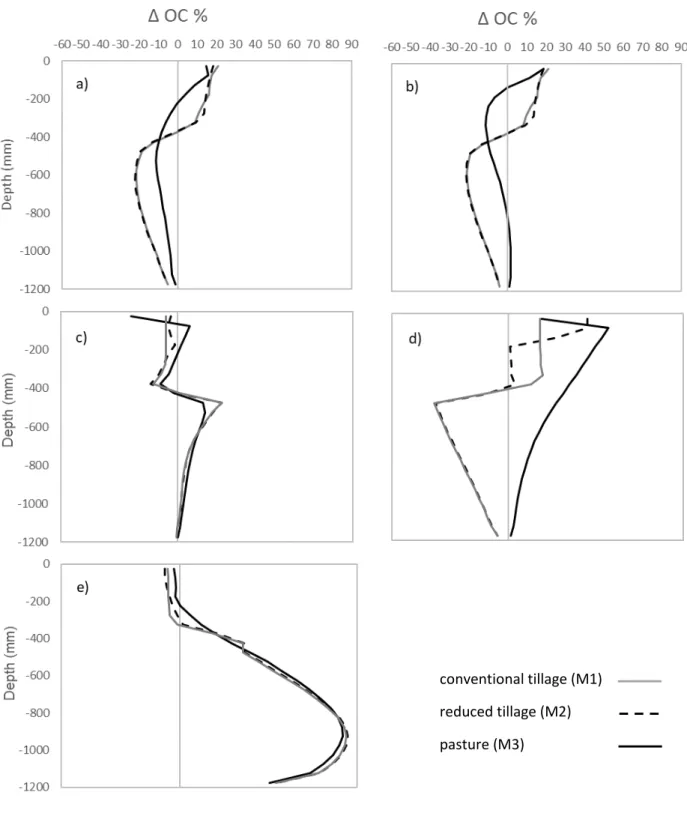
3.1 Impact of formalism of key OC depth distribution processes 418
Simulated total soil OC stocks were as expected affected at the first order by the 419
introduction of a depth-variable decomposition rate coefficient or by a change in the 420
above/below ground fresh organic input for pasture. Other changes in the numerical 421
representation of the processes only affected the OC depth distribution within the soil 422
profile (Table 4). While considering the deep OC stocks (30-120 cm), the introduction of a 423
depth-variable decomposition rate coefficient resulted in an increase of those stocks while 424
other numerical representation changes decreased them (Table 4). While considering the 425
depth distribution in more details (Figure 5), the effect of the different numerical 426
representation of the processes was more complex as described below. 427
Effect of the root density function - In comparison to default rooting function and for the 428
two cropped profiles, the use of Zeng (2001) and Jackson et al. (1996) formalisms 429
increased the OC stocks simulated for the upper soil layers (0 to 35 cm) by 20 % and 430
decreased it below 40 cm, with maximum decrease of 20% around 60 cm (Figure 5 a and 431
b). Zeng (2001) formalism produced slightly higher OC stocks than Jackson et al. (1996) 432
formalism below 70 cm. For pasture, both functions increased the OC stocks above 15 cm 433
depth, with an increase of 20 % for the first soil compartment. This increase was larger 434
and deeper (up to 25 cm) with Jackson et al. (1996) than with Zeng (2001) formalism. 435
Below that depth, both formalism simulated lower OC stocks than the formalism used as a 436
reference (Finke, 2012). When considering Zeng (2001) formalism, this decrease occurred 437
mainly from 15 to 70 cm in depth with a maximum decrease of 10 % around 25 cm, while 438
with Jackson et al. (1996) formalism, the decrease started from 25 cm depth with a 439
maximum of 10 % around 50 cm. In the case of Zeng (2001) formalism, no differences in 440
OC stocks compared to the reference function were recorded below 70 cm (Figure 5b). 441
The use of conventional diffusive transport of OC for bioturbation instead of a vertical 442
and 110 cm depth, with a maximal decrease at 50 cm (by about 20 %), for the three 444
considered plots. For the surface layers (0-40 cm), the impact of the use of conventional 445
diffusive transport of OC by bioturbation instead of a vertical mixing of matter differed 446
between land uses. For agriculture, a OC stock decrease of 5 to 15 % was simulated, while 447
for pasture, this stock was decreased by 30 % for the upper soil layer and then was 448
increased between 10 and 20 by as much as 5 % (Figure 5c). 449
Effect of the above/below ground ratio of fresh organic carbon input - For pasture, the 450
alternative scenario corresponded to an increase of the below ground contribution while 451
for agriculture it corresponded to a decrease. In the case of pasture, increasing the below 452
ground contribution logically increased the OC stocks over the whole soil profile by 15 to 453
50 % depending on the considered depth (Figure 5d), with a maximum increase round 10 454
cm. The total soil OC stocks increased by 23% while the ectorganic layer decreased by 455
60% (Table 4). For agriculture, reducing the below ground input did not affect the total 456
soil OC stock (Table 4) since both above and below ground inputs are mixed by tillage. 457
However, it increased the OC input to the soil in the tillage layer and conversely decreased 458
the soil OC input by roots. Therefore, a decrease of the OC stock below 40 cm was 459
observed. This decrease was maximal around 50 cm, where the root proportion was still 460
important, and it became lower below that depth as the root abundance decreased. Above 461
40 cm, the OC stocks increased by 15 % on the entire depth interval for the conventional 462
tillage and by 40 % over the 10 upper centimetres for the reduced tillage plot (Figure 5d). 463
The introduction of a depth-variable decomposition rate coefficient only influenced the 464
OC depth distribution below 30 cm since the decomposition rate coefficients used above 465
that depth were the same in the reference and 0C_DDCoeff models. The exponential 466
decrease with depth of the decomposition rate coefficient increased as expected the OC 467
stocks up to 85 % at around 100 cm depth for all the considered land uses and tillage 468
practices (Figure 5e). Below the bioturbation depth (i.e., 50 cm), models that combine an 469
exponential decrease with depth of both root input (exp- z, Eq.3) and decay rates (exp- z, 470
Eq. 2) result in equilibrium carbon profile following the shape of exp(- + )z. The C 471
profile is further influenced by the variation in soil moisture and clay content of the 472
horizons, and the increasing proportion of IOM. In the studied soils, the parameterization 473
of Equation 2 clearly underestimated the decay rates. Authors do agree that "soil C 474
turnover is reduced at depth beyond what is expected from environmental controls" 475
(Koven et al., 2013; Guenet et al., 2013). The invoked processes are organic matter 476
protection by association with soil minerals (von Lützow et al., 2006; Rasmussen et al., 477
2018) and priming effect (Shahzad et al., 2018), which act in interaction. Depth per se is 478
not a process-based variable explaining these effects, and the relevant variables still have 479
to be determined. 480
When comparing the different simulation results to measurements, we see that 481
measurements were better reproduced in cropped land, especially when conventional 482
tillage was considered (lowest MSE), then in pasture (Figures 6 and 7). Under cultivation 483
with conventional tillage, the mean bias of the simulation to the OC stock measurements 484
(estimated by the SB indices) was very small except when considering exponential 485
decrease of the decomposition rate coefficients (Figure 7a). The main error was on the 486
ability of the model to reproduce the shape of the data (LCS), except for the reference 487
simulation, the diffusive bioturbation and the exponential decrease of the decomposition 488
rate coefficients. Instead, on those simulations the magnitude of fluctuation among the 489
simulations were furthest from those of measurements (large SDSD). Almost the same 490
trends in the error partitioning (among SB, SDSD and LCS) were observed for cultivation 491
with reduced tillage. The alternative root density functions represented the data better for 492
both conventional and reduced tillage profiles (Figures 7 a and b). 493
While considering pasture, the error distribution change drastically, errors being mainly 494
due to errors on simulating the magnitude of fluctuation among the measurements 495
(SDSD), secondarily to the mean bias of the simulation of the global OC stocks (SB). The 496
models had however a good ability to reproduce the shape of the data as demonstrated by 497
the small LSC values. At last, increasing the belowground contribution of fresh litter 498
provided the best estimation of the OC stock measurements in the pasture (Figure 7c). The 499
strong difference in the model ability to reproduce the OC total stock between cultivation 500
and pasture can be explained by the parametrization of the RothC module that was the 501
same for the two land uses and better suited for cultivation. 502
503
Candidate descriptors for deep C dynamics modelling - By testing alternative 504
formalisms for the three main processes at the origin of soil C profiles (depth distribution 505
of belowground inputs, soil matter transport and decomposition rates, in these soils with 506
no DOC movement), we could assess the respective weight of each formalism on soil C. We 507
can further discuss the relevant variables for a tentative parameterization. Concerning 508
root inputs, the bi-exponential depth distribution of the roots provides a finer 509
representation of inputs when compared with the mono-exponential, and is more in line 510
with the observation of either biomass (Jobbagy and Jackson, 2000), or young carbon 511
(Balesdent et al., 2018). The single exponential would not bring enough C to the deepest 512
layer, and accordingly would explain deep C stocks only if combined with either strongly 513
reduced carbon decay rates at depth, or carbon input through a diffusion/transport 514
coefficient that would be constant over depth (e.g. Elzein and Balesdent, 1995; Koven et 515
al., 2013). For annual crops, the depth distribution of root input at the annual scale should 516
ideally integrate inputs during plant growth (as eqn. 4 does) and not only final root 517
distribution. At the pluri-annual scale and beyond genotypic drivers, soil moisture 518
(Jobbagy and Jackson, 2000; Balesdent et al., 2018), together with CO2 partial pressure 519
and fertilization, would be relevant variables of rooting and rhizodeposition. A mass 520
mixing with an intensity decreasing with depth, as is described by equation 8 or would be 521
by an equivalent matrix of transfer of matter in between soil layers, is also in line with 522
observations. Finally, decay rates decrease with depth, but with a smaller gradient than 523
those tested in the parameterization of equation 2. One relevant variable for decay rate 524
modifier would be the carbon input flux itself, acting by priming effect (Cheng et al., 2014; 525
Shazhad et al., 2018). Such a choice would not require additional soil input data for 526
modelling. The second category of variables that affect decay rates is the soil mineralogy 527
expressed either as a weathering indice (Finke et al., 2018), or as secondary minerals 528
(Rasmussen et al., 2017). Soil classification can stand for a proxy of mineralogical 529
properties and may be used to constrain decay rates (Batjes, 2014; Mathieu et al., 2015). 530
But soil mineralogy is not static (Basile-Doelsch et al., 2015), and may evolve gradually 531
with pedogenesis (Finke et al., 2018). This evolution of minerals naturally drove the build-532
up of the slow component of SOM over the Holocene, but may also be very rapid under 533
man's pressure: agriculture alkalinize acidic soils by liming, or reversely acidify soils by N-534
fertilization and removal of bases (Guo et al., 2013); global N deposition as well acidifies 535
world soils. Due to these major interactions between the dynamics of carbon and minerals, 536
coupled model of carbon and pedogenesis as proposed in this study represent a step 537
forward. According to the variables we listed, it is furthermore expected that future 538
carbon depth distribution will be affected by changes in landuse, precipitation and NPP. 539
540
3.2 Impact of climate, land use and agricultural practices on OC depth distribution: 541
variability among OC-VGEN settings 542
3.2.1 Impact of land use and agricultural practice change on soil OC storage 543
Agriculture with conventional tillage was used for the spin up scenario thus considered as 544
a reference scenario in this analysis. While simulating 72 years of this land use, small 545
oscillations of climate and C inputs as well as a change of ploughing depth from year 2000 546
occurred. These small changes resulted in small fluctuations of the total OC stock observed 547
whatever the considered formalisms or parameters (Figure 8a). While considering deep 548
OC stocks, the different simulations started to deviate from year 2000 (Figure 8d), most 549
probably due to the more superficial ploughing depth that was applied from that date. For 550
deep OC stocks, the reference model and diffusive bioturbation simulations followed the 551
and the alternative root density function models decreased those stocks by 3.5 % and 553
2.5 % respectively. The depth dependent decomposition rate coefficient simulated a 2.6 % 554
increase of deep OC stocks compared to the reference model. These evolutions are in 555
agreement with the results discussed in the previous section. The depth dependent 556
decomposition rate coefficient increased the OC depth accumulation and thus 557
counteracted the effect of the shallower ploughing on the OC input to the soil. On the 558
opposite, the decrease of the above/belowground ratio of fresh organic matter and the 559
change of root ground formalisms decreased the deep OC stocks. 560
For 10 years of reduced tillage (from year 2000), no differences with the conventional 561
tillage were simulated for the total OC stocks (Figure 8b), while, when considering only 562
deep OC, the deviation among different models became more pronounced. The deep OC 563
stocks simulated by the model with depth dependent decomposition rate coefficient 564
followed more or less the same trend as the total OC stocks, while, for all the other 565
simulations, the deep OC stocks decreased from years after 2000. This decrease reached 566
3 % by the year 2011 for the reference and diffusive bioturbation models, 5 % for the 567
alternative root growth formalisms and up to 10 % for the increased above/below ground 568
input model (Figure 8e). These results showed that a further shallowing of the ploughing 569
depth increased the trends observed after the year 2000 in the case of the agriculture with 570
conventional tillage. Reduced tillage did not increase the total OC stock compared to 571
conventional tillage. While considering the upper 30 cm, a slight increase ranging from 0 572
to 9 % was observed. Most experiments on reduced tillage in the literature were 573
conducted on durations ranging from 0 to 15 years and thus comparable to the 574
experiment considered in this study. Recent meta-analysis (Baker et al., 2007; Bai et al., 575
2018) described no significant change in total OC stock with reduced tillage but a change 576
in soil OC distribution comparable to that obtained in this study. Dimassi et al. (2014) 577
attributed this difference to differences in soil climate (water content notably) due to the 578
tillage practices. Our modelling approach could not reproduce such a difference in soil 579
climate due to tillage reduction; the observed changes in OC stocks were mainly due to 580
change in mixing depth and intensity. 581
For pasture, all the simulations resulted in an increase of 30 to 40 % of total OC stocks 582
after 72 years (Figure 8 c). This increase was more marked while considering the upper 30 583
cm OC stock with an increase ranging from 60 to 90% depending on the model considered. 584
Poeplau et al. (2011) estimated a 100 ± 20% increase in upper 30 cm stock of soils after 585
grassland establishment in temperate regions while the Guo and Gifford (2002) meta-586
analysis, depicted only a 19% increase. Our modelling approach provided a value closer to 587
that of Poeplau et al. (2011). For deep OC stocks (30-120 cm), the situation was more 588
complex. Only the decrease of above ground input simulated an increase of the deep OC 589
stock by about 15 %. The reference model as well as diffusive bioturbation and depth 590
dependent decomposition rate coefficient models simulated no changes of deep OC stocks 591
over the 72 years. Finally, both alternative root density function models simulated a 592
decrease in deep OC stocks ranging from 3 to 7 % after 72 years, the largest decrease 593
being, as expected, for the Jackson et al (1996) formalism (Figure 8f). 594
3.2.2 Impact of two climate change scenarios by the years 2100 on the soil OC storage 595
simulations for three different land use and agricultural practice modalities 596
For cropped profiles, all of the considered formalisms/parametrisations simulated an 597
increase of the total OC storage ranging from 0 to 3 % at the year 2100 (Figures 9 a and b) 598
and up to the 6 % for the depth dependent decomposition rate coefficient simulation. No 599
significant differences (<2 %) were observed between conventional and reduced tillage in 600
terms of simulated OC stocks. For the pasture, the simulations predicted a larger total OC 601
stock increase ranging from 9 to 11% at the year 2100 (Figure 9c). 602
Considering the two IPCC scenarios, the standard deviation of the simulated OC stocks 603
between RPC8.5 and RPC2.5 ranged from 0 to 3 %, as for cropland, whatever the 604
considered model version. 605
For deep OC stocks (30-120cm), the situation was once again more complex. The increase 606
of above/below ground ratio of fresh organic input leaded to a decrease of the deep OC 607
stock by 4 and 11 % for conventional and reduced tillage respectively, as well as the use of 608
an alternative root density function (Zeng, 2001) although to a lesser extent (3 % for both 609
plots). In contrast, the model with depth dependent decomposition rate coefficients 610
increased the deep OC stock to a maximum of 8 % for both cropped plots. The reference 611
model and diffusive bioturbation did not induce a significant change over the simulated 612
period. On cropped profiles, the variations of deep OC stocks related to the formalisms/ 613
parameters used in the model were larger than that of total OC stocks (Figures 9d and e) 614
and were more marked for shallower tillage, while the effect of IPCC scenarios stayed in 615
the range of 3 %. For pasture, most of the simulations predicted an increase in deep OC 616
stocks, with the exception of the simulation with Jackson et al. (1996)’s root density 617
function that resulted in a slight decrease of the deep OC stock. The maximum increases of 618
6 to 9 % for PRC2.6 and RPC8.5 respectively were simulated by the model with higher 619
below ground fresh organic input (Figure 9f). The effect of IPCC scenarios again produced 620
changes in the deep OC stocks ranging from 0 to 3 %. 621
Thus, regardless of the land use or tillage practices, variabilities in the simulated total OC 622
stocks induced by different soil process formalisms/parameters and by the different 623
forcing scenarios (RPC8.5 and RPC2.6) were of same order of magnitude (Figures 9a to c). 624
When considering the deep OC stocks (30-120 cm), the variability induced by the choice of 625
processes/formalisms used was dominant (Figures 9d to f), showing that efforts on 626
calibrating the deep OC transfer processes are needed. 627
Other studies projecting OC stocks over the 21st century only considered the upper 30 cm 628
of the soil (e.g., Smith et al., 2005; Lugato et al., 2014; Wiesmeier et al., 2016). In this study, 629
by introducing new soil processes and the uncertainty related to their knowledge, we 630
showed that the simulated behaviour of deep OC differs substantially from that of top soil 631
OC stocks. We showed that while for the total OC stocks (as well as top 30 cm OC stocks) 632
an increase could be projected considering the suggested climate change scenarios; both 633
an increase and a decrease in deep OC stock are possible over the coming century 634
depending on the formalism/parameter considered in the simulation. 635
Conclusion
637
In this paper, we proposed the first fully modular OC depth distribution model, 638
called OC-VGEN that was shown to be efficient for testing the effect of different numerical 639
representations soil processes on OC depth distribution. We demonstrated that the OC-640
VGEN model include processes that are crucial at a decadal to a century time scale for 641
modelling soil OC stock evolution in Luvisols, notably explicit transfer of water and 642
temperature although only partially for water transfer that remains only indirectly taken 643
into consideration since soil moisture deficit is not directly derived from soil water 644
content at different depths. In addition, transfer of DOC was not considered in this model, 645
since DOC is negligible in the type of soil considered. Nevertheless this process should be 646
added if other soil types as podzols for which this process is dominant had to be modelled. 647
The development of the model under the VSoil modelling plateform should ease this 648
implementation. 649
For the numerical representations tested, namely root depth distribution, bioturbation 650
and OC decomposition rate coefficients, we showed that the simulated OC depth-651
distribution (below 30 cm) was very dependent on the tested formalisms/parameters, 652
while the total soil OC stocks was not. We showed that the use of different soil processes 653
formalisms/parameters had a larger impact on deep OC stock prediction than that of 654
forcing scenarios tested. These forcing scenarios were nevertheless chosen as the extreme 655
cases in the range of possibilities for both land use and climate change. These results 656
demonstrate the need of further calibration of soil processes responsible for the building 657
of deep OC stock in soils. These first results strongly suggest the need for a bioturbation 658
process progressively decreasing with depth and decay rates also decreasing with depth, 659
but with a smaller gradient than the one tested. 660
We proposed here a first modelling approach for OC stock estimation considering most 661
soil processes and their feedbacks. Our study demonstrated that, due to a limited 662
knowledge, considering soil processes added a lot of uncertainties on the soil OC stock 663
projections, notably for the deep soil OC, and thus more effort should be done in 664
evaluating the most reasonable combination of formalisms for soil processes and their 665
parametrization. To do so, this work should be extended to different soil types under 666
different climates in which the hierarchy of the processes could be different, thus allowing 667
better conclusions on the formalisms to be chosen for the different soil processes. Future 668
research with models such as OC-VGEN should especially focus on the above to below 669
ground fresh organic input ratio and on depth-dependent OC decomposition rate 670
coefficients, since OC-VGEN is the most sensitive to these formalisms/parameters. 671
Combining modelling and isotopic tracing approaches, by introducing the isotopes in the 672
models could allow overcoming this limit. 673
674
Acknowledgement
675
This research was conducted in the framework of the Agriped project (ANR-10-BLANC-676
605) and the DeDyCas project (ANR 14-CE01-0004) supported by the French National 677
Research Agency (ANR) and the ASSESS project (ERANETMED2-72-209 ASSESS). 678
S. Keyvanshokouhi received a PhD grant from the French National Institute for 679
Agricultural Research (INRA) and the French agency for environment and energy 680
(ADEME). The authors are grateful to INRA of Mons-en-Chaussee (France) for providing 681
the access to their long-term experimental site and the associated data, to B. Davis for 682
supplying reconstructed temperature and precipitation time series, to Meteo France for 683
providing climatic data from the SAFRAN Grid for the studied site. 684
References
Bai, Z., Caspari, T., Ruiperez Gonzalez, M., Batjes , N.H., Mäder, P., Bünemann, E.K, de Goede, R., Brussaard, L., Xu, M., Santos Ferreira, C.S., Reintam, E., Fan, H., Mihelič, R., Glavan, M., Tóth, Z., 2018. Effects of agricultural management practices on soil quality: A review of long-term experiments for Europe and China. Agriculture, Ecosystems & Environment, 265, 1-7.
Baisden, W. T., Amundson, R., Brenner, D. L., Cook, A. C., Kendall, C., Harden, J. W., 2002. A multiisotope C and N modeling analysis of soil organic matter turnover and transport as a function of soil depth in a California annual grassland soil chronosequence. Global Biogeochemical Cycles, 16, 1135. doi:10.1029/2001GB001823
Baker, J. M., Ochsner, T. E., Venterea, R. T., Griffis, T. J., 2007. Tillage and soil carbon sequestration-What do we really know? Agriculture, Ecosystems and Environment, 118, 1-5. doi:10.1016/j.agee.2006.05.014
Balesdent, J., Basile-Doelsch, I., Chadoeuf, J., Cornu, S., Derrien, D., Fekiacova, Z., Hatté, C, 2018. Atmopshere-soil carbon transfer as a function of soil depth. Nature, 559, 599–602. doi:10.1038/s41586-018-0328-3
Basile-Doelsch, I., Balesdent, J., Rose, J. 2015. Are interactions between organic compounds and nanoscale weathering minerals the key drivers of carbon storage in soils? Environmental Science & Technology 49, 3997−3998
Batjes, N., 2014. Total carbon and nitrogen in the soils of the world. European Journal of Soil Science, 65, 4-21.
Boizard, H., Yoon, S. W., Leonard, J., Lheureux, S., Cousin, I., Roger-Estrade, J., Richard, G., 2013. Using a morphological approach to evaluate the effect of traffic and weather conditions
on the structure of a loamy soil in reduced tillage. Soil and Tillage Research, 127, 34-44. doi:10.1016/j.still.2012.04.007
Braakhekke, M. C., Beer, C., Hoosbeek, M. R., Reichstein, M., Kruijt, B., Schrumpf, M., Kabat, P., 2011. SOMPROF: A vertically explicit soil organic matter model. Ecological Modelling, 222, 1712-1730. doi:10.1016/j.ecolmodel.2011.02.015
Brimo, K., Garnier, P., Lafolie, F., Séré, G., Ouvrard, S., 2018. In situ long-term modeling of phenanthrene dynamics in an aged contaminated soil using the VSOIL platform. Science of the Total Environment, 619–620, 239–24.
Camino-Serrano, M., Guenet, B., Luyssaert, S., Janssens, I. A. 2018. ORCHIDEE-SOM: Modeling soil organic carbon (SOC) and dissolved organic carbon (DOC) dynamics along vertical soil profiles in Europe. Geoscientific Model Development 11, 937-957.
Campbell, E. E., Paustian, K., 2015. Current developments in soil organic matter modeling and the expansion of model applications: a review. Environmental Research Letters, 10, 123004. doi:10.1088/1748-9326/10/12/123004
Canadell, J., Jackson, R. B., Ehleringer, J. B., Mooney, H. A., Sala, O. E., Schulze, E.-D., 1996. Maximum rooting depth of vegetation types at the global scale. Oecologia, 108, 583-595. doi:10.1007/BF00329030
Cannavo, P., Lafolie, F., Nicolardot, B., Renault, P., 2006. Modelling seasonal variations in CO2 and N2O concentrations with a model describing C and N behaviour in the vadose zone. Vadoze Zone Journal, 5, 990-1004.
Cassini, C. F., 1750. Composite: Carte de France. Carte de France. Levee par ordre du Roy. Retrieved from http://www.davidrumsey.com/xmaps10000.html
Cheng, W., Parton, W. J. ,Gonzalez-Meler, M. A., Phillips, R., Asao, S., McNickle, G. G., Brzostek, E., Jastrow, J. D. 2014, Synthesis and modeling perspectives of rhizosphere priming. New Phytol. 2014 Jan;201(1):31-44. doi: 10.1111/nph.12440.
Coleman, K., Jenkinson, D. S., Crocker, G. J., Grace, P. R., Klír, J., Körschens, M., Poulton, P.R., Richter, D.D., 1997. Simulaing trends in soil organic carbon in long-term experiments using RothC-26.3. Geoderma, 81, 29-44. doi:10.1016/S0016-7061(97)00079-7
Davidson, J., Graetz, D., Rao, P., Selim, H., 1978. Simulation of nitrogen movement, transformation and uptake in plant root zone. (1978, Ed.)
Dimassi, B., Mary, B., Wylleman, R., Labreuche, J., Couture, D., Piraux, F., Cohan, J.-P., 2014. Long-term effect of contrasted tillage and crop management on soil carbon dynamics during 41 years. Agriculture, Ecosystems & Environment, 188, 134-146. doi:10.1016/j.agee.2014.02.014
Elzein, A., Balesdent, J., 1995. Mechanistic Simulation of Vertical Distribution of Carbon Concentrations and Residence Times in Soils. Soil Science Society of America Journal, 59, 1328-1335. doi:10.2136/sssaj1995.03615995005900050019x
Finke, P. A., 2012. Modeling the genesis of luvisols as a function of topographic position in loess parent material. Quaternary International, 265, 3-17. doi:10.1016/j.quaint.2011.10.016
Finke, P. A., Hutson, J. L., 2008. Modelling soil genesis in calcareous loess. Geoderma, 145, 462-479. doi:10.1016/j.geoderma.2008.01.017
Finke, P., Opolot, E., Balesdent, J., Berhe, A. A., Boeckx, P., Cornu, S., Harden, J., Hatté, C., Williams, E., Doetterl, S.. 2018. Can SOC modelling be improved by accounting for pedogenesis? Geoderma, accepted.
Gale, M. R., Grigal, D. F., 1987. Vertical root distributions of northern tree species in relation to successional status. Canadian Journal of Forest Research, 17, 829-834. doi:10.1139/x87-131
Guenet, B., Eglin, T., Vasilyeva, N., Peylin, P., Ciais, P., Chenu, C., 2013. The relative importance of decomposition and transport mechanisms in accounting for soil organic carbon profiles. Biogeosciences, 10, 2379-2392. doi:10.5194/bg-10-2379-2013
Guo, J. H., Liu, X.J., Zhang, Y., Shen, J. L., Han, W. X., Zhang, W. F., Christie, P., Goulding, K. W. T., Vitousek, P. M., Zhang, F. S., 2010. Significant Acidification in Major Chinese Croplands Science, 327,1008-1010
Guo, L. B., Gifford, R. M., 2002. Soil carbon stocks and land use change: a meta analysis. Global Change Biology, 8, 345-360. doi:10.1046/j.1354-1013.2002.00486.x
Haddaway, N. R., Hedlund, K., Jackson, L. E., Kätterer, T., Lugato, E., Thomsen, I. K., Jørgensen, H.B., Isberg, P.-E., 2016. How does tillage intensity affect soil organic carbon? A systematic review protocol. Environmental Evidence, 5, 1-1. doi:10.1186/s13750-016-0052-0
He, Y., Trumbore, S.E, Torn, M.S., Harden, J.W., Vaughn, L.J.S., Allison, S.D., Randerso, J.T., 2016. Radiocarbon constraints imply reduced carbon uptake by soils during the 21st century. Science 353, 1419-142.
Hilinski TE (2001) ‘Implementation of exponential depth distribution of organic carbon in the CENTURY Model. CENTURY soil organic matter model user’s manual.’ (Department of Soil and Crop Sciences, Colorado State University: Fort Collins, CO).
Hutson, J. L., 2003. Leaching Estimation and Chemistry Model: A Process-Based Model of Water and Solute Movement, Transformations, Plant Uptake, and Chemical Reactions in the Unsaturated Zone. Department of Crop and Soil Sciences, Cornell University, Ithaca.
Jackson, R. B., Canadell, J., Ehleringer, J. R., Mooney, H. A., Sala, O. E., Schulze, E. D., 1996. A global analysis of root distributions for terrestrial biomes. Oecologia, 108, 389-411. doi:10.1007/BF00333714
Jagercikova, M., Evrard, O., Balesdent, J., Lefèvre, I., Cornu, S., 2014. Modeling the migration of fallout radionuclides to quantify the contemporary transfer of fine particles in Luvisol profiles under different land uses and farming practices. Soil and Tillage Research, 140, 82-97. doi:10.1016/j.still.2014.02.013
Janik, L., Spouncer, L., Correll, R., Skjemstad, J., 2002. Sensitivty analysis of the RothC carbon model. National Carbon Accounting System technical report; No. 30. ISSN: 14426838
Jarvis, N. J., Taylor, A., Larsbo, M., Etana, A., Rosén, K., 2010. Modelling the effects of bioturbation on the re-distribution of 137Cs in an undisturbed grassland soil. European Journal of Soil Science, 61, 24-34. doi:10.1111/j.1365-2389.2009.01209.x
Jenkinson, D. S., Coleman, K., 2008. The turnover of organic carbon in subsoils. Part 2. Modelling carbon turnover. European Journal of Soil Science, 59, 400-413. doi:10.1111/j.1365-2389.2008.01026.x
Kobayashi, K., Salam, M. U., 2000. Comparing simulated and measured values using mean squared deviation and its components. Agron. J., 92(2), 345–352, doi:10.2134/agronj2000.922345x
Koven, C. D., Riley, W. J., Subin, Z. M., Tang, J. Y., Torn, M. S., Collins, W. D., Bonan, G. B., Lawrence, D. M., Swenson, S. C., 2013. The effect of vertically resolved soil biogeochemistry and