READ THESE TERMS AND CONDITIONS CAREFULLY BEFORE USING THIS WEBSITE. https://nrc-publications.canada.ca/eng/copyright
Vous avez des questions? Nous pouvons vous aider. Pour communiquer directement avec un auteur, consultez la
première page de la revue dans laquelle son article a été publié afin de trouver ses coordonnées. Si vous n’arrivez pas à les repérer, communiquez avec nous à [email protected].
Questions? Contact the NRC Publications Archive team at
[email protected]. If you wish to email the authors directly, please see the first page of the publication for their contact information.
NRC Publications Archive
Archives des publications du CNRC
This publication could be one of several versions: author’s original, accepted manuscript or the publisher’s version. / La version de cette publication peut être l’une des suivantes : la version prépublication de l’auteur, la version acceptée du manuscrit ou la version de l’éditeur.
Access and use of this website and the material on it are subject to the Terms and Conditions set forth at
Monitoring of aircraft operation using statistics and machine learning
Famili, Fazel; Létourneau, Sylvain
https://publications-cnrc.canada.ca/fra/droits
L’accès à ce site Web et l’utilisation de son contenu sont assujettis aux conditions présentées dans le site LISEZ CES CONDITIONS ATTENTIVEMENT AVANT D’UTILISER CE SITE WEB.
NRC Publications Record / Notice d'Archives des publications de CNRC:
https://nrc-publications.canada.ca/eng/view/object/?id=97b10db1-e953-4213-853e-f52e1c41f30e https://publications-cnrc.canada.ca/fra/voir/objet/?id=97b10db1-e953-4213-853e-f52e1c41f30eNational Research Council Canada Institute for Information Technology Conseil national de recherches Canada Institut de Technologie de l’information
Monitoring of Aircraft Operation using Statistics and
Machine Learning*
A. Famili and S. Letourneau
December 1999
Copyright 1999 by
National Research Council of Canada
Permission is granted to quote short excerpts and to reproduce figures and tables from this report, provided that the source of such material is fully acknowledged.
*
published in Proceedings of the IEEE Conference ICTAI-99, Chicago.Abstract
This paper describes the use of statistics and machine learn-ing techniques to monitor the performance of commercial air-craft operation. The purpose of this research is to develop methods that can be used to generate reliable and timely alerts so that engineers and fleet specialists become aware of abnormal situations in large fleet of commercial aircraft that they manage. We introduce three approaches that we have used for monitoring engines and generating alerts. We also explain how additional information can be generated from machine learning experiments so that the parameters influ-encing the particular abnormal situation and their ranges are also identified and reported. Various benefits of fleet monitor-ing are explained in the paper.
Keywords: trend monitoring, statistical techniques, data par-titioning, machine learning
1. Introduction
Today’s aerospace industry, like many other industries, is overwhelmingly dominated by generation and acquisition of large amounts of data in all departments. This data consists of several types, three of which are: (i) texts generated by people (such as conditions of a system observed and related actions taken), (ii) strings of automatically generated messages (such as an electronic message related to a particular condition of operation of the aircraft), and (iii) parametric data acquired through on-board sensors and computers (such as symbolic and numeric parameters representing snap-shots of many parameters related to a system such as engine). Most of this data is not properly used for on-line or in-depth analysis of the aircraft operation unless there is a specific situation where there is a need for that. Examples are major breakdowns or drastic system behavior changes. Even then, only historical data may be used for certain type of problems for which engi-neers are interested to perform some data analysis.
Over the last ten years, there have been many advances in data integration, data warehousing, data analysis, and discovery of useful knowledge from large databases. Examples are several
data analysis projects within large organizations such as NASA[8], data analysis tools that have become commer-cially available [3 and 5], and other research projects [7 and 9]. Almost all commercial data analysis tools assume that the data collected from a particular process can be eas-ily analyzed, trends and patterns are correctly recognized and any discoveries are presented to the user in an under-standable way. Aerospace is one of the domains in which these assumptions are not valid. In addition, the assump-tion is that all users have sufficient knowledge and time to acquire the data, use these tools and go through the ordi-nary process of data analysis [2 and 6] in order to discover useful knowledge that they need. Aerospace industry is another exception where in most departments it is difficult to expect engineers and technicians to follow this path. Several reasons exist: (i) all the data may not be integrated into one database management system, (ii) engineers and operators do not have sufficient time to analyze huge amounts of data, unless there is an urgent requirement, (iii) complexity of the data analysis process in most cases is beyond the ordinary tools that they have access to, (iv) there is no well defined automated mechanism to extract, pre-process and analyze the data, and summarize the results so that the engineers and technicians can use it, and (v) even when there are tools available for data analysis, these tools are specific for certain tasks defined by the ven-dors.
What is important in today’s aerospace industry, in particu-lar in the operation and maintenance of commercial air-craft, is that all systems (e.g. auxiliary power units, main engines) for which data is available, can be continuously monitored. The monitoring is performed so that the spe-cialists are informed of conditions:
• where there is a deviation in the range of one or more parameters (such as exhaust gas temperature), compar-ing to an expected level,
• when there is an abnormal behavior in the operation of a system (such as an upward or a downward trend in certain performance parameters) that may cause per-formance deterioration of one or more systems.
Monitoring of aircraft operation using statistics
and machine learning
Fazel Famili and Sylvain Létourneau
Institute for Information Technology, National Research Council Canada Ottawa, Ont. K1A 0R6 Canada
The engineers and fleet specialists may benefit by paying attention only to the aircraft that are operating abnormally. The specialists can then investigate the cases (alerts), pre-vent possible damages to any systems or components, rec-tify the problem and if possible, find out the reason for trends that are presented in the form of alerts. In this paper, we introduce an approach to recognize the aircraft or engines that behave abnormally. We also show how machine learning techniques can be used to provide further insights about a specific abnormal situation. Preliminarily results are presented.
Abnormal behavior may sometimes be related to specific aircraft components. We address this problem in a related work in which we explain how machine learning can be used to build models that predict problems with aircraft components before they become non operational [4]. The two approaches provide complementary solutions to sup-port engineers and aircraft fleet specialists in the mainte-nance of commercial aircraft.
The structure of this paper is as follows. In Section 2 we describe the domain and explain the problem. In Section 3 we give an overview of our approach to the problem of per-formance monitoring. Section 4 includes the experimental results and Section 5 contains the validation process. We conclude the paper in Section 6.
2. Description of Domain and Statement of
Problem
The domain of this research is aerospace for which data is generated during the operation and maintenance of a large fleet of modern commercial aircraft. In addition to the pre-liminary data preparation and warehousing (i.e. converting the raw data to proper format and storing it in appropriate tables), there is additional pre-processing to ensure that the results of data analysis are meaningful. The data preproc-essing involves: (i) corrections of certain parameters to take into account flight conditions, (ii) handling missing attributes, and (iii) eliminating out-of-range data. Since data comes from all parts of the fleet, there are several levels of granularity for fleet monitoring, three of which are listed below:
• monitoring at the aircraft level (where one or more air-craft may be monitored),
• monitoring at the system level (where one or more engines may be monitored),
• monitoring at the duration level (where certain duration/ phase of operation of a system such as an engine may be monitored).
What is also important in this research is that the data repre-sentation space is spanned over descriptors such as
attributes, variables, terms, relations, or transformations that are used to describe various sources of information. It is therefore crucial to properly transform the data to provide a new representation space so that no useful information is lost and one would be able to properly monitor the aircraft. The volume of data is about 1 MB per aircraft per month. The nature of trends and patterns in the data may be in vari-ous forms: (i) linear trends, (ii) transient/impulse trends, (iii) step function trends, (iv) cyclic/occasional trends, (v) ramp trends, and (vi) hidden patterns. This variation in trends and patterns makes the monitoring task even more complex. In addition, one has to keep in mind that for any alerts to be meaningful, they have to be: (i) accurate, (ii) timely, and (iii) be accompanied by some forms of explana-tion and confidence. Otherwise the users will ignore the alerts.
In addition, it would be ideal that any statistical and machine learning techniques developed, are universal so that they will be able to discover as many trends and pat-terns listed above. Fine tuning of the approach (e.g. adjust-ing the thresholds based on the domain expert’s information) should also be possible. A variety of approaches to trend analysis have been listed in the litera-ture [1].
3. Overview of the approach
In this section, we first discuss the three approaches for fleet monitoring of the aircraft parametric data. Following that we explain the process of analyzing data using machine learning techniques and the reason for doing this. The approaches developed in this research will be evaluated as part of our effort to build a data mining system, one of its responsibilities is to monitor a large fleet of commercial air-craft. The following diagram illustrates the overall process of fleet monitoring.
The data generated by the aircraft is first pre-processed and stored in a database. The pre-processing is performed so that a more accurate representation space is used by the fleet monitoring and machine learning components. This is important so that as many relevant attributes as possible are used for the monitoring process and a useful level of preci-sion is applied for the attribute values. The pre-processed data that now contains new features (explained in Section 3.3 and 3.4) is provided to the fleet monitoring component which searches for trends and other information related to abnormal behaviors of aircraft systems. Alerts generated through this process are presented to the users (engineers and fleet specialists) for their attention. Different actions may be taken on each alert. One possible action for the user is to request further information about the cause of a
devia-tion or trend in the data. Following are three approaches for fleet monitoring and trend recognition in the data.
3.1 Single variable monitoring
In this approach, the incoming data is monitored for a spe-cific window size (number of cases) to search for certain alert conditions based on the normalized threshold for any single parameter. The normalized threshold is calculated as described in Section 3.4. An alert (Α) is therefore a function of
:
A simple example of an alert condition (ac) is percent of exceedence from current normalized threshold. The param-eters ws and wo are determined through experiments. Dif-ferent alert conditions may require difDif-ferent values for these two parameters.
3.2 Multivariate monitoring
In this approach, the incoming data is monitored for spe-cific windows in which one would search for certain alert conditions based on the current normalized thresholds of all parameters of interest. This approach allows for monitoring of a conjunction of all, or disjunction of a number of param-eters at any time. Individual normalized thresholds, as described in Section 3.4, will be used in this approach. An alert (Α) is therefore a function of
:
The ombination expression (ce) is the logical expression for combining ac1, ac2, ... acn.
Α = f (p, ws, wo, nt, ac)
where: p = parameter of interest, ws = window size (number of cases), wo = window overlap,
nt = current normalized threshold, ac = alert condition.
(1)
Α=f[(p1,ws,wo,nt1,ac1),(p2,ws,
wo,
nt2, ac2), ... (pn,ws,wo,nti,acn),
ce] where: pi = ith parameter of interest,
ws= window size (number of cases), wo= window overlap,
nti= current normalized threshold for parameter i
,
aci=alert condition for parameter i, ce = combination expression,
n = number of parameters of interest.
(2)
3.3 Multivariate - multipartitioning
In this approach, the incoming data is monitored for spe-cific windows, where each window is further partitioned into smaller windows of equal size. Figure 2 shows a win-dow of size Ws partitioned into 5 equal size winwin-dows (ws1,
ws2, ws3, ws4, and ws5). New sets of dimensionless
attributes that are derived from this partitioning process are used for trend recognition. A simple example of a new dimensionless attribute is the ratio of positive cases between all possible smaller windows (wsi) of any Ws. A positive case is the one that meets certain trend criteria. The total number of dimensionless attributes (da) for any trend criteria is:
where np is the number of partitions. For example, for np = 5, da = 1+2+3+4 =10.
A trend T is therefore a function of the following parame-ters for as many condition or performance parameparame-ters that are of interest:
An example of a condition parameter is engine-exhaust-gas-temperature (EGT) and an example of a performance parameter is fuel-flow (FF).
3.4 Calculating normalized thresholds
Normalized thresholds are calculated so that the effects of parameters such as system operation, system age and other operation characteristics of a given airline are taken into account. The normalized threshold is the expected marginal value of a given parameter. A simple example of calculating a normalized threshold for an engine related parameter is as follows: when a new window is opened, for a given param-eter (p), fleet-mean, engine-mean, fleet-standard-deviation,
and engine-standard-deviation are calculated for the last
365 days of data. This includes the data from the new win-dow. These parameters are then used to calculate normal-ized threshold for each parameter.
3.5 Machine Learning data analysis
A trend or an alert can be further investigated. The objective is to use Machine Learning techniques in order to provide additional information about the alerts generated in terms of other available parameters. The user simply selects the period of time and alert type for which he/she wants to have additional information. Then, the machine learning compo-nent would perform the following: i) retrieves all data gen-erated over that period of time, ii) labels the instances as either positive and negative based on the information used to define the alert (see Sections 3.1 to 3.3), and iii) runs a rule extraction algorithm which generates rules that explain, among all the available independent parameters, which ones were influencing the process that resulted in any trends or alerts. The machine learning component also provides the expected performance of the set of rules generated. The expected performance is computed by a 5 folds cross-vali-dation experiment.
4.0 Experimental results
This section includes the results of three experiments that we performed to evaluate the three approaches listed in per-vious section. The data used for these experiments was accumulated from the operation of 32 Airbus A-320 aircraft for approximately 2 years. We focused on main engines that generate most of our parametric data.
da i i=1 np–1
∑
= (3) Ws ws1 ws2 ws3 ws4 ws5Figure 2: Window partitioning approach
T = f[(p1,ws,wo,np,nt1,tc1), (p2,ws,
wo,np,nt2,tc2),...(pn,ws,wo,np
,
ntn, tcn), ce]where: pi=ith parameters of interest, ws = window size (number of cases), wo = window overlap,
np = number of partitions,
nti = current normalized threshold for parameter i,
tci = trend criteria for parameter i, ce = combination expression,
n = number of parameters of interest.
(4)
normalized-threshold-p = ((fleet-mean-p +
engine-mean-p)/2)± (X * (fleet-standard-deviation-p + engine-standard-deviation-p)/2)
where: p = parameter of interest X = threshold adjustment based on the standard deviation
4.1 Single variable monitoring
In this approach, one of the main performance parameters of the aircraft engines (Fuel Flow) was used as an example for fleet monitoring. The data was collected from a total of 74 engines operated for two years. Based on the domain expert’s recommendation, appropriate alerts were generated every two weeks so that fleet specialists could be aware of engines with high fuel consumption twice a month. Percent of exceendence was used for alert conditions. The threshold adjustment of 1.5 (in Equation 5) was used for current nor-malized threshold. Figure 3 shows alerts (vertical lines on this figure) generated for an engine that was statistically high on fuel consumption during that year. A proportionally smaller number of alerts were obtained with lower fuel con-sumption.
4.2 Multivariate monitoring
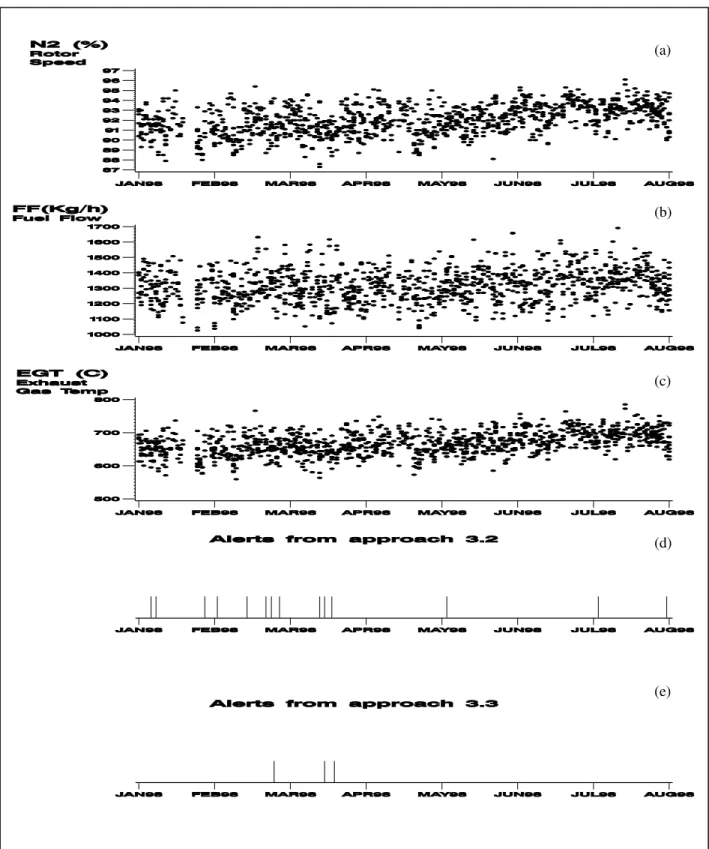
Performance monitoring of many systems, such as aircraft engines, is not always based on one parameter. There are several cases in which a system deterioration or failure may be linked to a conjunction or disjunction of several parame-ters. In this case, based on the recommendations of domain experts, we monitored three engine parameters (engine core speed (N2), Fuel Flow (FF), and Engine Gas Temperature (EGT)) that are related to a particular system failure within the engines. Figure 4(a, b, and c) show the actual values for the above three parameters for one engine that had a poten-tial for the failure of this particular system. Alerts obtained from the Multivariate monitoring approach using this data are shown in Figure 4(d). As part of the experimentation, we also applied this approach on data obtained from 74 engines over one year of operation. We are now validating the results using the approach explained in Section 5.
4.3 Multivariate - Multipartitioning
We also monitored the 3 parameters discussed above using the Multivariate-Multipartitioning approach. The alerts obtained from the same engine as above are shown in Fig-ure 4(e). The combination expression (ce) was a conjunc-tion of the condiconjunc-tions. We observed that the alerts obtained from Multivariate-Multipartitioning approach appeared in a period where we got a high number of alerts from Multivar-iate approach.
As explained in Section 3.3, the Multivariate-Multipartition-ing approach uses many parameters. In order to decide on the most suitable settings of these parameters, we performed a total of 10 experiments with ws = 40, 60, 80, and 100; wo = 20, 30, 40, and 50; and np = 4, 6, and 8. As an example of trend criteria (tc), percent positive ratio of .5 and .6 were used.
4.4 Machine Learning
In this section, we report the results obtained from a machine learning analysis of the alerts presented in Figure 4. All instances obtained from the beginning of January 97 to the end of August 97 (total of 478 instances) have been used. Instances for which the values of N2, FF, and EGT have exceeded their corresponding thresholds have been classified as positive instances and all others as negative instances. About 30 independent parameters have been used. The rule extraction algorithm used came up with the following explanations:
There are no alerts when any of the following conditions are true:
• N1≤ 88.2 and VBV_POSN≤ 31.7 and RAC > 21 • N1≤ 87.4
(a)
(b)
(c)
(d)
(e)
Figure 4: Alerts from approaches 2 and 3 (Sections 4.2 & 4.3) using three engine performance parameters. Plots (a), (b) and (c) show the data from three engine parameters and plots (d) and (e) show when the alerts have been generated using each approach.
• N1≤ 88.9 and P3≤ 124.2 • P3≤ 119.1
• T3 > 434.4
There are alerts when any of the following conditions are true:
• N1 > 88.2 and N1≤88.9 and T25≤59 and P3 > 124.2 and N2_VIB > 2
• N1 > 88.9 and P3 > 119.1 and T3≤ 434.4
• N1≤88.2 and P3 > 119.1 and T3≤434.4 and RAC≤21 and PHASE_AN > 72
Parameters such as N1, VBV_POSN, and RAC, etc. are independent parameters.
In addition, a 5 folds cross-validation experiment indicated that the expected error rate of this set of rules is 5.64% with a 95% confidence interval of [4.17%, 9.38%]. These expla-nations greatly help fleet specialists to focus their attention on important parameters for the given problem and their related thresholds. In particular, these explanations may help finding proper adjustments for internal parameters of the engine so that its operation is within the normal bounda-ries.
5.0 Validation process
The overall objectives of the validation process are: • to evaluate the accuracy and timeliness of the alerts, • to investigate the association between the alerts and
other available information (such as reports of symp-toms and repair actions taken). This would help in understanding if the extent of a damage could have been prevented providing the alerts had been generated a head of time,
• to link the alerts to other parametric data, and the results of machine learning application,
• to investigate how can the whole process be fine tuned so that it is used for a variety of parameters.
The validation process is fairly complex. Although there are several types of information available that may be used in validating the alerts, they may not always lead to a useful validated case. Most steps of the validation process are manual. The following are three possibilities:
5.1 Validation through documented cases and actions
This process involves use of all the available documenta-tions that are generated when symptoms are detected, observations made, and any repair actions taken. Several
types of documents exist, some of which may be on-line and others in hard copy. The idea is that, once an alert is selected for validation process, all the available documenta-tions are used so that the usefulness and accuracy of the alert is validated. The span of validation depends on the system alert. This form of validation may be primarily done on the existing data (e.g. over one year of data) for which one would be able to compare a series of alerts generated for one aircraft with all the related repair actions. The result of this form of validation is that if an alert related to a sys-tem deterioration was generated a head of time, how could it have effected the scope of the system deterioration.
5.2 Validation through search in other parametric data such as divergence reports
There are several types of divergence reports that are auto-matically generated under specific operating conditions of the aircraft. Engine Gas Path Advisory report is an example which is generated when an exceedence of certain engine parameters or an abnormal situation occurs. A comparison between these reports and the alerts would reveal: (i) the consistency between the on-board computers and the alert-ing systems, and (ii) the timeliness of alerts if they were generated in advance and would have been useful for cer-tain cases.
5.3 Use of fleet parameter statistics
In this approach, the overall engine/aircraft/fleet statistics are used to evaluate the validity of the alerts. An example is to compare and associate the engines with the highest number of alerts with the statistics representing the per-formance of the engine. Fuel consumption, one of the parameters that is available in several reports, is one of the examples in which the alerts can be validated through over-all fleet statistics. Engines with the highest fuel consump-tion should have the highest number of alerts.
5.4 Validation through consultation with domain experts
Alert summaries can be presented to domain experts who would be a valuable source for validation. This usually involves preparing overall statistics and building case stud-ies that include all the available information (such as the ones listed in 5.1 and 5.2). This approach should also include results of machine learning data analysis which explain the relationship between certain operation parame-ters and particular conditions for which alerts were gener-ated.
6.0 Conclusion
In this paper we have discussed the importance of fleet monitoring using aircraft parametric data that is extensively available in the operation of modern aircraft. We have pro-posed and performed experiments on three fleet monitoring approaches that involved statistics and machine learning. Both univariate and multivariate approaches have been introduced. These approaches make use of a number of parameters to control the data partitioning (joint and dis-joint), the computation of normalized thresholds, and the logical combination of the alert conditions. These parame-ters give a lot of flexibility to the proposed approaches, which allow proper tuning of the system so that an appro-priate number of timely alerts are generated. Another major benefit of these approaches is that we can continuously adjust our normalized thresholds based on the airline method of operation and desire to customize their alert gen-eration system.
The approaches proposed in this research are being incor-porated into a fleet monitoring software prototype that we are building for a major Canadian airline. The software is being evaluated by fleet specialists and engineers of the air-line. We think that the three approaches proposed can be further exploited, as they have shown very promising results. The use of Machine Learning techniques to auto-matically generate explanations for the alerts obtained is of particular interest to the end users.
And finally, in comparison with what engineers and fleet specialists are currently doing in order to monitor aircraft operation, our approach would be able to: (i) save a lot of their time, by bringing to their attention the problematic cases rather than expecting them to continuously look at the entire operation (i.e. particular engines that are operating abnormally because of certain conditions), (ii) provide sup-port for a standard, objective, and yet very flexible way of monitoring as many systems of the aircraft as desired, all by one integrated fleet monitoring system.
7.0 References
[1] D. Berllinger, Trend Analysis: Time Series and Point Process Problems, Envirometrics, Vol. 5(1), 1994, pp. 1-19. [2] U. Fayyad, G. Piatetsky-Shapiro, and P. Smyth, From Data Mining to Knowledge Discovery, in Advances in
Knowledge Discovery and Data Mining, U. Fayyad, et. al.
(Eds.), AAAI/MIT press, 1996.
[3] M. King and J. Elder, Evaluation of Fourteen Data Min-ing Tools, ProceedMin-ings of IEEE International Conference
on Systems, Man and Cybernetics, Oct. 11-14, 1998, pp.
2927-2932.
[4] S. Létourneau, A. Famili, and S. Matwin, Data Mining For Prediction of Aircraft Component Failure, IEEE
Intelli-gent Systems: Special Issue on Data Mining. (to appear, Fall
1999).
[5] J. Mena, Automatic Data Mining, PC AI, Vol. 10, No. 6, 1996, pp. 16-20.
[6] H. Mannila, Data Mining: Machine Learning, Statistics, and Databases, Proceedings of 8th International
Confer-ence on Statistics and Scientific Database Management,
Stockholm, 1996, pp. 2-8.
[7] V.C Patel, etal. Gas turbine engine condition monitoring using statistical and neural network methods,
IEE-Collo-quium-(Digest). No. 260, IEE, Stevenage, England, 1997,
pp. 1-6.
[8] P. Stolorz, E. Mesrobian, R. Muntz, J.R. Santos, E. Shek, J. Yi, C. Mechoso and J. Farrara, Fast Spatio-Tempo-ral Data Mining from Large Geophysical Datasets, Pro-ceedings of the 1st Int. Conf. on Knowledge Discovery and
Data Mining, Montréal, Québec, Canada, Aug. 1995.
[9] G. Torella, G. Lombardo. Neural networks for the diag-nostics of gas turbine engines, Proceedings of the 1996
ASME Turbo Asia Conference,
American-Society-of-Mechanical-Engineers-(Paper), New York, NY, USA, 1996, pp. 1-11.