HAL Id: insu-00534729
https://hal-insu.archives-ouvertes.fr/insu-00534729
Submitted on 28 Jan 2011HAL is a multi-disciplinary open access archive for the deposit and dissemination of sci-entific research documents, whether they are pub-lished or not. The documents may come from teaching and research institutions in France or abroad, or from public or private research centers.
L’archive ouverte pluridisciplinaire HAL, est destinée au dépôt et à la diffusion de documents scientifiques de niveau recherche, publiés ou non, émanant des établissements d’enseignement et de recherche français ou étrangers, des laboratoires publics ou privés.
The carbon dioxide solubility in alkali basalts: an
experimental study
Priscille Lesne, Bruno Scaillet, Michel Pichavant, Jean-Michel Bény
To cite this version:
Priscille Lesne, Bruno Scaillet, Michel Pichavant, Jean-Michel Bény. The carbon dioxide solubility in alkali basalts: an experimental study. Contributions to Mineralogy and Petrology, Springer Verlag, 2011, 162 (1), pp.153-168. �10.1007/s00410-010-0585-0�. �insu-00534729�
The carbon dioxide solubility in alkali basalts: an experimental
study
PRISCILLE LESNE 1,*, BRUNO SCAILLET 1, MICHEL PICHAVANT1, JEAN-MICHEL BENY1
1CNRS/INSU-Université d’Orléans-Université François Rabelais Tours, UMR 6113, Institut
des Sciences de la Terre d'Orléans, 1A, rue de la Férollerie, 45071 Orléans Cedex 02, France *Corresponding author:
e-mail: [email protected]
present address: Department of Earth Sciences, University of Bristol, Wills Memorial Building, Queens Road, Bristol, BS8 1RJ, U.K.
Abstract:
Experiments were conducted to determine CO2 solubilities in alkali basalts from Vesuvius,
Etna and Stromboli. The basaltic melts were equilibrated with nearly pure CO2 at 1200°C
under oxidizing conditions, and at pressures ranging from 269 to 2060 bars. CO2 solubility
was determined by FTIR measurements. The results show that alkalis have a strong effect on the CO2 solubility and confirm and refine the relationship between the compositional
parameter Π devised by Dixon (1997) and the CO2 solubility. A general thermodynamic
model for CO2 solubility in basaltic melts is defined for pressures up to 2 kbars. The new CO2
solubility model yields saturation pressures lower by as much as 50% relative to existing models when applied to volatile-rich alkali basalts.
Introduction
Dissolved volatiles in silicate melts dramatically influence the physical properties of magmas, such as density, viscosity, vesiculation, and largely control eruptive styles. Volatiles exsolve from melts into bubbles as magmas rise toward the earth’s surface and depressurize (e.g., Blank et al., 1993). Such a process may give rise to explosive eruptions, leading to important human and material damages, and may have a major impact on the global Earth climate (Robock 2000). Water is generally the most abundant volatile in terrestrial magmas, CO2
being the second most common species, notably in mafic compositions. Thus, understanding the thermodynamics of CO2 in silicate melts can provide important constraints on the
behaviour of basaltic reservoirs, the ensuing eruptive processes, and ultimately on the evolution of planetary degassing. To model basalt degassing during volcanic eruptions, a detailed knowledge of the mixing properties of volatile components in both fluid and melt is required since, because of its low solubility, carbon dioxide is usually a major component of the gases escaping from magmas as they rise through the crust.
Experiments on CO2 solubility in basaltic melts have been performed mostly at high pressures
where dissolved CO2 contents may reach several wt% (>10 kbar, Blank and Brooker, 1994,
Morizet et al., 2002). At lower pressures, efforts have mainly focused on silicic liquids and only a few studies have been performed on CO2 solubility in basaltic melts (e.g., Pawley et
al., 1992, Dixon et al., 1995, Jendrzejewki et al., 1997; Behrens et al., 2009). As pointed out by Stolper and Holloway (1988), this gap of knowledge reflects in part the small influence of CO2 on solid-liquid phase equilibria at low pressures, due to its low solubility in most silicate
melts under such conditions. Another reason is the technical difficulties associated with the need to work at the high temperature conditions required for mafic compositions (e.g., Berndt et al., 2002; Di Carlo et al., 2006; Behrens et al., 2009), in particular in the mid pressure range (2-6 kbar) where solid pressure media, such as piston cylinders, are not routinely operated. More specifically, the low viscosity of mafic melts requires them to be fast quenched to prevent their crystallisation during cooling. This demands the implementation of appropriate experimental designs in gas pressure vessels (Holloway et al., 1992; Roux and Lefevre, 1992) and, for H2O-bearing basalts, such devices may still fail to properly quench liquids to glasses
(e.g., Behrens et al., 2009). As a consequence of these technical difficulties, the number of high quality solubility data in the low to mid pressure range has remained limited. In particular, alkali basalt compositions have received limited attention. Petrological studies indicate, however, that such alkali-rich compositions are volatile-rich, in particular in arc
settings (Dixon et al., 1997; Métrich et al., 2001; Bertagnini et al., 2004). Experimental data show indeed that alkali-rich basalt compositions tend to dissolve more CO2 than those
alkali-poor (Dixon, 1997; Botcharnikov et al., 2005; Behrens et al, 2009), a key role being played by potassium (Behrens et al., 2009) but the exact compositional control of such an increase is still unclear.
In an effort to decipher the role of alkalis on CO2 solubility, in this study we report
measurements of CO2 solubility obtained in several basalts of varying alkalinity coming from
Italian active volcanoes at 1200°C, at pressures ranging from 250 up to 2000 bar, and under oxidizing conditions. CO2 contents in quenched glasses from vapour-saturated experiments
were measured by infrared spectroscopy. Solubility measurements give upper bounds on the amounts of CO2 that can dissolve in magmas at various temperatures and pressures. A
companion paper presents the thermodynamics of water in these silicate melts. Our aim is to produce a set of internally consistent data on the solubility of C-O-H-S volatiles under moderately oxidizing conditions so as to be ultimately able to quantitatively model the degassing of alkali basalts, such as recently done for silicic compositions by Burgisser and Scaillet (2007).
Experimental techniques
Starting materials, capsules and charges
Three alkali basalts from Vesuvius, Etna and Stromboli (Lesne et al. this issue) were selected for our investigation. The natural samples were powdered and melted in a Pt crucible at atmospheric pressure, at 1400°C during 3 hours in order to get homogeneous and nominally anhydrous glasses. The resulting glasses were analyzed by electron microprobe. Their compositions are listed in Table 1. Experiments were conducted in parallel on those three alkali basalts.
As for experiments on water solubility, small glass chips were loaded in capsules to prevent bubble formation. About 60 to 100 mg of starting material was used for each experiment. Capsules (2 cm height, 2.5 mm inner and 2.9 mm outer diameters) made of platinum were used. CO2 was added as silver oxalate (Ag2C2O4, density 5g/cm3). Although silver does
dissolve in basaltic melt, its effect on CO2 solubility has been shown to be negligible (Pan et
al., 1991). Capsules were sealed by electric arc. They sere then put in an oven for several hours and reweighed to check for leaks.
Equipment and experiments
Equilibrium experiments between a fluid (CO2-rich fluids, see below) and a silicate liquid
phase were conducted in an internally heated pressure vessel (IHPV) operated in a vertical position and equipped with a drop quench set up (see Di Carlo et al., 2006). Experiments were performed at 1200±5°C, at the following pressures: 269, 524, 1013, 1062, 1128, 2059 ±25 bars, under oxidizing conditions. Experiments lasted between 4 to 8 hours. Based on previous experimental works performed using similar procedures, the equilibrium between the basaltic liquid and the fluid phase is considered to be reached under these conditions (e.g., Dixon et al, 1995; Botcharknikov et al, 2005; Behrens et al., 2009). Phase equilibrium experiments performed with the same duration and P-T-H2O-CO2 conditions (Di Carlo et al., 2006;
Pichavant et al. 2009) on a Strombolian basalt had no problem in attaining crystal-liquid equilibrium. Since the kinetics of melt-fluid equilibrium is faster than that of crystal-liquid one, we conclude that our run durations were long enough to attain equilibrium. In support of this, major element analyses performed on two or three glass ships on microprobe yielded the same results within analytical error. The same was observed with FTIR analyses carried out on several double polished glass pieces (2 to 3).
Any use of sensor was not possible because of the short duration of the experiments. All the runs were done using the intrinsic fH2 of the vessel, as measured by Pichavant et al.
(2009) for experiments done with the same apparatus, without hydrogen added, at 1150°C, at 2010 and 880 bars (runs 22 and 23). We assume that the fH2 measured in those experiments is
equivalent to the fH2 in our runs, then the fO2 of each charge was calculated from the
dissociation reaction of water, using fH2O as calculated from the dissolved water content in
the glass (see below). It appears that the fO2 calculated for all charges, averages at NNO+1.9,
with an error of 0.6 log unit. All performed experiments for this study are reported in Table 2.
Analytical techniques
Analytical techniques used in this study are the same as those used in the accompanying paper (Lesne et al.). Major elements were analysed with a SX50 CAMECA electron microprobe (BRGM-ISTO, Orléans, France). Water contents and its speciation were determined with FTIR analyses. All of these methods are described in detail in Lesne et al. (this issue). The total carbon dissolved in quenched glasses was determined by using transmission IR spectroscopy on doubly polished glass chips, with thicknesses varying between 60 and 270 µm. One sample (4#4) had very low CO2 contents, which required the use of a thick double
within 3 μm. To determine the total carbon dissolved in the glass, a microchamber attachment to the FTIR NicoletTM Magna Spectrometer 760 together with a white source, a KBr beamsplitter and a MCT-A detector (mercury, cadmium tellurium) were used. Analytical conditions for each analysis were 128 scans and a 2 cm-1 resolution. The diameter of the analyzed spot was 100 μm. The background was acquired in air at each measurement. For each sample, a minimum of 2 spots were made, in order to check the homogeneity of the sample.
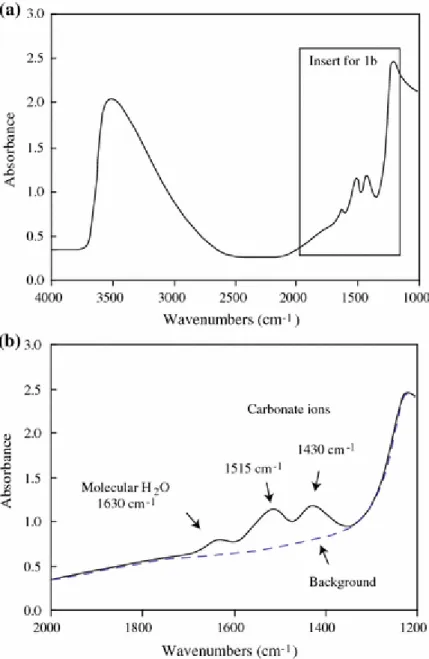
Carbon can be dissolved in silicate melts either as molecular CO2 or as carbonate groups
CO32- (e.g., Fine and Stolper, 1985, 1986, Morizet et al., 2002). The intensity of the 2350
cm-1 is attributed to the ν3 antisymmetric stretch of molecular CO2 (Fine and Stolper, 1985; Fine
and Stolper, 1986). The peaks at 1515 cm-1 and 1435 cm-1 correspond to an antisymmetric stretch of distorted CO32- groups (Fine and Stolper, 1986). Figure 1 shows a typical IR
spectrum obtained on our glasses which shows that there is a double peak at 1515 cm-1 and 1435 cm-1, whilst none is present at 2350 cm-1. Thus, the carbon dissolved in the melt is
present as carbonate groups ( 2− 3
CO ) only, in agreement with previous works on basaltic
compositions (e.g., Pan et al., 1991; Behrens et al., 2009).
In this work, following Behrens et al. (2009), we measured carbonate absorbance by substracting from the sample spectrum that of a compositionally similar but volatile-free glass (ie the starting dry glass) scaled to the same thickness of the unknown. This enables to model the background and measure the peak height of the 1515 cm-1 wavenumber.
The total carbon content of glasses was calculated with the Beer-Lambert law (Fine and Stolper 1985;1986), by measuring the absorbance of the 1515 cm-1 band:
1515 1515 * * * 2 2 ρ ε d M A CCO = CO (1)
Where CCO2is the total carbon content in the glass (in wt%), A1515 is the absorbance of the
1515 cm-1 band, d is the thickness of the sample (in cm), ρ is the density in g.l-1, ε
1515 is the
molar extinction coefficient (l.mol-1.cm-1), and MCO2is the molecular weight of CO2.
Glass densities, were calculated using the method of Richet et al. (2000), considering only the amount of water dissolved in the glass, assuming that the small quantities of CO2 dissolved do
not affect density to any measurable extent (Lange, 1994, Bourgue and Richet, 2001).
The choice of appropriate molar extinction coefficients is crucial to measure correctly dissolved carbon contents (e.g. Behrens et al., 2009). However, we do not have bulk carbon data, and thus it is not possible to obtain molar extinction coefficients for each basaltic
compositions studied here. Consequently, two choices are offered: either we arbitrarily take the same value for the three basaltic compositions, referring to Fine and Stolper (1986) (ε1515
=375±20 l.mol-1.cm-1, calculated for basaltic glasses), or we calculate the extinction coefficient for each basaltic melt using the method of Dixon and Pan (1995). These authors found a linear dependency of the molar extinction coefficient with the Na/(Na+Ca) molar ratio, in the range 0.25 to 0.5. Values of molar extinction coefficients determined by Dixon and Pan’s method yield 381 l.mol-1.cm-1 for Vesuvius, 327 l.mol-1.cm-1 for Etna and 367 l.mol-1.cm-1 for Stromboli samples. The calculated extinction coefficients for both Vesuvius and Stromboli are within 2% of the Fine and Stolper (1986) value, whilst that for Etna is lower by 13%, which reflects its higher Na content.. Behrens et al. (2009) determined the extinction coefficient of their phonotephrite melt to be 308±110 l.mol-1.cm-1, whilst the value retrieved with the Dixon and Pan (1995) method is 370 l.mol-1.cm-1. Although both values agree within error, the difference observed suggests that the Dixon and Pan method may overestimate extinction coefficients of strongly potassic compositions by up to 20%, which translates into a similar overestimates of carbon contents calculated with the Beert-Lambert law. In the following, owing to the lack of absolute method to measure dissolved C content, and considering the significant errors associated to existing measurements of extinction coefficients for basaltic compositions, we first present the results obtained by using the same extinction coefficient for all compositions, and latter discuss the effect arising from the use of composition specific molar extinction coefficients .
In addition to the uncertainty on extinction coefficients, one of the largest sources of errors in measuring the total carbon dissolved in the melt by FTIR arises from the method chosen to model the background. The method used here is somewhat subjective and leads to an error in absorbance estimated to be ±0.015, which propagates into an error of ± 50 ppm of the CO2
dissolved in the glass, regardless of the CO2 contents. Thicknesses were measured to within 3
μm which induces an error of 2% on the total CO2 contents dissolved in the melt. The
maximum error on the density calculations is equal to 20%. Altogether we estimate that the CO2 content reported in this work are known to within 20%.
Results
The fluid-saturated charges have been checked after each experiment: capsules were first weighed to check any volatile loss during experiment, then they were punctured. Any escape of bubbles/gas and difference of weigh between before and after piercing is a proof of fluid-saturated experiment. All the data presented in this study are fluid fluid-saturated.
Macro and microscopic observations
Run products were translucent to brownish glasses, becoming darker and opaque when quench crystals (<5µm) were present (i.e., in experiments performed with more than 4 capsules). Most quenched glasses contain a few microbubbles whose abundance does not exceed 0.1 % in volume. Larger bubbles (<0.5mm of diameter), indicative of fluid saturation at P and T, are located at the melt/capsule interface, as shown by the presence of large open smooth cavities at the surface of the glass blocks.
Major elements and H2O contents
The compositions of quenched glasses are reported in the Table 3. Analytical errors were less than 0.2% for all oxides, except for SiO2 (0.4 to 0.6%) and for Fetot (less than 0.4%). Apart
from Fetot, the concentrations of major oxides do not differ appreciably from those of the
starting materials (Table 1).
For experiments carried out in platinum capsules, the iron loss is around 30%, whereas the iron loss of experiments carried out in Au75Pd25 capsules is less than 10% (Table 3).
Despite that no water was added to the capsules, the water contents of quenched glasses vary between 0.70 and 1.30 wt% without any obvious relationships with pressure or melt composition. Several sources of water can be proposed: it could come from the silver oxalate which contains some water (up to 5 wt%) and could not be dried enough, or from adsorption of atmospheric water on the starting glasses. However, the most probable source of H2O is
from reduction of ferric into ferrous iron (e.g., Holloway et al., 1992), inasmuch as our starting glasses are oxidized, which enables the operation of the following reaction:
O H FeO H O Fe2 3 + 2 ⇔ + 2 (2).
Note that, in addition to the above reaction, reduction of ferrous iron via alloying with the capsule wall will also produce some water.
CO2 contents
Dissolved CO2 contents in glasses are reported in Table 3. We stress that, as the quenched
glasses also contain dissolved H2O, the measured CO2 contents do not represent pure CO2
solubilities. The data show linear relationships between dissolved carbon and pressure for each composition (figure 2). Data from Dixon et al. (1995) and Behrens et al. (2009) are also shown for comparison. Figure 2 shows clearly that there is a strong dependence of the carbon dissolved in the melt on melt composition. Alkali-rich compositions dissolve more CO2 than
those alkali-poor. However, to rigorously compare CO2 solubilities of the different melt
compositions, one has to determine the fugacities of CO2. Determination of the fugacities of CO2.
As the H2O of quenched glasses was determined in each charge, and as solubilities laws of
water were defined for each composition in the companion paper (Lesne et al.), we can calculate the fH2O of each charge, using the following empirical relationships derived from
the experimental data base of Lesne et al. (this issue): 69 . 1 2 1200 126.54 ( % ) 2 wt H O fHO°C = × for Vesuvius (3); 83 . 1 2 1200 104.98 ( % ) 2 wt H O f C O H = × ° for Etna; (4); 73 . 1 2 1200 128.49 ( % ) 2 wt H O fHO C = × ° for Stromboli. (5).
In the above equations wt%H2O is the wt% amount of total water dissolved in the quenched
glasses. Once the fHO
2 is known, we can derive the mole fraction of H2O (
f O H
X
2 ) in the coexisting fluid by using the standard relationships:
i i
i P
f =γ * (6),
where γ is the fugacity coefficient of species i, and i Pi its partial pressure.
Since
tot i i X P
P = * (7), where Ptot is total pressure,
we obtain tot i i i X P f =γ * * (8).
Assuming that the fluid is made of only H2O and CO2 species (under oxidized conditions CO2
has been shown to be the only C-bearing species in the C-O-H system, Pawley et al., 1992), it follows: 1 2 2O + CO = H X X (9), and so O H CO X X 2 2 =1− (10).
In this work, we use the γCO2and γH2Ovalues of Dixon et al. (1995). These fugacity
coefficients correspond to those of pure species at P and T. Strictly speaking, the fugacity coefficient of any species i in a complex fluid is dependent on the composition of that fluid, in addition to P and T, and this can be accounted for via the use of a modified Redlich Kwong equation of state with appropriate mixing rules between different fluid species (Holloway,
1987; Ferry and Baumgartner, 1987). However, in the low pressure and high temperature range of interest here, application of the rules of real mixing of real fluid has only a trivial effect on the calculated fugacity coefficients (less than 1 %, see Holloway, 1977), relative to the assumption of ideal mixing of real fluids (Lewis and Randall rule) which has thus been used here for simplicity. Application of the empirical relationships 2-4 assumes also that dissolved CO2 does not affect the thermodynamics of H2O solution in the selected melts.
Considering the low concentration in CO2 of our synthetic melts, this assumption holds true to
a first approximation. The reverse (ie H2O affects the CO2 solubility) might not be true,
however, as discussed below. Using such an approach, the fugacity of CO2 of any run product
can be calculated in a way that ensures internal consistency between fluid species fugacities:
tot CO CO CO X P f = × × 2 2 2 γ (11).
The relationships between dissolved CO2 (XCOm2being the mole fraction of CO2 dissolved
calculated following Silver and Stolper (1985) on the basis of one oxygen) and fCO2 are
shown in figure 3.
Each trend can be fitted to a second order polynomial equation, in mole fractions: 26 . 1 6 1200 2 2 8.57 10 m CO C CO X f ° = × × ; R² = 0.99 for Vesuvius (12) 23 . 1 7 1200 2 2 1.14 10 m CO C CO X f ° = × × ; R² = 0.93 for Etna (13) 04 . 1 6 1200 2 2 3.49 10 m CO C CO X f ° = × × ; R² = 0.99 for Stromboli (14) or in ppm: 26 . 1 2 1 1200 1.93 10 2 melt C CO CO f ° = × − × ; R² = 0.99 for Vesuvius (15) 22 . 1 1 1200 2 2 4.06 10 melt C CO CO f ° = × − × ; R² = 0.93 for Etna (16) 4 1.0 1200 2 2 1.62 CO melt C CO f ° = × ; R² = 0.99 for Stromboli (17) 2 CO f versus melt co
2 relationships for MORB (Dixon et al., 1995) is also shown on figure 3: the CO2 solubility varies non-linearly with fluid composition. Again, the dependence of the total
dissolved carbon with melt composition is apparent. It should be stressed that equations 12-17 are essentially valid for the selected melt compositions having dissolved water contents similar to those of the present work and over the pressure range investigated (1-2 wt% and up to 2 kb). On figure 3 we have also plotted the data of Behrens et al (2009), calculating the fCO2 using their measured XCO2 and equation (11). Despite some scatter, in part related to
quench effects arising from the excessively low viscosity of phonotephrite melt, the data display a similar exponential pattern, being located to the right of the Vesuvius trend, which is in keeping with the much stronger potassic character of the phonotephrite composition (7.52 wt% K2O) used by Behrens et al. (2009) relative to any of our melt compositions.
Discussion
Effect of alkalisOur results show clearly that alkalis have a positive effect on CO2 solubility in basaltic melts
as shown by previous studies (e.g., Dixon 1997; Behrens et al. 2009).
At any investigated pressure, the tephrite from Vesuvius dissolves 1.4 more CO2 than the
Etnean basalt, and 1.7 more CO2 than the Strombolian basalt, and up to 2 times more CO2
than a MORB (Dixon et al., 1995). This general trend is confirmed and extended by the data of Behrens et al. (2009). This effect is illustrated in figure 4: for each isobar, there exists a positive relationship between CO2 solubility and the alkalinity of the melt.
These results were obtained using the same extinction coefficients for the three basaltic compositions. If we consider now different extinction coefficients for our three basaltic melt compositions, using the method of Dixon and Pan (1995), we obtain similar results to those obtained with the molar extinction coefficient of Fine and Stolper (1986) for VES-9 (2% lower) and PST-9 (2% higher). Only for ETN-1 are the results obtained with the Dixon and Pan method different, compared to those obtained with the constant extinction coefficient. This is simply explained by the fact that Dixon and Pan (1995) method takes into account of the Ca and Na contents, the concentration in the latter element being higher in the Etnean composition relative to the two other basaltic compositions. However, regardless of which extinction coefficient is used (constant or specific to each composition), the same effect of alkalis is observed with pressure: VES-9 dissolves more CO2 than ETN-1 and then than
PST-9. We thus conclude that alkalis (Na2O+K2O) have broadly a positive effect on the CO2
solubility in basaltic melts (see also King and Holloway, 2002). In the following, we consider the CO2 solubility results obtained by using the molar extinction coefficient of by Fine and
Stolper (1986).
Refinement of the model of Dixon (1997)
Dixon (1997) used experimentally measured solubilities of CO2 in alkali basalts (composition
composition on CO2 solubility. Dixon (1997) defined a compositional parameter Π which
takes into account the roles of Si4+, Al3+, Ca2+, K+, Na+, Mg2+ and Fe2+ cation fractions: Π = -6.50(Si+4 + Al+3) + 20.17(Ca+2 + 0.8K+1 + 0.7Na+1 + 0.4Mg+2 + 0.4Fe+2) (19) With this factor, the solubility of CO2 in alkali-rich basalts can be predicted at 1200°C and
1000 bars. CO2 solubilities for our three compositions at 1200°C and 1000 bars are plotted
against the factor Π and show a good agreement with the linear relationship predicted by Dixon (1997) (figure 6). Also represented is the composition of Behrens et al (2009), obtained from linear extrapolation to 1 kbar of the results obtained by these authors at 2 and 5 kbar (which yields at 1 kbar a CO2 content of 767 ppm).
Overall, the available experimental data base supports the parameterisation between CO2
solubility and the Π factor proposed by Dixon (1997) at 1200°C and 1000 bar as a useful tool for the description of CO2 solubility in basalt melts of variable alkalinity. At 1 kbar and
1200°C, the extended data base yields the following equation:
CO2 (ppm) = 920 (±1)Π - 17 (±53), R² = 0.89 (20)
CO2 solubilities at 1000 bars calculated with equation (20) are slightly lower (<10% ) than the
CO2 solubilities calculated by using the former regression coefficients of Dixon (1997).
Calculating the CO2 solubility with the new regression, and comparing to actual CO2
contents, differences are less than 15% for both VES-9 and PST-9, whilst for the Etna composition the back calculated values may differ by up to 30%. Despite such an uncertainty equation (20) can be used to predict to a first approximation the CO2 solubility of basaltic
magmas of different alkali contents at 1 kbar and 1200°C. Although there are not enough data to test its validity at pressures other than 1 kb, we can only assume that such a correlation holds true up to 2 kbar.
Thermodynamic model
In this section we address the thermodynamics of CO2 solution in our basaltic melts, using
essentially the same approach as Dixon et al. (1995). Recent work on CO2 solubility on a
variety of silicate melts have emphasized that the anhydrous major element composition has relatively little effect on CO2 solubility up to 2 kbar (Botcharnikov et al., 2005; 2006). In
contrast, it has been shown that dissolution of water may profoundly affect the CO2 solubility
trends in a variety of silicate liquids (Mysen, 1976), the case being made strongly for andesitic to dacitic compositions (Jakobsson, 1997; King and Holloway, 2002; Behrens et al., 2004; Botcharnikov et al., 2005). In particular, experiments show that water presence
enhances the solubility of CO2, leading to strong departure from Henrian behaviour, notably
at high pressures (>2 kb), in agreement with earlier suggestion by Mysen (1976). Owing to water production upon reduction of ferric/ferrous iron, none of our melts is anhydrous, which means that we lack the benchmark needed to evaluate whether introduction of water in our basaltic melts indeed affects their CO2 solubility in the investigated pressure range. However,
Behrens et al. (2009) observed a near linear relationships between dissolved CO2 and XCO2 at
2 kbar for their phonotephrite composition, suggesting small departure from Henrian behaviour at this, and presumably below it, pressure. Similarly, the work of Dixon et al. (1995) investigated pressures below 1 kb, and noted an essentially Henrian behaviour of CO2
solubility, despite that the water content of their quenched melts was in the range 1-2 wt%, as in our charges. Comparison with their data, obtained by equilibrating a MORB melt with an CO2-H2O vapour, with those of Stolper and Holloway (1988) and Jendrzejewsky et al. (1997),
which were obtained under drier conditions (H2O<0.6 wt%) than ours, shows that all data sets
fall on the same fCO2 vs CO2melt trend. This indicates that the presence of 1-2 wt% H2O does
not affect significantly the systematics of CO2 solubility in basaltic melts up to an fCO2=3000
bar at least, which is the maximum fCO2 reached in our experiments, or that such an effect is
not detectable with the analytical tools used to determine dissolved CO2. In contrast, the few
data available at 5 kb for basalts equilibrated with mixed H2O-CO2 fluids show a significant
departure from linear behaviour between dissolved CO2 and fCO2 (Botcharnikov et al., 2005;
Behrens et al., 2009), which has been interpreted as resulting from the depolymerising effects of OH- groups which enhances CO2 solubility (Mysen, 1976, see also Behrens et al. 2009).
In view of the above, we have modelled our experimental data using the same approach as Dixon et al. (1995), keeping in mind that our model is essentially calibrated on hydrous basalts with dissolved water contents up to 2 wt% at pressures below 3 kb. Application of the equations derived below to wetter melts may result in overestimated pressures of fluid saturation.
The solubility of carbon dioxide in basaltic liquids can be described by the following simple reaction (e.g. Stolper and Holloway, 1988):
) ( 2 3 ) ( 2 ) ( , 2mol v O m CO m CO + − = − (21),
where O2−(m)represents any reactive oxygen species,
) ( , 2mol v
CO is the molecular carbon
dioxide in the vapor phase, and 2 ( ) 3 m
CO − is the carbonate groups dissolved in the melt. The
) , ( * ) , ( ) , ( 2 2 2 3 T P f a T P a T P K CO m O m CO − − = (22).
Assuming that O2−(m)and CO32−(m) mix ideally (Stolper et al., 1997), the activity of the melt species can be substituted by their mole fractions, so that:
) , ( * ) , ( ) , ( 2 2 2 3 T P f X T P X T P K CO m O m CO − − = (23).
Then, standard thermodynamic manipulations (e.g., Holloway and Blank, 1994) show that the pressure and temperature effects on K are given by:
⎪⎭ ⎪ ⎬ ⎫ ⎪⎩ ⎪ ⎨ ⎧ Δ + Δ − × =
∫
∫
T T O H P P m r dT RT P T H dP RT V T P K T P K 0 2 0 ? ) , ( exp ) , ( ) , ( 0 0 , 0 0 0 0 (24),where K0(P0,T0) is the equilibrium constant at P0 = 1000 bar and T0= 1200°C the reference
pressure and temperature, m r
V0,
Δ is the volume change of the condensed components of reaction 15:
( )
( )
om O m o CO m o r V V V , ,2 2, 3− − − = Δ (25), where( )
om CO V ,2 3− and( )
m o OV 2−, are the molar volume of species of the melt in their standard states. 0
2O
H
H
Δ is the heat of solution of a mole of CO2 into the melt. Since we did not investigate
specifically the temperature effect, an appropriate value of 0 2O
H
H
Δ (-13.1 kJ/mol) is that of basanite which has a composition intermediate between tholeiitic basalt and nephelinite (Holloway and Blank, 1994).
According to reaction 24, a plot of
⎪⎭ ⎪ ⎬ ⎫ ⎪⎩ ⎪ ⎨ ⎧ tot CO CO X f , 2 2 0 ln versus
(
)
RT P P− 0obtained from CO2 solubility
data of experiments at constant temperature, results in a straight line whose slope gives om r V , Δ ( tot CO X ,
2 is the mole fraction of total CO2 contents dissolved in the melt; figure 7).
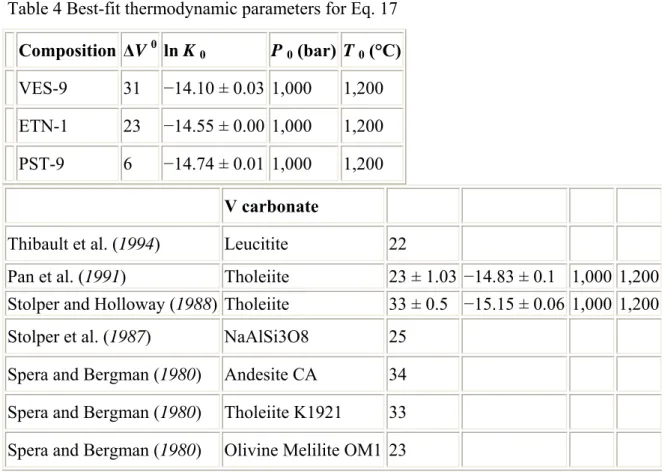
Values calculated for VES-9, PST-9 and ETN-1 are similar to values found in previous works (Table 4): from 21.5 cm3/mol for leucitite (Thibault and Holloway, 1994), to 28 cm3/mol for tholeiite (Stolper and Holloway, 1988). There is no clear dependence between om
r
V ,
Δ and the Π parameter, however. Considering the assumptions and uncertainties associated to the determination of om
r
V ,
Δ with the above method we can only say that in most basaltic liquids
m o r
V ,
Δ is close to 25±3 cm3/mol. It is also important to note that the values of om r
V , Δ
calculated here are for moderately hydrous basalts only and should not be interpreted as an accurate measurement of om
r
V ,
Δ (e.g., Zhang,1999). Then, knowing values of om
r
V ,
Δ , values of lnK0 can be calculated. Values found are similar to
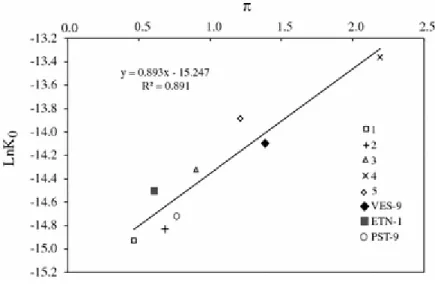
those calculated in previous works (Table 4). The influence of melt composition on the solubility of CO2 is borne out by the variability of K° constants determined in this and other
studies (Holloway and Blank, 1994). A plot of lnK° versus Π (Fig. 8) reveals that there exists a good linear relationship between these two parameters.
Linear regression of the data set yields the following equation: lnK° = 0.893 Π - 15.247 (26) with a correlation coefficient R2 = 0.891.
The above parameterisation of the K° coefficient offers a simple model of calculating the solubility of CO2 in basaltic melts with varying alkali contents. The results of back
calculations of the CO2 contents of our experimental quenched glasses performed with this
model are shown against measured CO2 values (Fig. 9). The model appears to retrieve
observed CO2 contents to within 10% relative.
Application to the calculation of saturation pressures for alkali-rich basaltic compositions
Having determined solubility the laws of H2O (Lesne et al., this issue) and CO2 in the three
basaltic melts from Vesuvius, Etna and Stromboli, we are now able to calculate saturation pressures of melt inclusions analysed in related volcanic products. By determining the total water and CO2 dissolved in the melt inclusions, we are able to calculate fugacities and partial
pressures of those species, and then the saturation pressures at which volatiles were entrapped in the melt inclusion (ignoring the role of other volatiles, in particular sulphur and halogens).
For Vesuvius, we use the data of Marianelli et al. (1999, 2005) and Fulignati et al. (2004) to calculate saturation pressures. In those previous works, the quantities of dissolved water and carbon dioxide were determined via FTIR measurements. They considered the OH stretching vibration band at 3535 cm-1 for measuring the water content, which was not used for measuring water content in our experimental glasses. CO2 contents were calculated using
the Dixon and Pan (1995) relationship (Marianelli et al., 2005) and using ε1515 =365
l.mol-1.cm-1 (Fulignati et al., 2004) and ε1515 = 380 l.mol-1.cm-1 (Cioni, 2000). Those values of
ε1515are not so different from that of Fine and Stolper (1986) used in this study, and translate
into a maximum difference of 3% on the total carbon dissolved in the melt. Such a difference in CO2 content will not induce a significant effect on the saturation pressures calculated. Both
Marianelli et al. (1999, 2005) and Fulignati et al. (2004) used VolatileCalc to calculate saturation pressures. Comparison of their findings with our own model shows that previous calculated pressures were overestimated by 50% on average (figure 10a).
For Etna we use the recent data of Métrich et al. (2004) and Spilliaert et al. (2006) who calculated saturation pressures with the VolatileCalc model (Newman and Lowenstern, 2002). To determine the CO2 content of melt inclusions, Spilliaert et al. (2006) used a LPS
nuclear microprobe, whilst for water they used a CAMECA IMS3f ion microprobe. Métrich et al. (2004) determined, instead, water and carbon contents by using the FTIR technique. As for Vesuvius, Métrich et al. (2004) determined water contents by using the total water band assignment and determined CO2 content by using the molar extinction coefficient calculated
from the Dixon and Pan (1995) relationship. Thus, CO2 contents in melt inclusions and in our
glasses are comparable, whereas the method used to calculate water content is not the same which could induce some differences in calculated water fugacities. Our calculated range of saturation pressures varies from 200 to 4200 bars, which is broadly similar to the range of pressures calculated by Métrich et al. (2004) and Spilliaert et al. (2006) (figure 10b).
For Stromboli, we refer to the data of Métrich et al. (2001) and Bertagnini et al. (2003) who calculated saturation pressures of melt inclusions by using Papale’s (1999) model. Both determined water and total carbon contents in the melt inclusions by using FTIR and the relationship of Dixon and Pan (1995) to determine ε1515. Métrich et al. (2001) used extinction
coefficient values for the 5200 and 4500 cm-1 band assignments of Dixon et al. (1995), whereas Bertagnini et al. (2003) used the 3535 cm-1 band assignment. Thus, the data of Métrich et al. (2001) are directly comparable to ours, contrary to the water contents of Bertagnini et al. (2003). However, as CO2 largely predominates over H2O when calculating
saturation pressures, comparison between our calculations and those of previous works can still be done faithfully. Métrich et al. (2001) and Bertagnini et al. (2003) found a range of saturation pressures from 2800 up to more than 4000 bars, with a cluster at 3500 bars. Both studies do not tabulate the calculated pressures, which prevents us from drawing a comparative plot such as done for Vesuvius and Etna. Our results yield a range of saturation pressures from 1500 to 3000 bars, with a cluster at 2500 bars, which is 1000 bars less than the cluster found by Bertagnini et al. (2003).
It thus appears that VolatileCalc overestimates the saturation pressures by 70% for Vesuvius basalt, by 26% for Stromboli and by 14% for Etnean basalt. Botcharnikov et al (2005) have already shown that VolatileCalc does not work properly at pressures significantly higher than 2 kb, tending also to overestimate fluid saturation pressures for common
basalt-andesite-rhyolite melts. The present study shows that a further limitation of this model is its failure in correctly predicting saturation pressures for alkali-rich mafic melts. A similar conclusion was reached by Behrens et al. (2009). For those melts, it appears that more complex models, such as that of Papale (1999), are needed to better account for the possible interactions between H2O and CO2 in silicate melts (see for instance Tamic et al., 2001), in
addition to other compositional effects.
Conclusions
Experiments at 1200°C and pressures from 250 to 2086 bar have been performed to determine the solubilities of CO2 in alkali basaltic melts.
1. Results of CO2 contents presented in this study were measured by infrared
measurements. Without any bulk carbon data, we used the molar extinction coefficient given by Fine and Stolper (1986) for basaltic melts, as well as molar extinction coefficients calculated from the melt composition given by Dixon and Pan (1995). Clearly, there is still a large uncertainty surrounding the determination of extinction coefficients in basaltic glasses and their variations with alkali and alkali-earth elements, which considerably hamper an accurate determination of dissolved CO2 in
basalts other than MORBs. Future work should be directed at a better definition of such a relationships
2. Aside from this problem, our experiments, along with previous similar works, show that the solubility of any particular melt can be modelled in a simple way. For the three worked compositions, such simple relationships are:
26 . 1 6 1200 2 2 8.57*10 * m CO C CO X f ° = ; R² = 0.99 for Vesuvius (27) 23 . 1 7 1200 2 2 1.14*10 * m CO C CO X f ° = ; R² = 0.93 for Etna (28) 04 . 1 6 1200 2 2 3.49*10 * m CO C CO X f ° = ; R² = 0.99 for Stromboli (29).
3. Experimental results obtained on these basaltic compositions show a strong effect of alkalis on CO2 behaviour in these melts, confirming previous studies (Dixon, 1997;
Behrens et al., 2009): at any pressure of the investigated range, alkali-rich basalts dissolve up to 1.7 times more CO2 than alkali-poor basalts, and up to 2 times more
4. Data obtained in this study provide a refinement of the model of Dixon (1997): the parameterisation between the CO2 solubility at 1 kbar and 1200°C and the Π factor is
confirmed, and the extended data base yields: CO2 (ppm) = 920 (±1)Π - 17 (±53),
5. Comparing our data with those obtained in previous works, it appears that there exists a compositional dependence for lnK°, which varies linearly with the Π parameter, therefore providing a basis for a simple thermodynamical modelling of CO2 solubility
in basaltic melts.
6. Lastly, application of our results to the calculation of volatile saturation pressures using dissolved H2O and CO2 contents of primitive melt inclusions from the three
studied volcanoes shows that previous saturation pressures of primitive magmas feeding these volcanoes were significantly overstimated, notably for the Vesuvius.
Acknowledgements:
We thank reviewers A and B for helpful reviews. This paper is part of the PhD thesis of the senior author. It has been partly financially supported by INGV funds and by the department of the Italian Civil Defence.
References
Behrens H, Ohlhorst S, Holtz F, Champenois M (2004) CO2 solubility in dacitic melts equilibrated with H2O-CO2 fluids: Implications for modelling the solubility of CO2
in silicic melts. Geochimica et Cosmochimica Acta 68: 4687-4703
Behrens H, Misiti V, Freda C, Vetere F, Botcharnikov RE and Scarlato P (2009) Solubility of H2O and CO2 in ultrapotassic melts at 1200 and 1250 degrees C and pressure from
50 to 500 MPa. American Mineralogist 94:105 -120
Berndt J, Liebske C, Holtz F, Freise M, Nowak M, Ziegenbein D, Hurkuck W, Koepke J (2002) A combined rapid-quench and H-2-membrane setup for internally heated pressure vessels: Description and application for water solubility in basaltic melts. American Mineralogist 87:1717-1726
Bertagnini A, Metrich N, Landi P, Rosi M (2003) Stromboli volcano (Aeolian Archipelago, Italy): An open window on the deep-feeding system of a steady state basaltic volcano. Journal of Geophysical Research-Solid Earth 108(B7) doi:10.1029/2002JB002146
Blank JG, Stolper EM, Carroll MR (1993) Solubilities of carbon-dioxide and water in rhyolitic melt at 850 degrees C and 750 bars. Earth and Planetary Science Letters 119(1-2):27-36
Blank JG, Brooker RA (1994) Experimental studies of carbon-dioxide in silicate melts. Solubility, speciation, and stable carbon-isotope behaviour. In: Volatiles in Magmas, vol 30. Mineralogical Soc America, Washington, pp 157-186
Botcharnikov R, Freise M, Holtz F, Behrens H (2005) Solubility of C-O-H mixtures in natural melts: new experimental data and application range of recent models. Annals of Geophysics 48:633-646
Botcharnikov RE, Behrens H, Holtz F (2006) Solubility and speciation of C-O-H fluids in andesitic melt at T=1100-1300 degrees C and P=200 and 500MPa. Chemical Geology 229: 125-143
Bourgue E, Richet P (2001) The effects of dissolved CO2 on the density and viscosity of
silicate melts: a preliminary study. Earth and Planetary Science Letters 193(1-2): 57-68
Burgisser A, Scaillet B (2007) Redox evolution of a degassing magma rising to the surface. Nature 445(7124): 194-197
Cioni R (2000) Volatile content and degassing processes in the AD 79 magma chamber at Vesuvius (Italy). Contributions to Mineralogy and Petrology 140(1): 40-54
Di Carlo I, Pichavant M, Rotolo SG, Scaillet B (2006) Experimental crystallization of a high-K arc basalt: The golden pumice, Stromboli volcano (Italy). Journal of Petrology 47(7): 1317-1343
Dixon JE, Pan V (1995) Determination of the molar absorptivity of dissolved carbonate in basanitic glass. American Mineralogist 80: 1339-1342
Dixon JE, Stolper EM, Holloway JR (1995) An experimental study of water and carbon dioxide solubilities in mid ocean ridge basaltic liquids .1. Calibration and solubility models. Journal of Petrology 36: 1607-1631
Dixon JE (1997) Degassing of alkalic basalts. American Mineralogist 82: 368-378
Ferry JM and Baumgartner L (1987) Thermodynamic models of molecular fluids at the elevated pressures and temperatures of crustal metamorphism (1987) Reviews in Mineralogy 17: 323-365
Fine G, Stolper E (1985) The speciation of carbon-dioxide in sodium aluminosilicate glasses. Contributions to Mineralogy and Petrology 91(2): 105-121
Fine G, Stolper E (1986) Dissolved carbon-dioxide in basaltic glasses. Concentrations and speciation. Earth and Planetary Science Letters 76(3-4): 263-278
Fulignati P, Marianelli P, Metrich N, Santacroce R, Sbrana A (2004) Towards a reconstruction of the magmatic feeding system of the 1944 eruption of Mt Vesuvius. Journal of Volcanology and Geothermal Research 133(1-4): 13-22
Holloway JR, Blank JG (1994) Application of experimental results to C-O-H species in natural melts. In: Volatiles in Magmas, vol 30. Mineralogical Soc America, Washington, pp 187-230
Holloway JR, Pan V, Gudmundsson G, Hb (1992) High-pressure fluid-absent melting experiments in the presence of graphite: oxygen fugacity, ferric/ferrous ration and dissolved CO2. European Journal of Mineralogy 4: 105-114
Holloway JR (1987) Igneous fluids. Reviews in Mineralogy 17: 211-233
Holloway JR (1977) Fugacity and activity of molecular species in supercritical fluids. Thermodynamics in Geology: 161-181
Jakobsson S (1997) Solubility of water and carbon dioxide in an icelandite at 1400 degrees C and 10 kilobars. Contributions To Mineralogy And Petrology 127: 129-135
Jendrzejewski N, Trull TW, Pineau F, Javoy M, Xa (1997) Carbon solubility in Mid-Ocean Ridge basaltic melt at low pressures (250-1950 bar). Chemical Geology 138(1-2): 81-92
King PL, Holloway JR (2002) CO2 solubility and speciation in intermediate (andesitic) melts:
The role of H2O and composition. Geochimica Et Cosmochimica Acta 66:
1627-1640
Lange RA (1994) The effect of H2O, CO2 and F on the density and viscosity of silicate melts.
In: Volatiles in Magmas, vol 30. Mineralogical Soc America, Washington, pp 331-369
Lesne P, Scaillet B, Pichavant M, Iacono-Marziano G, Beny JM (in prep.) The H2O solubility
of alkali basalts: an experimental study
Marianelli P, Metrich N, Santacroce R, Sbrana A (1995) Mafic magma batches at Vesuvius. A glass inclusion approach to the modalities of feeding stratovolcanoes. Contributions to Mineralogy and Petrology 120(2): 159-169
Marianelli P, Metrich N, Sbrana A (1999) Shallow and deep reservoirs involved in magma supply of the 1944 eruption of Vesuvius. Bulletin of Volcanology 61(1-2): 48-63 Marianelli P, Sbrana A, Metrich N, Cecchetti A (2005) The deep feeding system of Vesuvius
involved in recent violent strombolian eruptions. Geophysical Research Letters 32: L02306
Metrich N, Allard P, Spilliaert N, Andronico D, Burton M (2004) 2001 flank eruption of the alkali- and volatile-rich primitive basalt responsible for Mount Etna's evolution in the last three decades. Earth and Planetary Science Letters 228(1-2): 1-17
Metrich N, Bertagnini A, Landi P, Rosi M (2001) Crystallization driven by decompression and water loss at Stromboli volcano (Aeolian Islands, Italy). Journal of Petrology 42(8): 1471-1490
Morizet Y, Brooker RA, Kohn SC (2002) CO2 in haplo-phonolite Melt: Solubility, speciation and carbonate complexation. Geochimica et Cosmochimica Acta 66(10): 1809-1820 Mysen BO (1976) Experimental-determination of some geochemical parameters relating to
conditions of equilibration of peridotite in upper mantle. American Mineralogist 61: 677-683
Newman S, Lowenstern JB (2002) VOLATILECALC: a silicate melt-H2O-CO2 solution
model written in Visual Basic for excel. Computers & Geosciences 28(5): 597-604 Ohmoto H and Kerrick D (1977) Devolatilization equilibria in graphitic systems. American
Journal of Science, 277: 1013-1044
Pan V, Holloway JR, Hervig RL (1991) The pressure and temperature-dependence of carbon-dioxide solubility in tholeiitic basalt melts. Geochimica Et Cosmochimica Acta 55(6): 1587-1595
Papale P (1997) Modelling of the solubility of a one-component H2O or CO2 fluid in silicate
liquids. Contributions to Mineralogy and Petrology 126(3): 237-251
Papale P (1999) Strain-induced magma fragmentation in explosive eruptions. Nature 397(6718): 425-428
Papale P, Moretti R, Barbato D (2006) The compositional dependence of the saturation surface of H2O+CO2 fluids in silicate melts. Chemical Geology 229(1-3): 78-95
Pawley AR, Holloway JR, McMillan PF (1992) The effect of oxygen fugacity on the solubility of carbon oxygen fluids in basaltic melt. Earth and Planetary Science Letters 110(1-4): 213-225
Pichavant M, Di Carlo I, Le Gac Y, Rotolo S, Scaillet B (2009) The deep feeding system of basaltic volcanoes: experimental evidence from Stromboli (Italy). Journal of Petrology 50: 601-624
Richet P, Whittington A, Holtz F, Behrens H, Ohlhorst S, Wilke M, (2000) Water and the density of silicate glasses. Contributions to Mineralogy and Petrology 138: 337-347 Robock A (2000) Volcanic eruptions and climate. Reviews of Geophysics 38(2): 191-219 Roux J, Lefevre A (1992) A fast-quench device for internally heated pressure-vessels.
European Journal of Mineralogy 4: 279-281
Silver L, Stolper E (1985) A thermodynamical model for hydrous silicate melts. Journal of Geology 93: 161-177
Spilliaert N, Allard P, Metrich N, Sobolev AV (2006a) Melt inclusion record of the conditions of ascent, degassing, and extrusion of volatile-rich alkali basalt during the powerful 2002 flank eruption of Mount Etna (Italy). Journal of Geophysical Research-Solid Earth 111: B04203
Spilliaert N, Metrich N, Allard P (2006b) S-Cl-F degassing pattern of water-rich alkali basalt: Modelling and relationship with eruption styles on Mount Etna volcano. Earth and Planetary Science Letters 248(3-4): 772-786
Stolper E, Fine G, Johnson T, Newman S (1987) Solubility of carbon-dioxide in albitic melt. American Mineralogist 72: 1071-1085
Stolper E, Holloway JR (1988) Experimental determination of the solubility of carbon-dioxide in molten basalt at low-pressure. Earth and Planetary Science Letters 87(4): 397-408
Thibault Y, Holloway JR, Na (1994) Solubility of CO2 in a Ca-rich leucitite. Effects of
pressure, temperature, and oxygen fugacity. Contributions to Mineralogy and Petrology 116(1-2): 216-224
Zhang Y (1999) H2O in rhyolitic glasses and melts: Measurement, speciation, solubility, and
FIGURE CAPTIONS
Figure 1:
Typical mid-IR spectrum of basaltic glass from experiment run1#4 (ETN-1) (thickness 133µm) showing the absorptions of carbonate bands (1515 1 and 1430 1). Small peaks at 2350 cm-1 are absorptions by atmospheric CO2. Background modelled as described in text.
Figure2:
Experimental results on CO2 contents in basaltic melts (Vesuvius, Etna, Stromboli and MORB
Figure 3:
Fugacity of CO2 for VES-9, ETN-1 and PST-9, calculated with an MRK equation of state
(Holloway, 1977), versus CO2 dissolved in the melts in ppm. Model from Dixon et al. (1995)
Figure 4:
CO2 solubility calculated at experimental pressures in basaltic melts against the alkalinity of the
melt.
Figure 5:
Saturation pressures calculated with VolatileCalc (Newmann and Lowenstern, 2002) for VES-9, ETN-1, PST-9, taking total SiO2 measured in hydrous glass, at T = 1200°C, versus experimental
pressures. Calculated saturation pressures of MORB (Dixon et al., 1995) were calculated and reported (crosses).
Figure 6:
CO2 (ppm) solubility calculated for Vesuvius, Etna and Stromboli at 1200°C and 1 kbar, using
solubility laws defined in this study, against the Π factor defined by Dixon (1997).
Figure 7: Determination of om r V , Δ by fitting ⎪⎭ ⎪ ⎬ ⎫ ⎪⎩ ⎪ ⎨ ⎧ tot CO CO X f , 2 2 0 ln versus
(
)
RT P P− 0 .Figure 8:
Figure 9:
Comparison between measured and calculated CO2 content with the thermodynamical
Figure 10:
Saturation pressures calculated by using data from melt inclusions of (a) Vesuvian products from Marianelli et al (1999), Cioni (2000), Fulignati et al. (2004) and Marianelli (2005) and of (b) Etnean products Métrich et al. (2004) and Spilliaert et al. (2006), compared to the saturation pressures calculated by using our solubility laws.
Tables
Table 1 Bulk rock compositions
Oxides VES-9a ETN-1b PST-9c
SiO2 48.67 47.95 49.82 TiO2 0.97 1.67 0.81 Al2O3 14.72 17.32 15.94 FeO 7.62 10.24 7.71 MnO 0.14 0.17 0.20 MgO 6.82 5.76 8.07 CaO 12.94 10.93 12.81 Na2O 1.82 3.45 2.32 K2O 5.63 1.99 1.92 P2O5 0.66 0.51 0.40 Total 100.00 100.00 100.00
aNatural alkali basalt from VES-9 bNatural alkali basalt from ETN-1 cNatural alkali basalt from PST-9
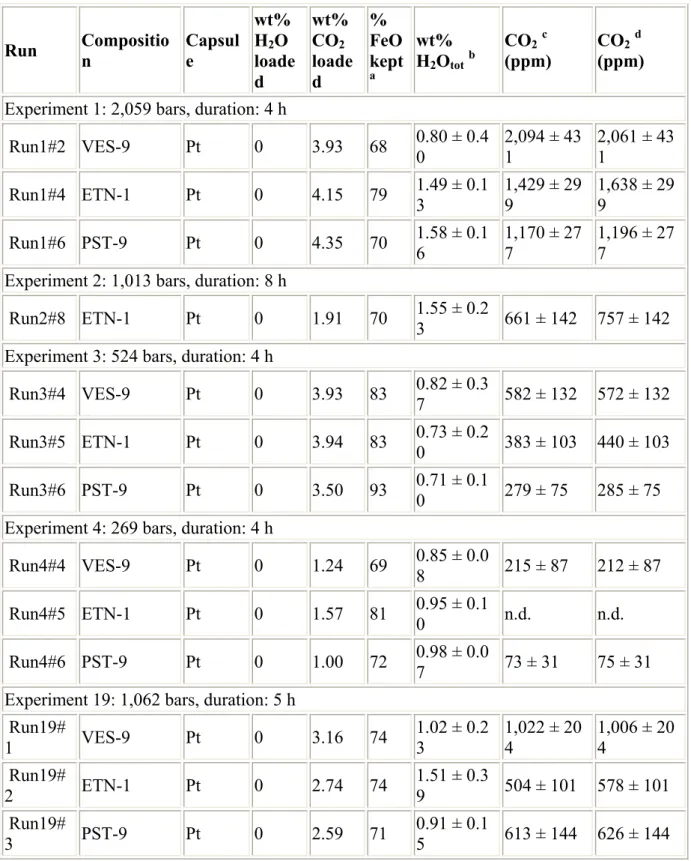
Table 2 Experimental conditions and FTIR results for H2O and CO2 dissolved in experimental
glasses
Run Composition Capsule
wt% H2O loade d wt% CO2 loade d % FeO kept a wt% H2Ototb CO2c (ppm) CO2 d (ppm)
Experiment 1: 2,059 bars, duration: 4 h
Run1#2 VES-9 Pt 0 3.93 68 0.80 ± 0.40 2,094 ± 431 2,061 ± 431 Run1#4 ETN-1 Pt 0 4.15 79 1.49 ± 0.13 1,429 ± 299 1,638 ± 299 Run1#6 PST-9 Pt 0 4.35 70 1.58 ± 0.1 6 1,170 ± 27 7 1,196 ± 27 7
Experiment 2: 1,013 bars, duration: 8 h
Run2#8 ETN-1 Pt 0 1.91 70 1.55 ± 0.23 661 ± 142 757 ± 142 Experiment 3: 524 bars, duration: 4 h
Run3#4 VES-9 Pt 0 3.93 83 0.82 ± 0.3
7 582 ± 132 572 ± 132 Run3#5 ETN-1 Pt 0 3.94 83 0.73 ± 0.20 383 ± 103 440 ± 103 Run3#6 PST-9 Pt 0 3.50 93 0.71 ± 0.10 279 ± 75 285 ± 75 Experiment 4: 269 bars, duration: 4 h
Run4#4 VES-9 Pt 0 1.24 69 0.85 ± 0.0
8 215 ± 87 212 ± 87 Run4#5 ETN-1 Pt 0 1.57 81 0.95 ± 0.1
0 n.d. n.d.
Run4#6 PST-9 Pt 0 1.00 72 0.98 ± 0.07 73 ± 31 75 ± 31 Experiment 19: 1,062 bars, duration: 5 h
Run19# 1 VES-9 Pt 0 3.16 74 1.02 ± 0.2 3 1,022 ± 20 4 1,006 ± 20 4 Run19# 2 ETN-1 Pt 0 2.74 74 1.51 ± 0.3 9 504 ± 101 578 ± 101 Run19# 3 PST-9 Pt 0 2.59 71 0.91 ± 0.1 5 613 ± 144 626 ± 144
aProportion of FeO kept in the glass relative to the initial glass FeO concentration, calculated
as 100*FeOglass/FeOstarting glass, with FeOstarting glass from Table 1 bH
cCO
2 determined by MIR-FTIR measurements and calculated with Beer–Lambert law, using
ε1515 from Fine and Stolper (1986) dCO
2 determined by MIR-FTIR measurements and calculated with Beer–Lambert law, using
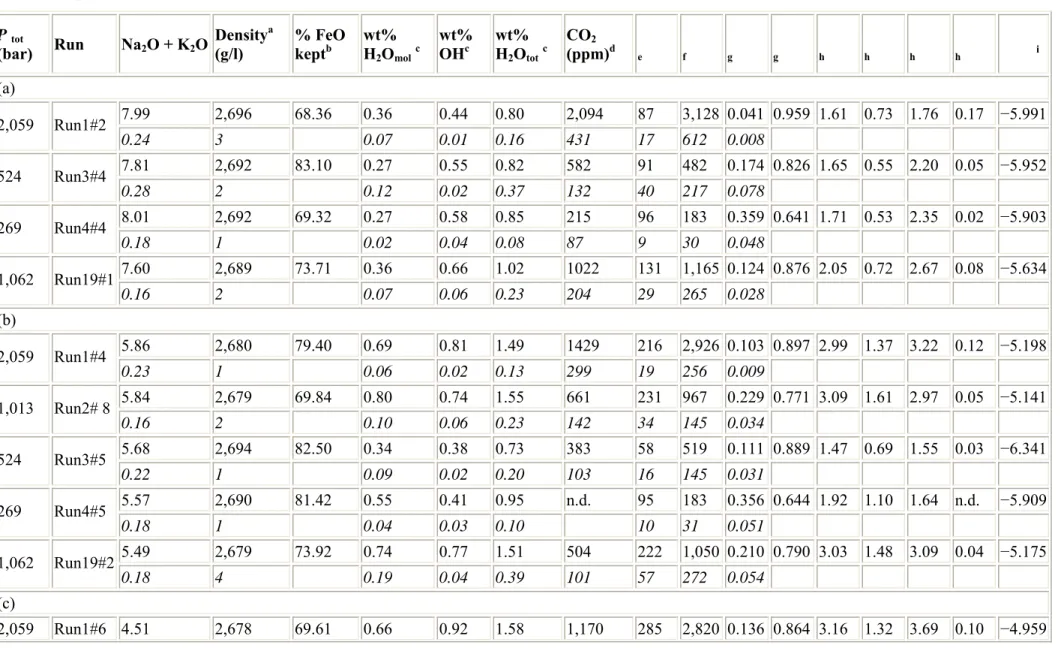
Table 3 Experimental results obtained on basalt from (a) Vesuvius, (b) Etna and (c) Stromboli
P tot
(bar) Run Na2O + K2O Density a (g/l) % FeO keptb wt% H 2Omolc wt% OHc wt% H 2Ototc CO2 (ppm)d e f g g h h h h i (a) 7.99 2,696 68.36 0.36 0.44 0.80 2,094 87 3,128 0.041 0.959 1.61 0.73 1.76 0.17 −5.991 2,059 Run1#2 0.24 3 0.07 0.01 0.16 431 17 612 0.008 7.81 2,692 83.10 0.27 0.55 0.82 582 91 482 0.174 0.826 1.65 0.55 2.20 0.05 −5.952 524 Run3#4 0.28 2 0.12 0.02 0.37 132 40 217 0.078 8.01 2,692 69.32 0.27 0.58 0.85 215 96 183 0.359 0.641 1.71 0.53 2.35 0.02 −5.903 269 Run4#4 0.18 1 0.02 0.04 0.08 87 9 30 0.048 7.60 2,689 73.71 0.36 0.66 1.02 1022 131 1,165 0.124 0.876 2.05 0.72 2.67 0.08 −5.634 1,062 Run19#1 0.16 2 0.07 0.06 0.23 204 29 265 0.028 (b) 5.86 2,680 79.40 0.69 0.81 1.49 1429 216 2,926 0.103 0.897 2.99 1.37 3.22 0.12 −5.198 2,059 Run1#4 0.23 1 0.06 0.02 0.13 299 19 256 0.009 5.84 2,679 69.84 0.80 0.74 1.55 661 231 967 0.229 0.771 3.09 1.61 2.97 0.05 −5.141 1,013 Run2# 8 0.16 2 0.10 0.06 0.23 142 34 145 0.034 5.68 2,694 82.50 0.34 0.38 0.73 383 58 519 0.111 0.889 1.47 0.69 1.55 0.03 −6.341 524 Run3#5 0.22 1 0.09 0.02 0.20 103 16 145 0.031 5.57 2,690 81.42 0.55 0.41 0.95 n.d. 95 183 0.356 0.644 1.92 1.10 1.64 n.d. −5.909 269 Run4#5 0.18 1 0.04 0.03 0.10 10 31 0.051 5.49 2,679 73.92 0.74 0.77 1.51 504 222 1,050 0.210 0.790 3.03 1.48 3.09 0.04 −5.175 1,062 Run19#2 0.18 4 0.19 0.04 0.39 101 57 272 0.054 (c) 2,059 Run1#6 4.51 2,678 69.61 0.66 0.92 1.58 1,170 285 2,820 0.136 0.864 3.16 1.32 3.69 0.10 −4.959
P tot
(bar) Run Na2O + K2O Density a (g/l) % FeO keptb wt% H 2Omolc wt% OHc wt% H 2Ototc CO2 (ppm)d e f g g h h h h i 0.12 1 0.06 0.03 0.16 277 28 286 0.014 4.36 2,694 93.22 0.30 0.41 0.71 279 71 504 0.136 0.864 1.43 0.61 1.66 0.02 −6.165 524 Run3#6 0.19 1 0.04 0.01 0.10 75 10 81 0.021 4.49 2,689 71.69 0.32 0.66 0.98 73 124 152 0.465 0.535 1.98 0.65 2.65 0.01 −5.678 269 Run4#6 0.15 1 0.06 0.02 0.17 31 22 33 0.091 4.49 2,691 71.07 0.34 0.57 0.91 613 109 1,192 0.103 0.897 1.83 0.69 2.28 0.05 −5.791 1,062 Run19#3 0.10 0 0.05 0.04 0.15 144 18 205 0.018
Table 4 Best-fit thermodynamic parameters for Eq. 17 Composition ΔV 0 ln K 0 P 0(bar) T 0(°C) VES-9 31 −14.10 ± 0.03 1,000 1,200 ETN-1 23 −14.55 ± 0.00 1,000 1,200 PST-9 6 −14.74 ± 0.01 1,000 1,200 V carbonate
Thibault et al. (1994) Leucitite 22 Pan et al. (1991) Tholeiite 23 ± 1.03 −14.83 ± 0.1 1,000 1,200 Stolper and Holloway (1988) Tholeiite 33 ± 0.5 −15.15 ± 0.06 1,000 1,200 Stolper et al. (1987) NaAlSi3O8 25 Spera and Bergman (1980) Andesite CA 34 Spera and Bergman (1980) Tholeiite K1921 33 Spera and Bergman (1980) Olivine Melilite OM1 23