Design of Novel Lithium Storage Materials with a Polyanionic
Framework
MASACUS-- M E by
JAE CHUL KIM
B.S., M.S. Materials Science and Engineering Korea University (2005, 2007)
j ASOF TECHNOLOGY
MAY
14
2014
LIBRARIES
,
Submitted to the Department of Materials Science and Engineering in Partial Fulfillment of the Requirements for the Degree of
DOCTOR OF PHILOSOPHY at the
MASSACHUSETTS INSTITUTE OF TECHNOLOGY February 2014
0 2013 Massachusetts Institute of Technology. All rights reserved.
Signature of A uthor ... ...
Department of Materials Science and Engineering December 18, 2013 C ertified by ...
Gerbrand Cedei? R. P. Simmons Professor of Materials Science and Engineering
Thesis Supervisor A ccepted by ...
R. P. Simmons Professor of Materials Science and Engineering Chair, Departmental Committee on Graduate Students
Design of Novel Lithium Storage Materials with a Polyanionic Framework
by
JAE CHUL KIM
Submitted to the Department of Materials Science and Engineering
on December 18, 2013 in Partial Fulfillment of the Requirements for the Degree of Doctor of Philosophy in Emerging, Fundamental, and Computational Studies in Materials
Abstract
Lithium ion batteries for large-scale applications demand a strict safety standard from a cathode material during operating cycles. Lithium manganese borate (LiMnBO3) that crystallizes into a hexagonal or monoclinic framework is one prominent polyanionic compound to cope with such requirement since it can possess high safety and high
ener-gy density simultaneously, without trading one for the other, theoretically. However,
the hexagonal phase was nothing but a disregarded composition due to its negligible Li intercalation capacity. In contrast, the monoclinic LiMnBO3 compound exhibited much more electrochemical activity than the hexagonal polymorph. In this thesis work, the discharge capacity of 100 mAh g1 with acceptable capacity retention was achieved by simple optimization. The different electrochemical behaviors between them were under-stood in relation to their structural difference as it affects the Li migration barrier, structural stability of Li-deficient states, and even particle morphology.
However, although promising, monoclinic LiMnBO3 needed further improvement in terms of the achievable capacity and cyclability. Electrochemical analysis showed that the limited capacity of LiMnBO3 mostly originated from transport limitation, a hindered Li migration through the one-dimensional diffusion channel. It also struggled from the phase decomposition and Mn dissolution due to the instability of the delithiat-ed state, which ldelithiat-ed to gradual capacity fading in prolongdelithiat-ed cycles. As an effective mate-rials design strategy to overcome such limitations, systematic substitution of transition metal elements was proposed. To increase achievable capacity, Mn was partially substi-tuted by Fe. Also, to fortify the structural integrity, Mg replaced Mn. In order to obtain both improved capacity and cyclability, Fe and Mg are co-doping led to an optimized composition. Prepared by cold-isostatic pressing, LiMgo.1Mno.5Feo.4BO3 showed near the-oretical capacity of 200 mAh g-1 with much improved capacity retention. These newly es-tablished materials outperformed most of the polyanionic cathode compounds. Therefore, it can be concluded a new promising candidate as a Li storage material has been devel-oped through this thesis research.
Acknowledgement
First and foremost, I would like to thank my thesis advisor, Professor Gerbrand Ceder, for his thoughtful guidance and ample support to complete this work. Through his profound scientific knowledge and insights, Prof. Ceder has enlightened and broad-ened my perspective for materials science and engineering and the electrochemical sys-tem. His passion and vision for the emerging energy storage materials made my research more fruitful and mature.
I am also grateful to my thesis committee members, Professors Donald R. Sadoway
and Jeffrey C. Grossman for sharing their invaluable time and expertise. Their extraor-dinary comprehensions in materials chemistry and quantum physics were of great value to my research. I must thank Professor Sahn Nahm, my M.S. advisor, for his constant encouragement and mentorship, which have formed the firm basis of my Ph.D. study.
I express my very special thanks to ShinYoung Kang who has shared all the joys
and sorrows in my MIT life. In my long and rough journey, I was able to tough it out be-cause of her warm encouraging words and gestures. She has been my best friend, col-league, and mentor to whom I can really open up myself and ask for advices.
I sincerely thank Prof. Jae Kyung Kim, Jaehoon Lee, Prof. Hyowon Gweon, and
Yale Song for their mental communion with me in my graduate school years. Good memories we have shared shall never be forgotten.
It was a pleasure to interact with Jinhyuk Lee and Dr. Dong-Hwa Seo in the same group. Their enthusiasm and creativity were an invaluable inspiration to me. I am in-debted to Charles J. Moore and Dr. Xin Li, who have always been great devotees to my research. It was more than an exciting experience to collaborate closely with them. I am also lucky to work with the experimental team in Ceder group. Dr. Plousia Vassilaras, Nancy Twu, Dr. Lei Liu, Ian Matts, Di Wu, and Yuechuan Lei have been helpful and a great asset to me at all time.
I thank all other Ceder group members and alumni, as well. Prof. Byoungwoo
Kang, Prof. Byungchan Han, Prof. Kisuk Kang, Dr. Xiaohua Ma, Prof. Yifei Mo, Dr. Ya-bi Wu, Dr. Rahul Malik, Dr. Ruoshi Sun, Prof. Hailong Chen, Prof. Shyue Ping Ong, Dr. Geoffroy Hautier, Dr. Anubhav Jain, Dr. Kristin Persson, Dr. Pieremanuele Canepa, Dr. Sai Jayaraman, Dr. Alexander Urban, Dr. Eric Wang, Dr. Bo Xu, Dr. Hong Zhu, Aziz Abdellahi, Stephen Dacek, Wenxuan Huang, Daniil Kitchaev, William Richards, Ziqin Rong, Wenhao Sun, Alexandra Toumar, Lusann Wren Yang, and Kathryn E. Simons have provided an intellectually stimulating research environment and administrative support to me.
I must express my gratitude to my Korean community in DMSE, especially for
Heechul Park, Dr. Hyeongho Shin, Dr. Hyunjung Yi, Jaebyum Chang, Dr. Eunseon Cho, Dahyun Oh, Jae Jin Kim, Jeongyun Kim, Mansoo Park, Alan Gyehyun Kim, Donghun Kim, Jiyoun Christina Chang, Sangtae Kim, Sangjin Lee, Kyoung-Won Park, Intak Jeon, Hyoungwon Park, Dr. Sehoon Chang, Dr. Dong Hun Kim, Prof. Hojong Kim, and
I must praise my beloved vehicle, the ultimate driving machine, for giving me a shear pleasure that sets me free from the stress and struggle. It has been more than just transportation to me as I have found my peace of mind while driving it.
I cannot thank my parents more than enough for their endless and unconditional love and unlimited support, which I shall never forget as long as I live. Without their encouragement, this work would never be accomplished. I also thank my sister, Jay Young for her devotion and dedication to our family. My gratitude goes to
parents-in-law and sister-in-parents-in-law for their bottomless care, as well.
Most of all, I give my sincerest thanks to my wife, Kiyoung Yoo. I was able to de-pend on her encouragement all the time when I was in doubt. She always raised me up when I was down and let me walk at a steady pace when I was too hasty. Her patience, understanding, and devotion were beyond all description and essential to make this work possible.
Table of Contents
List of Figure Captions 11
List of Table Captions 20
PART ONE 23
CHAPTER 1. INTRODUCTION AND MOTIVATION, OVERVIEW OF THE THESIS 25
1.1. Introduction and motivation 27
1.1.1. Li-ion battery as a mobile energy source 27 1.1.2. An increasing demand of high performance Li-ion batteries and
mo-tivation to find a new cathode material 28
1.2. Overview of the thesis 30
CHAPTER 2. LITHIUM ION BATTERY GENERALS 33
2.1. Li-ion battery generals: fundamental thermodynamics of an
electro-chemical system 36 2.1.1. Voltages 36 2.1.2. Capacities 39 2.1.3. Cyclability 40 2.1.4. Rate capability 40 2.1.5. Safety 41
2.2. Commercially available Li intercalation compounds 42
2.2.1. Layered oxides 42
2.2.2. Spinel oxides 43
2.2.3. Phospho-olivines 45
2.3.2. Inductive effect 49
2.3.3. Electronic conductivity 51
2.3.4. Gravimetric / volumetric energy density 51
2.3.5. Packing density / processing cost 52
2.3.6. Summary 53
PART TWO 55
CHAPTER 3. DESIGNING A NEW CATHODE MATERIAL 57
3.1. Lithium manganese borate compounds (LiMnBO3) 60
3.1.1. Motivation 60
3.1.2. Literature review 63
3.1.2.1. Structural framework of lithium (transition) metal borates 63 3.1.2.2. The monoclinic and hexagonal polymorphs of LiMnBO3 64
3.1.2.3. The electrochemical properties of lithium transition metal
bo-rates 68
3.1.2.4. High-throughput computation driven material screening and fil-tering to discover LiMnBO3 as a new Li intercalation cathode 71
3.2. Results 75
3.2.1. Experimental procedure 75
3.2.1.1. Solid-state synthesis 75
3.2.1.2. Structure and morphology analysis 77
3.2.1.3. Electrochemical performance 78
3.2.2. Temperature-dependent phase formation of LiMnBO3 79
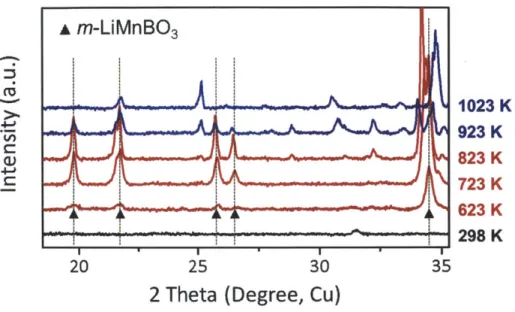
3.2.2.1. In-/ex-situ X-ray diffraction patterns of Li-Mn-B-O mixture 79
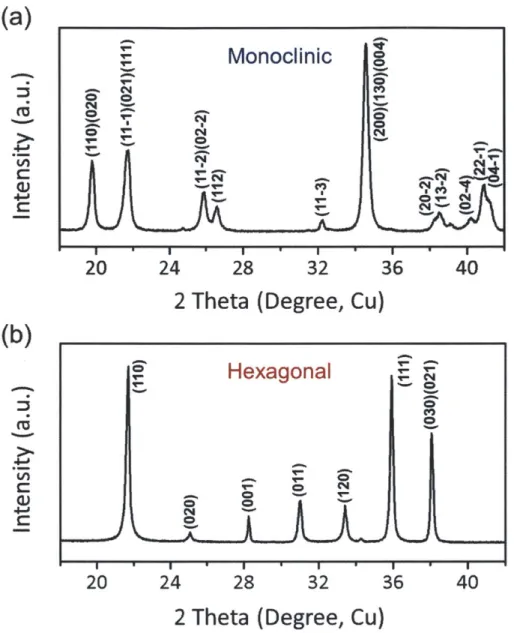
3.2.2.2. Monoclinic LiMnBO3 82
3.2.2.3. Hexagonal LiMnBO3 84
3.2.3.1. Monoclinic LiMnBO3 86
3.2.3.2. Hexagonal LiMnBO3 87
3.2.3.3. Optimizing the electrochemical properties of LiMnBO3 poly-morphs by planetary ball-milling and carbon coating 88
3.3. Discussion 96
3.3.1. Diffusion behaviors of monoclinic and hexagonal LiMnBO3 96 3.3.2. Delithiated state stabilities of monoclinic and hexagonal LiMnBO3
99
3.3.3. Particle size and polarization 100
3.4. Conclusion 101
CHAPTER 4. UNDERSTANDING PERFORMANCE-LIMITING FACTORS OF
MONOCLINIC LITHIUM MANGANESE BORATE 103
4.1. Factors influencing the electrochemical performance of LiMnBO3 105
4.2. The limited specific capacity achievable 106
4.2.1. Transport limitation 106
4.2.1.1. Temperature and rate dependence of Li activity 106 4.2.1.2. Galvanostatic intermittent titration test (GITT) 109 4.2.1.3. Potentiostatic intermittent titration test (PITT) 116
4.2.1.4. Diffusivity of LiMnBO3 118
4.2.1.5. Channel blocking antisite defects 122
4.2.2. Discussion 125
4.3. Capacity fading upon cycling 129
4.3.1. Limitation from structural instability 129
4.3.1.1. Computed formation enthalpy 130
4.3.1.2. Electrochemical charging 132
4.3.1.3. Chemical delithiation 135
4.3.2.2. Mn dissolution 140
4.4. Conclusion 142
PARTTHREE 143
CHAPTER 5. DESIGNING HIGH CAPACITY POLYANIONIC CATHODES 145
5.1. Substitution strategy 147
5.1.1. Motivation 147
5.1.2. The substitution criteria 149
5.1.3. Inactive element substitution 151
5.1.3.1. LiMgyMnl-yB03 (0 y 0.2) 153
5.1.3.2. LiZnyMn1yBO3 (0 y ! 0.2) 157
5.1.4. Active element substitution 159
5.1.4.1. LiMni-zFezBO3 (0 z ! 0.35) 160
5.1.4.2. LiMnj-zMzBO 3 (M =Co, Ni, and Cu, 0 ! z 0.35) 165
5.2. Inactive and active element co-doping: LiMgo.lMnl-zFezBO3 (0.3 5 z 0.4) 170
5.2.1. Optimizing composition 170
5.3. Cycling performance improvement by processing control 175
5.3.1. Motivation 175
5.3.2. Cold-isostatic pressing (CIP) 177
5.3.3. Improved cyclability of LiMnBO3 by CIP 179 5.3.4. Improved cyclability of LiMgo.lMno.5Feo.4BO3 by CIP 183
5.4. Conclusion 189
CHAPTER 6. CONCLUDING THESIS STATEMENTS 191
List of Figure Captions
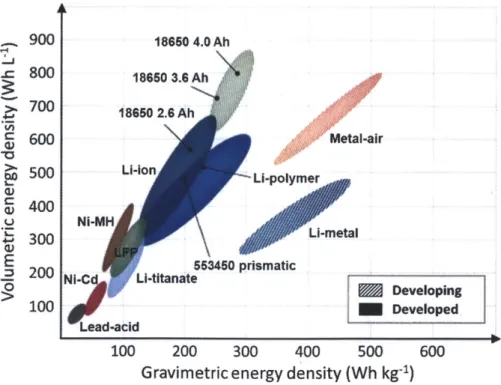
Figure 1-1. Figure 1-2. Figure 2.1. Figure 2-2. Figure 2-3. Figure 2-4. Figure 2-5. Figure 2-6. Figure 3-1.Energy densities of various kinds of commercial rechargea-ble batteries
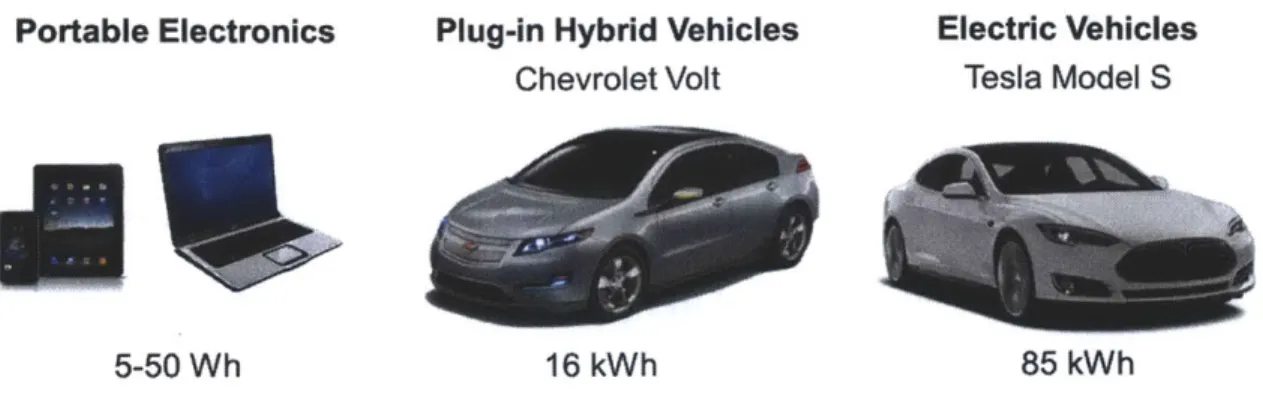
Examples of the industrial applications that adopt Li-ion batteries as a power source.
Schematic (a) configuration of conventional Li-ion battery cell and (b) its voltage/energy diagram during operation. The electrical work deliverable is defined by Equation 2-1. In the ideal case, V2oc-Vioc = V is the maximum voltage
dif-ference available.
Schematic illustration of a layered oxide with 03 stacking. Schematic diagram of a representative spinel oxide, LiMn204.
Schematic diagram of a representative phosphor-olivine, LiFePO4.
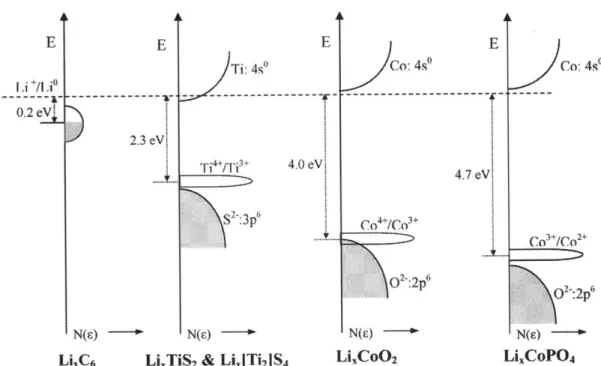
Schematic diagrams of the electron energy versus density of states of 3d-band in transition metal (Mn+/M(n+l)+) and
2p-band in oxygen (02-) (a) with overlapping and (b) without overlapping.
(a) The energy diagram of M-0 bonds, (b) various Fe-O pol-yhedra with different coordination numbers, and (c) energy level of Fe2+/Fe3+ redox elements with respect to metallic lithium in the NASICON structure with different M-0-X bonds
Schematic diagrams of LiMnBO3 polymorphic structures (Yellow; Li, Green; Mn, White; B, Shade; 0 polyhedra). The space group for each phase is (a) C2/c(monoclinic, #15) and (b) P-6(hexagonal, #174), respectively. 28 29 34 42 44 45 48 50 65
Figure 3-2. Figure 3-3. Figure 3-4. Figure 3-5. Figure 3-6. Figure 3-7. Figure 3-8. Figure 3-9. Figure 3-10.
Schematic diagrams of (a) Idealized 2D layer of LiFeBO3, (b) LiFeBO3 structure in the literatures including anisotropic displacement for 0 atoms, and (c) LiFeBO3 fragment from the modulated superstructure.
Representative electrochemical properties of lithium transi-tion metal borates in the literature: (a) Hexagonal LiMnBO3 displays large irreversibility at the initial cycle and only in-tercalates 0.02 Li per formula unit (4 mAh g-1).42 (b)
Hexag-onal LiMnBO3 shows 75.5 mAh g-1, but it is most likely to
originate from a conversion reaction below 1.5 V.58 (c)
LiFe-B03 outperforms other borates in terms of a capacity.43 (d)
LiCoBO3 shows a negligible capacity.
Calculated formation enthalpies of (a) monoclinic and (b) hexagonal LiMnBO3, and (c) their corresponding voltage profiles with respect to Li contents.
The flowchart of experimental procedure for LiMnBO3 syn-thesis.
In-situ XRD patterns of pelletized Li-Mn-B-0 with respect
to temperature change.
XRD patterns of Li-Mn-B-0 mixture calcined at 623 K and followed by sintering at (a) 773 K and (b) 1073 K.
Rietveld refinement and profile matching of monoclinic LiMnBO3 sintered at 773 K, whose space group is C2/c
(ICSD# 200535). The calculated pattern matches well with the observed one.
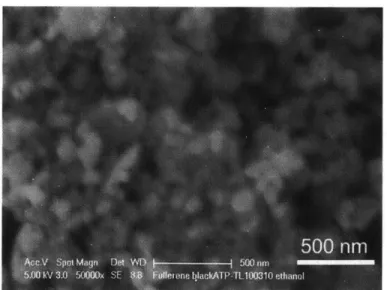
SEM image of monoclinic LiMnBO3 sintered at 773 K.
Rietveld refinement and profile matching of hexagonal LiMnBO3 sintered at 1073 K, whose space group is P-6 (ICSD# 94318). 66 69 73 76 80 81 82 83 84
Figure 3-3. Figure 3-4. Figure 3-5. Figure 3-6. Figure 3-7. Figure 3-8. Figure 3-9. Figure 3-10. Figure 3-19. Figure 3-11. Figure 4-1.
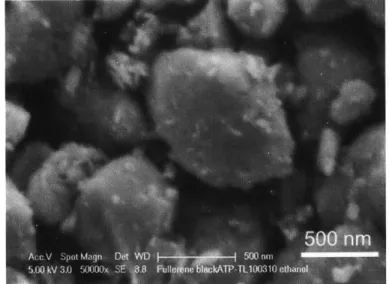
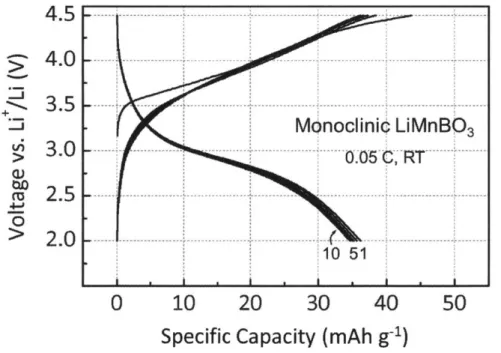
SEM image of hexagonal LiMnBO3 sintered at 1023 K. Voltage versus capacity profiles of monoclinic LiMnBO3 cy-cled at a 0.05 C rate.
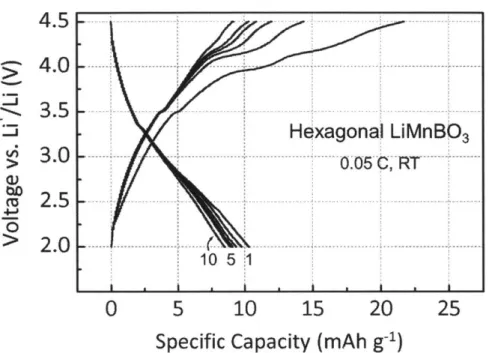
Voltage versus capacity profiles of hexagonal LiMnBO3 cy-cled at a 0.05 C rate.
SEM image of monoclinic LiMnBO3 and carbon black mixed by planetary ball-milling.
Voltage versus capacity profiles of monoclinic LiMnB03 cathode prepared by planetary ball-milling (solid) and its comparison to the manually mixed one (dashed). Both were cycled at a 0.05 C rate.
SEM image of carbon coated monoclinic LiMnBO3 prepared by planetary ballmilling after annealing.
HR-TEM image of carbon-coated monoclinic LiMnBO3 par-ticles.
Voltage versus capacity profiles of carbon-coated (a) mono-clinic and (b) hexagonal LiMnBO3 (solid lines) cycled at a
0.05 C rate.
Ex-situ XRD patterns of the cycled monoclinic LiMnBO3
cathode films which are collected (a) before cycling (charged), (b) after the first charge, (c) after the first dis-charge, and (d) after the 10th charge. To obtain charged and discharged state, the electrodes were charged and dis-charged in CCCV mode within 4.5-2.0 V with a 0.05 C rate. Schematic diagrams of Li diffusion path and activation bar-riers of Li diffusion in delithiated states of (a) monoclinic and (b) hexagonal LiMnBO3.
Voltage vs. capacity profiles of LiMnBO3 in various condi-tions: (a) pristine and (b) carbon-coated LiMnBO3 at a 0.05
85 86 88 89 90 91 92 93 94 97 107
Figure 4-2. Figure 4-3. Figure 4-4. Figure 4-5. Figure 4-6. Figure 4-7. Figure 4-8. Figure 4-9. Figure 4-10.
C rate with respect to temperature, and (c) carbon-coated LiMnBO3 at room temperature (RT) with respect to a rate. Schematic diagrams of Li concentration profile in LiMnBO3 cathode with respect to Li extraction and corresponding voltage profiles: (a-e) ideal and (f-j) real cases.
(a) Schematic diagram of cell configuration used in GITT and (b) applied galvanostatic current pulse and its response in voltage with respect to time.
Voltage profile with respect to x in Lil-xMnBO3/C and elapsed time according to SOC: (a) 15%, (b) 25%, and (c) 45% obtained by GITT.
Estimated sequential non-equilibrating Li concentration profile of LiMnBO cathode during charging by GITT.
Schematic plots of one step of a potentiostatic input and its corresponding current response in PITT.
Linear fittings of current with respect to time to derive dif-fusivity.
Incremental charge with respect to voltage obtained by PITT at RT with interval of 10 mV. Data points represent the value at every 50 mV.
Li chemical diffusivities obtained by PITT: the values were collected with a 10 mV voltage step from 2-4 V charging and 4.5-2.5 V discharging but plotted with 50 mV intervals for clarity. The diffusivity displays three distinctive regions in charge (I, II, and III) and discharge (IV, V, and VI).
Profile matching of the XRD pattern of monoclinic LiMnBO3 (top) with and (bottom) without antisite defects (Mn in Li sites) whose agreement indexes are Rp=7.66, RWP=9.84 and Rp=5.86, Rwp=8.24, respectively. 111 112 114 115 116 119 120 121 123
Figure 4-11. Figure 4-12. Figure 4-13. Figure 4-14. Figure 4-15. Figure 4-16. Figure 4-17. Figure 4-18. Figure 4-19.
Particle size distribution and its correlation with the antis- 124 ites. (a) SEM image of LiMnBO3/C particles (scale bar: 500
nm) and (b) Representative particle size distribution and volume fraction.
Schematic illustration of one-dimensional diffusion path 126 parallel to [001] direction in monoclinic LiMnBO3 assuming 4.47% antisites in the channel.
Integrated incremental charge (dQ dV-1) with respect to 127 voltage (V). The voltage profile as a function of specific ca-pacity acquired by integrating the incremental charges over voltage from PITT.
Li-Mn-B-O quaternary phase diagram. 131
(a) Voltage vs. capacity curves of LiMnBO3/C in the second 132 cycle at 0.01 C and 0.05 C, RT, (b) their capacity retention for 10 cycles with photographs of the anode after the
desig-nated discharge cycles, and (c) ex-situ XRD patterns of charged Lil-xMnBO3/C electrodes with different obtained ca-pacity.
(a) XRD patterns, (b) HR-TEM images (scale bar: 5 nm), and 135 (c) 7Li MAS NMR spectra of pristine and chemically delithi-ated Lil-xMnBO3 respectively.
Schematic diagram of c-lattice parameter change upon deli- 136 thiation.
XRD pattern and HR-TEM image (scale bar: 5 nm) of chem- 136 ically delithiated Lil-xMnBO3 for 10 days. The inset is elec-tron diffraction pattern of the specimen showing a typical diffused amorphous ring pattern.
Profile matching of the XRD pattern of chemically delithiat- 138 ed MnBO3.
Figure 4-20. Figure 4-21. Figure 5-1. Figure 5-2. Figure 5-3. Figure 5-4. Figure 5-5.
Graphical representation of Li grand-potential phase dia-gram with competing phases of LiixMnBO3 at pLi=4.64 eV. Red dots stand for stable phases. LiixMnBO3 is marked with the blue cross, which is unstable with respect to
Li4B207, Mn2BO4, and Mn304.
EDS of the designated spot on the Li anode in Figure 4-11(b) verifies that the identity of the stain is Mn deposited from the cathode during cycling, excluding P and F from the soaked electrolyte salt and C and 0 from the equipment. Computed average voltage in phosphates versus maximum gravimetric capacity achievable. Specific energy curves at 600 and 800 Wh/kg are drawn on the figure (blue dashed lines). The red dashed line indicates the upper voltage which we consider safe against decomposition of the electro-lyte.
Schematic diagram of edge-sharing trigonal bipyramidal Mn coordinated by five 0. Mn sits off-centered from the trigonal bipyramidal sites and tends to occupy either the
upper or lower tetragonal-like site.
Graphical representation of computed Mn-B-0 2 ternary
phase diagram. Red dots stand for stable phases. MnBO3 is marked with the blue cross, which is unstable with respect to MnO2, Mn2O3, and MnB407.
(a) XRD patterns of LiMgyMnl-yBO3 (0 5 y 5 0.2) fired at
773-823 K and (b) their refined lattice parameters.
Five consecutive charge and discharge curves for LiMgyMni. yBO3 (0 5 y < 0.2): (a) y=0.05, (b) y=0.1, and (c) y=0.2 cycled at a 0.05 C rate. For comparison, the representative second cycles of each y are plotted in (d). The dotted line represents
139 140 147 150 152 154 155
Figure 5-6. Figure 5-7. Figure 5-8. Figure 5-9. Figure 5-10. Figure 5-11. Figure 5-12. Figure 5-13. Figure 5-14. Figure 5-15.
the undoped LiMnBO3.
(a) STEM image and (b) the EELS line scan of designated location from bulk to surface, and HR-TEM image and elec-tron diffraction pattern of LiMgo.2Mno.8BO3/C particle.
(a) STEM image and (b) the EELS line scan of designated location from bulk to surface, and HR-TEM image and elec-tron diffraction pattern of LiMnBO3/C particle.
XRD patterns of LiZnyMnlyBO3 (0 < y < 0.2) fired at 773-823 K
Five consecutive charge/discharge curves of LiZnyMnl-yBO3 (0 s y < 0.2): (a) y=0.05 and (b) y=0.1 cycled at a 0.05 C rate. The dotted line represents the undoped LiMnBO3.
(a) XRD patterns of LiMni-zFezBO3 (0 < z 5 0.35) fired at 773-823 K and (b) their refined lattice parameters.
Five consecutive charge/discharge curves for LiMni-zFezBO3 (0 < z < 0.35): (a) z=0.05, (b) z=0.1, (c) z=0.2, (d) and z=0.35 cycled at a 0.05 C rate. For comparison, the representative second cycles of each z are plotted in (e). The dotted line represents the undoped LiMnBO3. (f) The first three volt-age-capacity profiles of LiMno.65Feo.35BO3 initiated by dis-charging (red) and their comparison to those of (d).
(a) STEM image and (b) the EELS line scan of designated location from bulk to surface, and HR-TEM image and elec-tron diffraction pattern of LiMno.8Feo.2BO3/C particle.
XRD patterns of LiMni-zMzBO3 (0 < z 5 0.35) fired at 773-823 K: (a) M = Co, (b) M = Ni, and (c) M = Cu.
Refined lattice parameters of LiMnl-zMzBO3 (0 5 z < 0.35)
fired at 773-823 K: (a) M = Co, (b) M = Ni, and (c) M = Cu. The representative second cycles of LiMni-zMzBO3 (0 5 Z <
156 156 157 158 160 161 164 166 167 168
Figure 5-16. Figure 5-17. Figure 5-18. Figure 5-19. Figure 5-20. Figure 5-21. Figure 5-22. Figure 5-23. Figure 5-24.
0.35) for (a) M = Co, (b) M = Ni, and (c) M = Cu. Note that LiMno.6 5Cuo.3 5BO3 was not able to be tested due to repeated
cell failure after the first charging.
(a) XRD patterns of LiMgo.1Mno.9-zFezBO3 (0.3:5 z 5 0.4) fired at 823 K and (b) their refined lattice parameters.
Five consecutive charge/discharge curves for LiMgo.1Mno.9. zFezBO3 (0.3 < z _ 0.4): (a) z = 0.3, (b) z = 0.35, and (c) z = 0.4 cycled at a 0.05 C rate. For comparison, the representative second cycles of each z are plotted in (e).
Simplified schematic diagrams of pressure application dur-ing (a) uniaxial pressdur-ing and (b) CIP.
Optimal change in particle size distribution to minimize side reaction by removing very small particles
Measurement of pellet diameter after firing at 773 K for 10 h prepared by (a) uniaxial pressing and (b) CIP.
Rietveld refinement and profile matching of LiMnBO3 pre-pared by (a) uniaxial pressing and (b) CIP, which are fired at 773 K and annealed at 773 K for carbon coating.
SEM images of carbon-coated LiMnBO3 prepared by (a) uniaxial pressing and (b) CIP in different magnifications, and (c) particle size distribution comparison between them. (a) Five consecutive charge and discharge curves for carbon-coated LiMnBO3 at a 0.05 C rate prepared by CIP and (b) capacity retention during 10 cycles. For reference, LiMnBO3 without CIP is also plotted (open triangle).
Rietveld refinement and profile matching of LiMgo.1Mno.5Feo.4BO3 prepared by (a) uniaxial pressing and
(b) CIP, which are fired at 823 K and annealed at 798 K for carbon coating. 171 172 177 177 179 180 181 182 184
Figure 5-25.
Figure 5-26.
Figure 5-27.
Figure 5-28.
SEM images of carbon-coated LiMgo.iMno.5Feo.4BO3 pre-pared by (a) uniaxial pressing and (b) CIP in different mag-nifications, and (c) particle size distribution comparison between them.
(a) Five consecutive charge and discharge curves for carbon-coated LiMgo.lMno.5Feo.4BO3 at a 0.05 C rate prepared by CIP and (b) capacity retention during 10 cycles. For refer-ence, LiMnBO3 without CIP is also plotted (open circle). Rate capability comparison at discharge between (a) LiMnBO3 and (b) LiMgo.1Mno.5Feo.4BO3 prepared by CIP. Each curve was charged at a respective 0.05 C rate prior to
discharging.
Schematic diagram of one-dimensional Li diffusion and lat-tice planes surrounding the path.
185
186
188
List of Table Captions
Table 3-1. Table 3-2. Table Table Table Table Table 3-3. 3-4. 3-5. 3-6. 4-1. Table 4-2. Table 4-3. Table 5-1. Table 5-2. Table 5-3. Table 5-4.Structural parameters of lithium metal borates
Computed (theoretical) properties of the LiMnBO3 poly-morphs
Rietveld refinement result of monoclinic LiMnBO3
Site occupancy of monoclinic LiMnBO3
Rietveld refinement result of hexagonal LiMnBO3 Site occupancy of hexagonal LiMnBO3
Computed stability of LiixMnBO3 (0 _ x < 1) and its ground
states with respect to Li concentration at zero K. AE (meV/atom) stands for difference in energy from the com-puted ground states.
Computed stability of LiixFeBO3 (0 < x 5 1) and its ground
states with respect to Li concentration at zero K. AE (meV/atom) stands for difference in energy from the com-puted ground states.
Atomic ratio of m-LiMnBO3 specimen before and after
chemical delithiation by inductive coupled plasma (ICP, ASTM E 1097-12) and inert gas fusion (ASTM E 1019-11). The excess amount of Li and B may be due to the LiBF4 residue
Ionic radius (A) of possible substituents for Mn in LiMnBO3
Achieved electrochemical performance in LiMni.zFezBO3 cathode
Computed properties of lithium metal borates
Electrochemical performance of LiMgo.iMno.9-zFezBO3 (0.3 5
z < 0.4) cathodes 63 71 83 83 85 85 130 134 141 151 163 169 173
Table 5-5.
Table 5-6.
Rietveld refined lattice constants and derived parameters 180 of LiMnBO3 prepared by cold-isostatic pressing and fired at 773 K.
Rietveld refined lattice constants and derived parameters 180 of LiMgo.lMno.5Feo.4BO3 prepared by cold-isostatic pressing and fired at 823 K.
PA RT
ON
E
Introduction, motivation, and overview of the thesis
Lithium-ion battery generals
CHAPTER 1
INTRODUCTION AND MOTIVATION
OVERVIEW OF THE THESIS
The primary subject of this thesis is to discover and develop a new novel lithium intercalation material whose electrochemical performance can possibly surpass the contemporary cathode compounds for lithium-ion (Li-ion) batteries. During the thesis study, thorough investigation with scientific insights is devot-ed to analyze and understand the electrochemical behavior of such a new candi-date material. Furthermore, on top of the scientific comprehension, engineering efforts are dedicated systematically to maximize the immanent performance of the material to assess its potential as a promising candidate for Li-ion battery cathode.
solid-finement for structural analysis, electron microscopy for morphological and mi-crostructural investigation. Elemental analysis and detection are completed by several spectroscopy techniques. Other supportive practices, for example and 7Li
magic angle spinning nuclear magnetic resonance, Brunauer-Emmett-Teller method and thermogravimetric analysis, are also adopted when necessary. Vari-ous electrochemical testing sequences such as galvanostatic cycling, cyclic volt-ammetry, impedance spectroscopy, and galvanostatic/potentiostatic intermittent titration test are applied to characterize and evaluate the energy storing perfor-mance in an electrochemical cell with two-electrode configuration.
Also, as an efficient and effective way to discover materials properties and understand physical phenomena, the results predicted by ab initio computation are often referred and compared with the experimental outcomes. Moreover, ac-tive collaboration with other research groups has been conducted in order to fa-cilitate the progress of this study.
1.1.
Introduction and motivation
1.1.1.
Li-ion battery as a mobile energy source
It is now the advancing era of ubiquitous network, mobile workstation, and hybrid electric vehicles. Such a high-tech lifestyle could have not been managed without mobile power sources represented by lithium ion (Li-ion) batteries. Therefore, its importance as the most promising portable energy storage device cannot be too emphasized.
Moreover, there are even more to come in our future life due to the necessi-ty of emission-free technology, such as electrification of transportation and smart grid system, to deal with numerous regulations caring for the environment and global warming problem and to use the world's limited resources more wisely in a controlled manner, worldwide.'3 That being said, the Li-ion battery technology seems to hold a key to unlock the future development of the life, which will be so complex to be operated that it requires significantly larger capacity of portable energy.
In this chapter, the requirements and prospects of research in Li-ion bat-tery are discussed in brief. Also, to serve as an introductory chapter, the over-view of this thesis will be laid out.
1.1.2.
An increasing demand of high performance
Li-ion batteries and motivation to find a new
cathode material
Li-ion batteries can carry a substantially larger amount of energy than oth-er rechargeable battoth-eries. As illustrated in Figure 1.1,4 it dominates the enoth-ergy density space over the lead-acid and nickel based materials. In this reason, al-most all of the current portable electronics and some of the (hybrid) electric vehi-cles exemplified in Figure 1.2 utilize Li-ion batteries, which are composed of a graphite anode and LiCoO2 cathode, as their power sources.
. 900 18650 4.0 Ah 3 18660 3.6 Ah 18650 2.6 Ah 600 Metal-air 500 Li-Ion Li-polymer 5 400 Ni-MH 300 L0-metal E 553450 prismatic
200 Ni-C Li-titanate Developing
100 Developed
Lead-acid
100 200 300 400 500 600
Gravimetric energy density (Wh kg1)
Portable Electronics Plug-in Hybrid Vehicles Electric Vehicles
Chevrolet Volt Tesla Model S
5-50 Wh 16 kWh 85 kWh
Figure 1-13. Examples of the industrial applications that adopt Li-ion batteries as a power source (images from http:images.google.com).
However, it is rather debatable to fulfill the further large-scale necessity like a long-range electric vehicle and smart grid system with the current Li-ion battery system due to the high material cost of Co and the explosive risk of LiCoO2 compound during operation.5 Thus, one of the main focuses in the Li-ion battery community has been onto finding entirely new chemistry of materials to
substitute LiCoO2.6 Unfortunately, nevertheless of the hard work devoted to bring down the cost and improve the safety of Li-ion batteries, LiCoO2 cannot be
replaced yet by any other candidate materials in terms of electrochemical per-formance, so that it is still the most frequently used cathode compound since Sony Corporation firstly introduced it into the market in 1990s.
1.2.
Overview of the thesis
The objectives of the thesis work are to develop a new Li intercalation cath-ode with the guaranteed safety and to understand its experimental electrochem-ical behaviors. Moreover, in the process of understanding, the high capacity cathode material is to be designed and optimized for maximal electrochemical performance by remedying identified performance-limiting factors.
To be specific, the material of my interest in this thesis work is monoclinic lithium manganese borate, LiMnBO3. The primary focus was to synthesize the phase-pure LiMnBO3 specimen and recognize its potential and limitation as a Li storage cathode since it had been completely unknown as a Li-ion battery cath-ode (until a part of this work testified its first electrochemical results and
analy-sis).7 Afterwards, the thermodynamic and kinetic characteristics of material
were analyzed in depth to define performance-limiting factors and understand its electrochemical behavior. The identified problems were sluggish Li transport originated by diffusion channel blockage and phase instability upon the high level of Li extraction. With much endeavor, such limiting obstacles were finally addressed by applying appropriate strategies for the well-defined problems. In the end, the LiMnBO3 compound was suggested as a promising candidate mate-rial with high capacity and safety for Li-ion battery applications.
The thesis is mainly consisted of three parts; introduction and motivation (PART ONE), finding of a new material and understanding its electrochemical behaviors (PART TWO), and improving the performance (PART THREE).
PART ONE
Chapters 1 and 2 contain the motivation of the research and brief introduction to Li-ion batteries and its intercalation compounds.
PART TWO
Chapter 3 introduces and justifies LiMnBO3 as a new chemistry of cathode ma-terials and reports its electrochemical performances. Chapter 4 is devoted to ex-plain the electrochemical behavior of the newly developed LiMnBO3 cathode by
analyzing its transport phenomena and charged state stability.
PART THREE
Chapter 5 highlights efforts to enhance the electrochemical performance of the electrode by forming solid solution compounds and controlling an experimental process. Finally, all of the work is summarized and concluded in Chapter 6.
CHAPTER 2
LITHIUM ION BATTERY GENERALS
A lithium ion (Li-ion) battery is an electrochemical energy storage device that can convert electrical energy into chemical energy and vice versa. The no-menclature, Li-ion battery, is globally accepted as Li+ ions are essentially in-volved in such energy conversion reaction. Since it can store and release charges reversibly, it is also known as a rechargeable Li battery or Li secondary battery. The battery (pack) is consisted of multiple electrochemical cells interconnected in series and/or parallel to provide a designated operation voltage and capacity. Each cell contains a cathode and an anode, which is separated by polymer films (separator) and merged into the electrolyte.
The cathode and anode serve as a positive and negative electrode, respec-tively. During operation, the Li+ ions will spontaneously diffuse out of the nega-tive electrode upon discharging and be delivered to the posinega-tive electrode by
(a)
Anode(b)
Charge Electrolyte Charge Discharge 0-Discharge Cathode Conductive matrix Active particleFigure 2.1. Schematic (a) configuration of conventional Li-ion battery cell and (b) its voltage/energy diagram during operation. The electrical work deliverable is defined by Equation 2-1. In the ideal case, V2**-V 1* = V is the maximum voltage difference
avail-able.
trespassing through the electrolyte in between. In the meantime electrons shall come out of the anode and flow into the cathode along an external circuit to
per-Potential Cathode2(delithiated) Cathode (11thated) V2
*C
*
voc
Anode LIform work. The reaction can be reversed by applying external potential to store the energy. This cyclic process is illustrated in Figure 2.1(a). Since the amount of energy to be performed and stored is determined by how much Li+ ion can be in-serted and extracted into and from the electrodes, the battery performance strongly depends upon the solid state chemistry of them. In this chapter, it is demonstrated how such an electrochemical cell operates and discussed the role of the electrodes in the system. Also, a few representative cathode materials are listed, and general characteristics of polyanionic compounds are summarized.
2.1.
Li-ion battery generals: fundamental
thermodynamics of an electrochemical
system
The performance of Li-ion battery is generally discussed in terms of (a) voltage, (b) capacity, (c) cyclability, (d) rate capability, and (e) safety. Moreover, the manufacturing cost and the toxicity of the raw materials are also important factors to be considered in Li-ion battery industries. In this section, such key pa-rameters are briefly stated.
2.1.1.
Voltages
Equation 2.1 defines the equilibrium potential (V), also known as the open-circuit voltage (OCV), where z and F stand for number of charge per formula unit and Faraday constant (96,485 C per mole), respectively. It is a thermody-namic quantity, which is set by the difference in Li chemical potential (UL) be-tween the anode and cathode. Thus, it can be adjustable by selecting various combinations of the electrodes.
Cathode Anode
V = -- i [2.1]
An anode is the material with high Ai such as Li metal, Li alloys, and Li-graphite. In commercial Li-ion batteries, the graphite is the anode of choice due to the safety issue of the others and reversibility during cycling.8 A cathode must have smaller PU than the anode and intercalate Li feasibly with chemical stabil-ity with carbonate-based organic electrolyte. These materials are mostly lithium transition metal oxides and polyanionic (oxo-anionic) materials.8
In battery research, charging means such a process to extract Li+ ions and thus electrons from the cathode and insert into the anode by convention. Equiva-lently, since Ai of a full (lithiated) cathode is higher than that of the Li-exhausted (delithiated) one, charging also stands for lowering 'Li of the cathode.
It can be done by applying a potential to the cell with an external power supply. In order for the cathode to be charged (that is, to lower PL), the potential applied must be larger than OCV of the lithiated cathode since YU is negatively propor-tional to the electric potential by Nernst equation (G = -xFc). Whenever Li in the
lithiated cathode is pumped to the anode, the cathode becomes capable of per-forming electrochemical work. Charging is therefore an energy storing process.
When charging is completed, the cathode is fully excited from its lithiated state. Thus, it is now willing to accept both Li+ ions and electrons spontaneously once it forms the closed circuit. Ideally, the voltage in Eqn. 2.1 will drive Li+ ions and electrons into the cathode from the anode. In the process, the cell performs work to the environment. This is defined as discharging of the cathode. The
charging and discharging process as a scheme of PLi and electric potential is il-lustrated in Figure 2.1(b).
In summary, the following reaction happens during charging and discharg-ing in the cathode.
LixMyZ Charging ) XLi+ + Xe- + MY xZ [2.2]
Discharging
LixMyZ D xLi+ + xe- + MY-XZ [2.3]
The reaction in the anode during charging and discharging is therefore,
xLi+ + xe- Charging [2.4]
xLi+ + xe ischarging [2.5]
The operating voltage has an upper bound due the limited stability of the electrolyte during charging. Also, the applying voltage cannot be too low because there is always a chance of metallic Li precipitation on the surface of a graphite anode, which likely leads to dendrite formation. Thus, it must be maintained above a certain voltage level to avoid a cell failure. In addition, since electrons must not trespass through the electrolyte, the lowest-unoccupied-molecular-orbital (LUMO) of the electrolyte should be aligned higher than the Fermi level of a cathode. In similar, the highest-occupied-molecular-orbital (HOMO) must be located lower than the Fermi level of an anode.6
2.1.2.
Capacities
A capacity is the conventional nomenclature in Li-ion battery industries to define the amount of charge that can be stored in the electrode. In general, the normalized capacity with respect to molecular weight (gravimetric capacity) or volume (volumetric capacity) of the electrode is used to define its performance. The gravimetric and volumetric capacities can be calculated by following equa-tions.
x 1000
Gravimetric capacity (mAh g-') = -- x [2.6] Mw 3600
x 1000
Volumetric capacity (mAh L-1) = - x [2.7]
VM 3600
The product of the normalized capacity and voltage is defined as an energy den-sity (Wh kg-1 or Wh L-1)
In the equations, x is the number of moles of the charge carrier per formula unit participating in the reversible electrochemical reaction, and M, and VM stand for molecular weight and volume of the electrode material, respectively. In other words, x specifically indicates how many Li+ ions (or electrons) can be ex-tracted from the electrode composition without provoking structural instability within the given voltage window. Actually, the maximum of x is preset by the chemical formula of electrode materials simply because it is determined by how many Li+ ions can be present per formula unit.
2.1.3.
Cyclability
Cyclability can be denoted by the percentage of a capacity change during operation per total cycle numbers, and therefore it is the indicator of the lifespan of batteries. It is affected by various factors such as parasitic electrolyte oxida-tion, surface-electrolyte interface layer formaoxida-tion, and the integrity of electrode materials. It often serves as a qualitative measure of stability of the electrode since it tends to influence primarily on the cyclability.
2.1.4.
Rate capability
Rate capability is another convention terminology in Li-ion battery research to quantify how fast a battery can be fully charged and discharged. Therefore, the rate capability of an electrochemical cell can qualitatively illustrate a power density, which is energy density per unit time. It is strongly related to the cell impedance generated by Li diffusion in the electrode, charge transfer at the elec-trode surface, electrolyte resistance through the electrolyte. A material with a good rate capability can maintain its slow rate capacity at high rate cycling. The (gravimetric) rate of cycling is defined by Equation 2.8 as
C
Rate (mA g-) = - [2.8]
where C stands for a theoretical value of the gravimetric capacity and n is the time taking to obtain C.
2.1.5.
Safety
The safety of Li-ion batteries depends on oxidation of the electrolyte and gas evolution from the cathode during charging. Given that electrolyte is made of hydrocarbons, it is a highly flammable fuel when it gets seriously oxidized. As-suming the sealing of the battery is perfect, the oxidation occurs due to oxygen evolution from the charged cathode. Also, the cathode may release gases such as
02 and/or
C0
2, which potentially damage the sealing of the battery and lower quality of its packaging. In the worst case, it can cause an explosive reaction be-tween battery components and air. 52.2.
Commercially available Li intercalation
compounds
2.2.1.
Layered oxides
A typical layered structure is in Figure 2-2.9 It consists of the hexagonal framework of close-packed oxygen, which arrays in A-B-C-A-B-C (03) stacking sequence. Due to this structure, Li diffusion in layered oxides can occur in two-dimension parallel to the layered slabs.10 Many of lithium transition metal ox-ides can have such a layered structure, and LiCoO2 is the first commercial Li-ion battery cathode, which is still prevailing in portable electronics.11
Layered oxide
LIMO
2Figure 2-2. Schematic illustration of a layered oxide with 03 stacking.9 Reprinted (adapted) with permission from Masquelier, C.; Croguennec, L., Polyanionic (Phosphates, Silicates, Sulfates) Frameworks as Electrode Materials for Rechargeable Li (or Na) Batteries. Chemical Reviews, 2013, 113, (8), 6552-6591. Copyright 2013 Ameri-can Chemical Society.
However, due to the high cost of Co and the structural instability issue at the charged state (LiiXCoO2, x > 0.5), a vigorous research activity is going on to develop a new chemistry within the layered framework.6 The layered oxides with multiple cations such as LiNio.3 3Mno.33Coo.3302 and LiNio.8Coo.,5Alo.o50 2 are being
studied vastly in that it can possess high energy density and high power density with reduced materials cost.12-16 However, the safety is yet the unsolved issue for the compounds.15-17
Also, as a derivative of the layered oxides, Li-excess layered compounds with typical composition of xLi2MnO3-(1-x)LiNio. 33Mno.33Coo.3302 exhibits
sub-stantial energy density since it involves more than one Li per formula unit.18, 19 However, it suffers from poor rate capability, irreversible loss of the capacity,
and redox voltage fading and thus energy density loss upon cycling due to its phase transformation into spinel structure.20, 21
2.2.2.
Spinel oxides
Another type of cathode materials has a spinel structure in Figure 2-3.9 It possesses a three-dimensional diffusion path, so that it displays fast ionic and electronic conduction suitable for high power cathode applications.9, 22 The repre-sentative compound with the spinel framework is LiMn204.2 2 Since it does not
MnO
6LiO4
Spinel oxide LIMn
2O
4Figure 2-3. Schematic diagram of a representative spinel oxide, LiMn2O4.9 Reprinted
(adapted) with permission from Masquelier, C.; Croguennec, L., Polyanionic (Phosphates, Silicates, Sulfates) Frameworks as Electrode Materials for Rechargeable Li (or Na) Batteries. Chemical Reviews, 2013, 113, (8), 6552-6591. Copyright 2013 Ameri-can Chemical Society.
mance degradation at high temperature resulted from Mn dissolution.23 Merged in the carbonate electrolytes, disproportionation of Mn3+ into Mn2+ and Mn4+ of-ten occur, and Mn2+ tends to end up with its dissolution.24, 25
To deal with such a problem, the composition of LiMn204 was modified by
doping foreign elements such as Al or Ni.2 6, 27 Also the surface of the particles
was coated to minimize the parasitic reaction with the electrolytes. Yet, the low energy density of LiMn204 is the inherent limitation unless the high voltage electrolyte is developed to account for the up to 5 V redox range of Ni substituted LiNio.5Mn1.50 4.2 7
2.2.3.
Phospho-olivines
Concerning the safety issue, lithium iron phosphate, LiFePO4, with olivine structure in Figure 2-4 has aroused lots of interests as a new cathode material due to its thermal and structural stability, which lead to superb safety, as well as low cost and low toxicity of the elements.9, 28
The stability is mainly resulted from the characteristics of polyanionic structure providing strong covalency be-tween oxygen and additional anions of a different kind, phosphorous in this case.6, 28 Such an anion incorporation into the framework lead to a few character-istic features in all polyanionic category of materials. This will be laid out more in detail in the following Subsection 2.3.1.
Triphylite LiFePO
4FeO,
P0 4
Ui -- 4
Figure 2-4. Schematic diagram of a representative phosphor-olivine, LiFePO4.9 Reprinted
(adapted) with permission from Masquelier, C.; Croguennec, L., Polyanionic (Phosphates, Silicates, Sulfates) Frameworks as Electrode Materials for Rechargeable Li (or Na) Batteries. Chemical Reviews, 2013, 113, (8), 6552-6591. Copyright 2013 Ameri-can Chemical Society.
LiFePO4 has a one-dimensional diffusion channel with low electric
conduc-tivity.2 9, 30 However, nanosized LiFePO4 displays remarkably fast Li diffusion
along the channel within the lattice that enables a 200 C rate (7.2 minutes) charging maintaining more than 70% of the theoretical capacity with good reten-tion if its surface is properly treated.31 If mass-produced, however, its low mate-rial density and packaging density become one big huddle to be a large-scale battery for automobiles since in many case the volumetric energy density is
2.3.
Characteristic features of polyanionic
cathode materials
2.3.1.
Stability and safety
Although utilized in the commercial portable electronics, LiCoO2 and its off-spring layered oxide cathodes are not so practical for large-scale Li rechargeable batteries due to the safety concern.8 If overcharged, such materials tend to lose oxygen,6, 32 and the evolved oxygen atom and/or 02 gas will either oxidize electro-lyte or damage cell packaging by increasing internal pressure. Moreover, since the evolution reaction is exothermic, it can eventually burn the electrolyte in run-away fashion, which may lead to a vigorous explosive reaction in the large-scale battery.8
On the other hand, polyanionic cathodes are likely to be more stable than the layered oxides against the oxygen loss during charging provided by the strong covalent bonding between anions., 28, 33-35 The difference in the stability
can be rationalized by their contrast in the electronic structure. Figure 2-5 illus-trates electron energy versus density of state (DOS) of the 3d-transition metal
(Mn+/M(n+1)+) in the octahedral coordination of oxygen ions (02-).32 If the energy
band of 3d-electrons and 2p-electrons overlaps as shown in the figure, the top of the 2p-orbital of 02- can possibly limit the amount of 3d-electrons extractable
and/or 02 gas evolution by removing 02- 2p-electrons instead of 3d-electrons. This energy scheme is found in LixCoO2, whose oxygen can be lost if it is charged
more than 55%.32
In contrast, polyanionic compounds possess the transition metal-oxygen-anion bonds (M-0-X), so that O-X bonds modify the whole energy band scheme of the M-0 bond.6, 32 In Figure 2-5, 3d-electrons of Mn+/M(n+l)+ is free from overlap-ping with the 2p-electrons of 02-, and consequently full charging will not cause any oxygen evolution. For example, the energy diagram of LiCoPO4 does not have any overlap between Co and 0 bands, in opposition to LiCOO2.6 Many of
E E E E
Ti: 4s" ~ Co: 4s" ~ Co: 4s
0 --- ---0.2 eV 2.3 eV. i4+r1 3+ 4,0 eV4 S2:3p C04+C3+ Co 3'*/Co 2 4 02:2p6 o:2p 6 N(s) N(s) N(s) g N(s)
LiC6 LixTiS2 & LI1jTi2IS4 LiCoO2 LixCoPO4
Figure 2-5. Schematic diagrams of the electron energy versus density of states of 3d-band in transition metal (M"*/M("*,) and 2p-band in oxygen (02-) (a) with overlapping and
(b) without overlapping.32 Reprinted (adapted) with permission from Goodenough, J. B.;
Kim, Y., Challenges for Rechargeable Li Batteries. Chemistry of Materials, 2010, 22, (3),
other polyanionic materials also have the similar energy scheme. Therefore, pro-vided by covalent nature of the O-X bond, polyanionic cathodes tend to be
supe-rior in stability against oxygen loss to plain oxides.
2.3.2.
Inductive effect
The electronic structure of M-O bonds can be affected by polarization pre-sent in proximity.6 Hence, in polyanionic structures possessing M-O-X bonds, ad-jacently polarized O-X bonds can modify the character of the M-O bond. The degree of polarization largely depends on the electronegativity difference be-tween elements in bonding.6 As a result, the electronegativity of the anion can play an important role to determine the overall electronic structure of the M-O-X bond in polyanionic cathodes.6 This consequence caused by incorporation of X in-to the M-O bond is entitled as the inductive effect.6
The redox potential of transition metal (Mn+/M(n+l'+) versus lithium (Li/Li+)
is often determined by the electronic structure of the M-O bond, as shown in Figure 2-5. Therefore, the voltage of cathode compounds can be tailored via the inductive effect by selecting anions with various electronegativities. If the elec-tronegativity of X is high, it will pull nearby electrons, so that the covalency of M-O bond will be diminished, which leads to OCV elevation as shown in Figure 2-6(a).36
For instance, the OCVs of the Fe2+/Fe3+ redox couple with various Fe-O-X bonds are displayed in Figure 2-6(c).32 Since sulfur has a greater electronegativi-ty than phosphorous or boron, it is predictable that the OCV of Fe2+/Fe3+ versus Li/Li+ in sulfate compounds has the highest OCV than the phosphate, borate, or silicates. This tunability of redox potential via the inductive effect is a powerful design strategy to develop new cathode materials, especially for polyanionic compounds.
UIu-(a)
vOC J - . a CA /~O JvOC IOW O(b)
N"rCOVsg F" kon U^IsW4 UFO, UOP04a A, A E Li +/Lio . . .. ... (C) Li3Fe2(XO4)3 Fe3*/Fe2+ in X = As Fe3+/Fe2+ in X = P Fe3+/Fe2+ in X = Mo > Fe3+/Fe2+in X = S
Density of States N(E)
Figure 2-6. (a) The energy diagram of M-O bonds, (b) various Fe-O polyhedra with differ-ent coordination numbers, 3
and (c) energy level of Fe2+/Fe 3
redox elements with respect to metallic lithium in the NASICON structure with different M-O-X bonds.32 Reprinted
(adapted) with permission from Gutierrez, A.; Benedek, N. A.; Manthiram, A., Crystal-Chemical Guide for Understanding Redox Energy Variations of M2
+13+ Couples in
Polyan-ion Cathodes for Lithium-Ion Batteries. Chemistry of Materials 2013, Article ASAP. Copy-right 2010 American Chemical Society, and Goodenough, J. B.; Kim, Y., Challenges for Rechargeable Li Batteries. Chemistry of Materials, 2010, 22, (3), 587-603. Copyright
2013, American Chemical Society.
I
W_
LVOPIOI _!J
2.3.3.
Electronic conductivity
Many of polyanionic cathodes are not considered as a good electronic con-ductor. This is because the O-X bond in polyanionic structure can confine the transition metal redox centers.37, 38 In other words, the delocalization of electrons is disturbed by the presence of electronegative element X nearby the transition metals. However, this low electronic conductivity does not necessarily deterio-rate the electrochemical performance in the cathode level. Many studies have demonstrated to circumvent such an issue by coating a conductive phase on the particle surface or minimizing the particle size.31, 37, 39-41
2.3.4.
Gravimetric / volumetric energy density
Compared to simple oxides, one major drawback in polyanionic cathodes is the low gravimetric capacity (charge per unit mass, mAh g-1) due to additional weight of the polyanion group. If only one lithium per formula unit is active, its theoretical capacity hardly exceeds 200 mAh g-1, which can be often readily ob-tained from the layered oxides.'0
, 20, 31 The exceptional case is found in lithium
transition metal borate chemistries (LiMBO3, M: Mn, Fe, and Co), whose theoret-ical capacity is up to 222 mAh g-1, the largest among polyanionic cathodes due to the simplest borate group.7, 42-44 If more than one lithium can be activated, it
may surpass the 200 mAh g-1 milestone, as demonstrated in Li2(Fe,Mn)SiO 4, but it involves serious engineering and optimization.45-4 7
In addition, unlike the layered oxides, polyanionic compounds are not a close-packed structure but a relatively loose framework. Thus, the material den-sity of polyanionic compounds must be inherently lower than that of oxides. In-evitably, the low density affects the volumetric energy density in negative manner. Since the theoretical volumetric energy density is obtained from multi-plying gravimetric energy density by material density, the difference between energy densities of layered oxides and polyanionic compounds becomes even larger due to weight and density disadvantage of the polyanions.
2.3.5.
Packing density / processing cost
As stated in Subsection 2.3.4, due to lack of tightly stacked polyhedral con-figuration, the density of polyanionic materials is intrinsically smaller than that of layered oxides. Moreover, in many cases, the conductivity problem requires nanosized active particles with conductive phase coating.31,
39, 40, 44 Thus, once
packaged, on top of the low volumetric energy density, the overall tap density and battery pack energy density becomes even significantly compromised.
In addition, in order to produce the same amount of energy, the overall manufacturing expense for polyanionic cathodes including material preparation
and handling may cost more than the layered oxides due to the nanosizing and surface coating processes.
2.3.6.
Summary
Polyanionic materials display a clear edge on the safety criterion over the contemporary layered oxides as a cathode. At the same time, additional anion involved causes some disadvantages with regard to the energy densities, elec-tronic conductivity, and processing cost per energy output.
Therefore, to maximize its strength and minimize its weakness, we simply have to pursue the polyanionic compounds with the highest energy density pos-sible. With various possible selections of the polyanion groups, since the induc-tive effect readily offers an opportunity to design the redox voltage of the material, there is still a huge room to develop a new polyanionic compound that can outperform the competitors. In following PART TWO and THREE, such ef-forts devoted during this thesis work are enumerated.