Automation of Warehouse Decision Making
byRoogers Marino
Bachelor of Mechanical Engineering, Wichita State University, 2015 and
Zeyu Wu
Bachelor of Commerce, Accounting, Carleton University, 2011 SUBMITTED TO THE PROGRAM IN SUPPLY CHAIN MANAGEMENT IN PARTIAL FULFILLMENT OF THE REQUIREMENTS FOR THE DEGREE OF
MASTER OF APPLIED SCIENCE IN SUPPLY CHAIN MANAGEMENT AT THE
MASSACHUSETTS INSTITUTE OF TECHNOLOGY June 2021
© 2021 Zeyu Wu & Roogers Marino. All rights reserved.
The authors hereby grant to MIT permission to reproduce and to distribute publicly paper and electronic copies of this capstone document in whole or in part in any medium now known or
hereafter created.
Signature of Author: ___________________________________________________________ Department of Supply Chain Management
May 14, 2021 Signature of Author: ___________________________________________________________ Department of Supply Chain Management
May 14, 2021 Certified by: _________________________________________________________________ David Correll Research Scientist Capstone Advisor Accepted by: ________________________________________________________________ Prof. Yossi Sheffi Director, Center for Transportation and Logistics Elisha Gray II Professor of Engineering Systems Professor, Civil and Environmental Engineering
Automation of Warehouse Decision Making by
Roogers Marino and Zeyu Wu
Submitted to the Program in Supply Chain Management on May 14, 2021 in Partial Fulfillment of the Requirements for the Degree of Master of Applied Science in Supply Chain Management
ABSTRACT
This capstone addresses how an FMCG company should go about automating inbound decision making in one of their warehouses. The capstone focuses only on the inbound side of the distribution center because it was determined that it was an area with big opportunities for improvement. Efficiency inside a warehouse depends greatly on the correct decisions being made. Currently, the decisions being made inside the sponsor’s warehouse are not consistent because they vary between shifts, and it is hard to make the correct decision because there are many variables that must be considered. To address this problem, this research project developed a simulation model that replicates the current inbound state of the warehouse. The model was used to create and compare different scenarios and unloading policies. For example, it was found that the prioritization of trucks that are more time-consuming to process in some cases has an impact on overall drop-lot waiting time. The project shows how the unloading policies affect the average waiting time of trucks. Replicating this process for all the decisions led to determining what are the best policies for what scenarios.
Capstone Advisor: David Correll Title: Research Scientist
ACKNOWLEDGMENTS
We want to thank our advisor, Dr. David Correll for his guidance, time, and support given to us during this research project.
We would also like to thank Toby Gooley and Pamela Siska for patience and reviews during the writing process.
A special thank you to everyone from our sponsor company who were extremely helpful and a joy to work with.
Finally we would like to thank our parents and family for their unbelievable support through this entire journey.
Table of Contents
LIST OF FIGURES ... 6 LIST OF TABLES ... 7 1. INTRODUCTION ... 8 1.1. BACKGROUND ... 8 1.2. MOTIVATION ... 10 1.3. PROBLEM STATEMENT ... 131.4. METHODOLOGY AND RESULT ... 13
2. LITERATURE REVIEW ... 14
2.1. COMPLEXITY OF DECISIONS WITHIN THE WAREHOUSE ... 14
2.2. BENEFITS OF AUTOMATING DECISIONS ... 15
2.3. SIMULATION ... 15 2.4. CONCLUSION ... 19 3. METHODOLOGY ... 19 3.1. INFORMATION COLLECTION ... 20 3.2. DATA ANALYSIS ... 23 3.2.1. DATA EXPLORING ... 24 3.2.2. DATA PREPARATION ... 24 3.2.3. DISTRIBUTION FITTING ... 26
3.4. SCENARIOS ... 32
3.4.1. EXPERIMENTAL DESIGN ... 33
4. RESULTS ... 35
5. DISCUSSION AND RECOMMENDATION ... 38
6. CONCLUSION ... 40
REFERENCE ... 42
LIST OF FIGURES
Figure 1. Daily inbound truck arrival count ... 9
Figure 2. Aggregated count of inbound truck arrival by hour ... 9
Figure 3. FCMG Inbound truck Processing schematic ... 22
Figure 4. Average waiting period and average unloading period per truck ... 23
Figure 5. Relationship between arrival and interarrival times ... 25
Figure 6. Distribution fitter outputs ... 26
Figure 7. Discrete events in truck flow ... 29
Figure 8. Base distribution arrival simulation model ... 30
LIST OF TABLES
Table 1. List of glossaries ... 10
Table 2. The research framework ... 18
Table 3. Distribution expression ... 28
Table 4. Empirically-derived steady state parameters for model ... 29
Table 5. Scenarios ... 34
Table 6. Priority assignment ... 35
Table 7. Experiments’ result ... 36
Table 8. Statistical significance using t-test ... 37
1.
INTRODUCTION
1.1. BACKGROUNDThis section will introduce the background of the company and the research project’s motivation and problem statement. It will also cover a high-level introduction of the methodology, result, and conclusion.
The Fast-Moving Consumer Goods (FMCG) company in this research is recognized as a large competitive consumer packaged goods manufacturer (CPG), with 291.8 billion U.S. dollars market capitalization (Global 2000 - The World’s Largest Public Companies 2020, n.d.). It serves 5 billion consumers in 180 countries with 65 brands in 10 categories. (About FMCG Company and
Our Brands, 2020)
In North America, The FMCG company has six mega fulfillment centers to satisfy the United States customers’ needs. A fulfillment center is a warehouse where products are consolidated into different categories and mixed into different loads for distribution. The FCMG needs to fulfill 80% of their orders in less than 24 hours. The fulfillment center has to adapt its decision-making process due to the constant change in customers decision patterns, seasonal and intra-day demand variability, and a combination of automated and manual operations.
For instance, Figure 1 depicts the total inbound truck arrival per day in a sample two-month period from August 20, 2020 to October 31, 2020 from the warehouse being analyzed. The high volatility of the number of truck arrivals, which range from 88 to 160 with an average of 123, adds another layer of difficulties for the management team to optimize the warehouse efficiency. Figure 2, demonstrates the aggregated count of inbound truck arrival by hour from
the same data set of the warehouse being analyzed, shows that the trucks normally arrive in the daytime and reach the peak around 3:00 pm.
Figure 1. Daily inbound truck arrival count Daily inbound truck arrival count
Figure 2. Aggregated count of inbound truck arrival by hour Aggregated count of inbound truck arrival by hour
Table 1 defines some terminology the company use in the following sections. Table 1. List of glossaries
List of glossaries
1.2. MOTIVATION
The FMCG company processes thousands of trucks daily at the rate of around one truck per minute (The FMCG company slides). The processing of trucks on inbound shipping consists of checking in the trailer, moving the trailer to the drop-lot or unloading dock, unloading the trucks, and placing the Stock Keeping Units (SKU) in the designated location. As for outbound shipping, the SKUs are picked up from their designated location and, based on the order from the client,
Name Description
Drop-lot Parking lot used by trailers that are waiting to get unloaded or loaded Inbound
Coordinator The manager of the inbound side of the warehouse
Live Load A trailer in which the driver stays with the trailer until it has been unloaded
Manual ID Trailers that carry SKUs that are not registered in the system and have to be registered manually
Pilot Inbound and Outbound manager. In charge of making decisions within the warehouse
Short An order that is incomplete and requires some products from a trailer that has not been unloaded yet
are loaded onto the truck. Trucks arrive and leave throughout the day, and time slots are assigned to each truck for processing. The trailers’ processing priorities depend on: the type of shipment, waiting time at the drop-lot, whether it contains the short items for outbound shipment, and the facility schedule. The FMCG company faces many disruptions every year that cannot be controlled. Trucks arriving late, drivers not willing to travel until the next day, and bad weather delaying transportation are a few examples of these disruptions. Any of these disruptions will cause the processing of trucks to fall behind. The disruptions, combined with the complexity of the warehouse, creates a repeating cycle in which, once a truck is delayed, all the other trucks will start falling behind.
Such trucking disruptions have a negative impact on warehouse operations. It is important that warehouses be as efficient as possible. That’s because warehouses today are more essential for businesses than they have ever been. Currently with the growth in e-commerce, faster shipping and globalization, warehouses need to have the capabilities of storing and handling more SKUs, carrying out more and smaller orders, and process more returns. Warehouses must have these capabilities while having less time and less margin for error (Frazelle, 2002). The increase in demands and decrease in flexibility makes the decision making within a warehouse essential to the business.
Since the decisions made for the warehouse are a key factor that affects the overall warehouse performance, it requires a warehouse manager or, as called by the company a “pilot”, (Table 1) and inbound and outbound coordinators (Table 1) to react quickly and make the right decisions in order for the warehouse to keep working smoothly and without delays. For inbound shipments, the pilot and coordinators need to decide what dock should each trailer should be
unloaded at and when to unload each trailer by allocating and utilizing the available resources, such as space, forklifts, and labor. Another constraint is that the trailers should be unloaded within 24 hours to avoid a penalty paid by the company to the trucking company. For example, if there is only one dock available, but two trailers are waiting to be unloaded, the pilot and coordinator need to decide which trailer should be brought in by determining whether it is “short”, which means it contains an item which is needed for an outbound order to be shipped, or whether it will go over the 24-hour limit. In addition, once the trailer is loaded, the pilot and coordinator also need to determine where the pallet should go inside the warehouse based on product features. For example, unscented products, such as diapers, cannot be stored together with scented products, like shampoo.
Currently, most of the critical warehouse decisions are made by people. These decisions include: when and where to move trailers to the doors, how to allocate and pick shipments to meet customer needs, when to re-prioritize tasks, etc. Even though human decision-making is being used and has kept the distribution centers working, it does not necessarily mean that it is the best approach. Based on the interview with the warehouse pilot, it shows some of the pilot decisions are made inconsistently, on a person-to-person based on their judgement or personal situation that day. So human decision may lack consistency and is not optimized, and therefor slows down the process. The company wants to eliminate the human decision making from the warehouse operation, especially on decisions for allocating the resources for inbound and outbound shipments. The objective is to improve warehouse operating efficiency and reduce the order processing time along with managing disruptions in a better way and having a consistent performance throughout all their facilities.
1.3. PROBLEM STATEMENT
This project aims to develop and evaluate a daily warehouse decision-making strategy by learning the warehouse operation, understanding the inputs, and comparing the strategy performance with the current strategy of having humans make the decisions. The most important success criteria is how fast a trailer could be moved to the dock door and be processed, including unloading, documentation, etc., after the trailer enters the company’s site. In this case, the quality of strategy could be evaluated by the processing time for each step, such as drop-lot waiting time, and the overall trailer dwell time from truck check-in to check-out.
1.4. METHODOLOGY AND RESULT
To conduct the research, we held multiple interviews, totaling more than 10 hours, were held with the company’s warehouse managers. The interviews were made with people from different departments in order to understand the operation flow, the current critical decision-making policy and criteria, the prioritizing rules, and other limitation and constraints in the fulfillment center. After studying how dynamic the warehouse decision-making is, the research scope was refined and narrowed down to focus on inbound shipments only. Meanwhile, a data set of truck arrival and processing time was acquired from the company. In accordance with the findings of our literature review, a discrete event simulation model was selected and built based on the process map to test different possible decision-making scenarios by changing the variables. The scenarios were designed with the objective of testing different unloading policies in order to find the best one.
Efficiency inside a warehouse depends greatly on the correct decisions being made. The decisions being made at the FCMG are not consistent and might not be the correct ones. In order to find a solution to this problem a simulation model was built that will help determine the best unloading policy for the FCMG.
2.
LITERATURE REVIEW
2.1. COMPLEXITY OF DECISIONS WITHIN THE WAREHOUSE
The activities that are performed in most warehouses are the following: Receiving/unloading, put-away, storing, order picking, pre staging and shipping. (Frazelle, 2002) As pointed out by Buil & Piera (2008) not all warehouses are the same, and we need to understand the interactions between each activity of the warehouse along with its constraints. The space limits inside the warehouse along with the truck arrival uncertainty, different types of picking, and implementation of automation down time of machinery are just a few of the constraints that warehouse managers face while making a decision. In addition, the dock location and the destination, which includes the storage shelves and picking area lane, will bring another layer of difficulty for warehouse decision making. According to Gopakumar et al. (2008), the dock allocation plays a key role in reducing the put away travel time in the warehouse inbound process. All the different areas inside the warehouse plus the constraints make the automation of decision-making a very complex problem overall.
The complexities and differences between every warehouse create a challenge in using a model that has already been built. A new model that takes into account the research
phenomenon of interest has to be built. In this case we contributed to the existing literature by studying the prioritizing the inbound trucks.
2.2. BENEFITS OF AUTOMATING DECISIONS
Dekker (2014) stated that human error depends on perspective; what some might consider an error other might consider normal behavior. Decision-making cannot be consistent while having different managers making decisions and different warehouse layouts. Eliminating human error from the decision-making process would ensure that the flows inside the warehouse will always be optimal and that the warehouse is always performing at or close to its maximum potential.
Due to the high variability of perspective between pilots and coordinators from different shifts the decisions being made currently vary a lot and are not consistent. The company’s goal is to have a policy that any pilots and coordinators have to follow in order to keep a consistent process.
2.3. SIMULATION
According to Law (2007) experimenting with the actual system should be done if possible and cost effective. Altering the conditions physically would give a valid result. However, altering a physical system can be very expensive and that is why simulation is used. For this research project altering policies could lead to profit losses and testing different scenarios would be impossible because weather and disruptions cannot be forced. A simulation model was done in order to avoid this problem.
Gopakumar et al. (2008) developed a discrete event simulation (DES) model to study the impact of dock allocation algorithms, which was designed to reduce the dock turnaround time with predefined storage aisle location, product mix and volume, and test several ‘what-if’ scenarios of dock allocations based on aisle, distance traveled and schedule. This article includes a similar consideration of trucks arriving late, one of the FMCG company’s current problems. A discrete event simulation models the operation of a system as a discrete sequence of events with randomness. It means the simulation time can jump directly to the next event without any changes in the system. (Stewart Robinson, 2004) a truck arrival system exhibits behavior with randomness of interarrival truck times. Thus, a discrete-event simulation should be an appropriate method to implement.
Modeling is a combination of art and science with huge complexity. According to Altiok & Melamed (2007), to build a model with a high-level consideration, the following eight steps need to be done: problem analysis, information collection, data collection, model construction, model verification, model validation designing and conducting simulation experiments, output analysis, and final recommendations see detail description in Table 2.
To build a discrete event simulation model, interarrival times, which is the time difference between truck arrivals at the facility are used rather than arrival times. Once a truck arrives, the time of the next truck arrival will be calculated by random sampling from the interarrival time distribution (Fishman & Kiviat, 1968).
For creating scenarios, Correll et al. (2014) designed a simulation experiment method to test different combinations of categories of situations. This method could be applied to The FMCG company by segmenting the demand and resources to test different decision-making
policies under different condition, such as a cluster arrival because snow storm delays all inbound trailers, with the goal of minimizing the waiting times and residence times.
Table 2. The research framework
The research framework. Adapted from Altiok & Melamed, 2007
Steps Descriptions
Problem analysis and
information collection This step is to understand and analyzing the problem itself. In this step, structural information that bears on the problem will be gathered and represented.
Data collection This step is for gathering and estimating the model input parameters. And data collection is also needed for model validation to compare the model counterparts.
Model construction Once the problem is fully studied and the data collected, the model could be constructed under different simulation language or environment. (eg. Arena)
Model verification Model verification is to make sure the model is correctly constructed by inspection and comparing model specification.
Model validation Model validation examines the fit of the model to empirical data. A good model fit means that a set of important performance measure, predicted by the model matches with the real-life observation. Model modifications are called for if there is any discrepancy between the predicted result and the real-life statistic.
Designing and conducting simulation experiments
Number of scenarios would be selected and ran by the model in this step. To attain sufficient statistical reliability of scenario-related performance measures, each scenario is replicated and results averaged to reduce statistical variability.
Output analysis The estimated performance measures are subjected to a thorough logical and statistical analysis. A statistical analysis would run statistical inference tests to determine whether one of the alternative designs enjoys superior performance measures, and so should be selected as the apparent best design.
Final recommendation Finally, the recommendations for the underlying systems problem could be formulated based on the output analysis.
2.4. CONCLUSION
After reviewing the literature about possible ways to simulate warehouse decisions, we determined that the FMCG company should not use the simulation models from other companies, since the FMCG company has a highly complex supply chain. This complexity includes but is not limited to a considerable number of SKUs in different categories, a significant volume of trucks that need to be loaded, the size of its mega warehouse, and the large number of employees involved in the loading and unloading process. Given this complexity, the FMCG company should develop a new model to fulfill its different needs.
3.
METHODOLOGY
The company faces a massive decision-making process in the warehouse because it has a large amount of inbound and outbound shipments. The warehouse decision-maker needs to consider the needs for the outbound shipments while allocating the inbound shipments. This research aims to build an automated warehouse decision-making model that will tell warehouse managers what unloading policy to use and when. The simulation will test different scenarios by modifying certain parameters of the baseline model in order to find out what is the best policy is for every scenario.
To study the impact of different decision policies to the efficiency of the inbound truck process, the simulation model needs to be built. As suggested by Altiok & Melamed (2007), the following steps were done. Information collection, see Section 3.1 is done by conducting a conversation with the warehouse managers to better understand the problems and processes.
Once data was received from the company, data analysis, see Section 0, induces the examination of the cleaned data and the distribution fitting regarding arrival time and time interval between each important process node. Next, the simulation would be built and validated based on the information collected during interview and data analysis, see Section 3.3. Once the base model is completed, different simulation experiment will be designed and tested in Section 3.4
3.1. INFORMATION COLLECTION
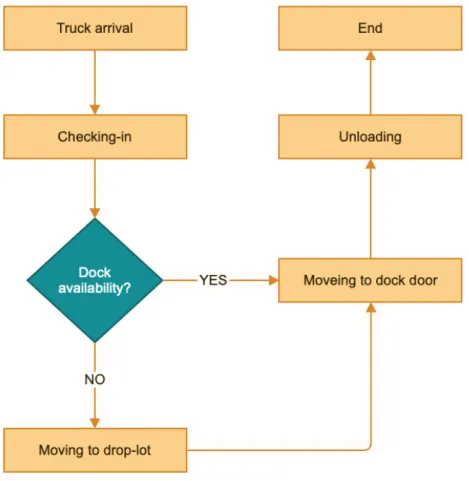
To better understand the process of truck in the FMCG company’s fulfillment center, several interviews, over 10 hours, were held with different departments. During the interviews with the pilot and warehouse coordinators, detailed decision-making processes, trailers’ flow, and the logic behind it were demonstrated. There are several decisions prior to the unloading process start. For example, the pilot needs to decide which truck should move when there is an available dock, and to which dock should a truck move when there are multiple available docks. And the rules for assigning which truck to which dock door depends on the dock door availability and the distance between the occupied docks. Because the pilot wants to reduce the traffic conjunction in each area and provide more available staging lanes, also operating rooms for each unloading job. While the process of truck flow is described in Figure 3. When the trucks enter the site, a check-in time will be logged. Then the pilot or warehouse coordinator needs to check and consider whether this is a prioritized shipment, such as whether it is live-load and whether it contains any ‘short’ or cross-dock items. If there is a dock available, the pilot will assign the truck to any dock door for unloading. If not, the truck will be directed to the drop-lot and will wait for the next available door. The trucks in drop-lot will form a waiting queue. All live-loads and
shipments that contain a ‘short’ would be prioritized when assigning the available dock door. For non-prioritized shipments, the pilot will move them base on the first in first out (FIFO) policy. Once the trailer is moved to the dock for unloading, the pilot will assign special counter-balance forklift, as well as forklift driver to unload it. Another difficult decision the pilot must make is how many workers and forklifts need to be allocated to each job. Different products will be moved to different areas, for example, ‘short’ or cross-dock items will be moved directly to the packing or outbound staging lanes, others will be move to the limited inbound staging lanes or directly to the warehouse storage area.
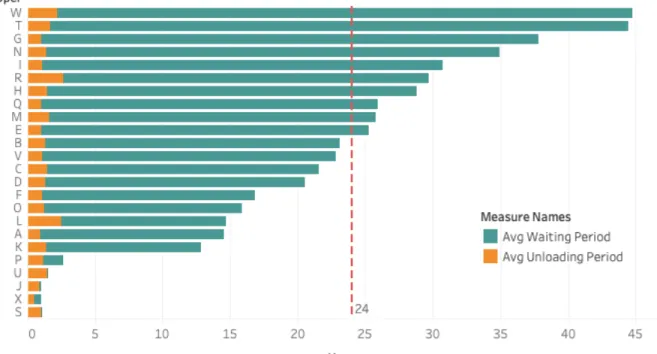
During the initial analysis of the process flow, the waiting period in the drop-lot and unloading time together formed the overall trailer waiting time for unloading. As Figure 4 describes, the trailers spend most of the time waiting for an available dock door. This indicates once the unloading starts, it will be very fast to finish the job. The unloading time of trailers is consistent most of the time and has a few outliers. On the other hand the waiting time of trailers at the drop-lot has a huge range and many trailers go over the 24-hour waiting period in which the company has to pay a penalty fee for having the trailer waiting at the drop-lot.
Figure 3. FCMG Inbound truck Processing schematic FCMG Inbound truck Processing schematic
3.2. DATA ANALYSIS
The data received from the sponsor company was very broad and had KPIs and information for the entire distribution center. It was determined that the data could not be analyzed as a whole but instead had to be separated into inbound, storing, picking, and outbound. Graphing all these categories along with the components of each showed the different performance distributions for each component. A set of data with check-in time, loading start time and loading finished time was provided by the company. There was only approximately 70 days of data with 9,000 entrees because the fulfillment center is under automation transition, so the historical data is not very relevant to current and future situation. To discover detailed information about the data the following steps were done, data exploring (Section 3.2.1), data preparation (Section 3.2.2), and distribution fitting (Section 3.2.3).
Figure 4. Average waiting period and average unloading period per truck Average waiting period and average unloading period per truck
3.2.1. DATA EXPLORING
The data set includes the following items.
• Truck Number: A unique identification number for each shipment.
• Truck Reference: Contains the shipper’s name. It is used to identify which warehouse or manufacturer the shipment came from and filter out the manual ID shipment, which need special care and require more time to do the documentation during unloading (Table 1), further to differentiate the unloading time.
• Timestamps: The data contains some important dates and times, which is timestamps, including the expected arrival time, actual arrival time which is also named check-in time, trailer moved to door time, trailer unload start time and trailer unload end time.
• Characteristics: The two important characters will be included in the data set and
flagged by Boolean variable. They are the Live load (Table 1) and Engaging process which means that contains short or cross-dock items (Table 1).
3.2.2. DATA PREPARATION
Datatype conversion and simple calculations need to be done to extract the required data before the analysis distribution fitting. All the important dates and times need to be converted to timestamps in order to perform further calculations.
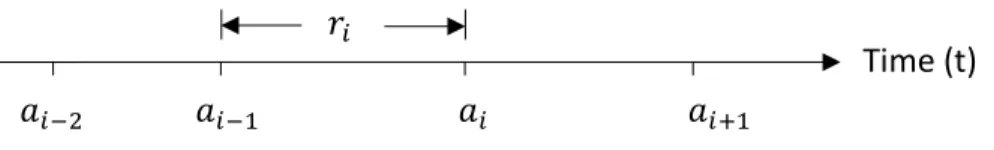
There are 3 sets of new data that need to be calculated and fitted to a distribution in order for the model to random sample the data. First is the interarrival time, which is the time difference between truck arrivals at the facility. Interarrival time !! is defined as shown in Figure
5 and calculated using the following equation for interarrival time between truck " − 1 and "
where %! is arrival time of the "th arrival (Leemis & Park, 2004). !! = %! − %!#$ , " = 1, 2, 3, …
So the interarrival time could be calculated by sorting the data by the Check-in Date in ascending order and applying the interarrival time formula.
The next step is to find out the loading time by calculating the time interval of trailer unload start time and trailer unload end time. The loading time needs to be separated into 2 categories for normal shipment and manual ID shipment. The manual ID shipments could be identified based on the manual ID truck reference from the data set before fitting the distribution.
Time (t) %!#% %!#$ %! %!&$
!!
Figure 5. Relationship between arrival and interarrival times Relationship between arrival and interarrival times
3.2.3. DISTRIBUTION FITTING
This step formulates assumptions on the distribution of random variables in the model. This simulation model requires four distributions as parameters: interarrival time of trailer, interarrival time of labor, normal shipment unloading period, and manual ID shipment unloading period. Both interarrival time for trailer and labor will be used to generate the stochastic variables to simulate the arrival frequency of the trailer and the unloading labor. While the unloading period will be used to simulate the stochastic unloading time needed for normal shipments and the manual ID shipments.
Interarrival time of Truck
Fr eq ue nc y Time interval
Normal shipment unloading period
Fr eq ue nc y Time interval
Manual ID shipment unloading period
Fr eq ue nc y Time interval Interarrival time for labor
Fr eq ue nc y Time interval Figure 6. Distribution fitter outputs
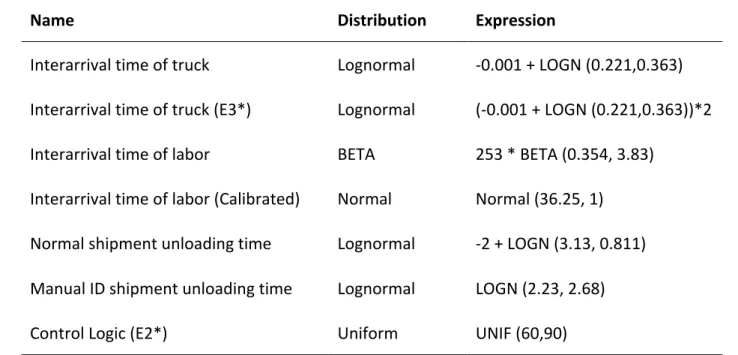
To find the most suited distribution for each parameter, the best five distributions were graphed against the data (Figure 6). Fitter uses 80 distributions (Appendix A) from Scipy and automatically plotted the most probable distribution (Cokelaer, 2021). After discussing with the company, no outliers should be excluded in this distribution fitting because this data only contain 60 days record and there is no unusual data in the record. To test how well the distribution fitted the data, the squared error was calculated to find out which is the best distribution with the highest accuracy. The expressions in Table 3 of interarrival time, interarrival time of labor, normal shipment unloading time and manual ID shipment unloading times are generated by ARENA Input Analyzer based on the real data. They were chosen based on the least square error. The interarrival time of trucks, interarrival time of labor, and control logic are created and modified based on the scenario.
The decision of warehouse operation includes the inbound, outbound, and warehouse operations with shared resources. Even though this research is narrowed down to the inbound operation only, it will still be affected by the decisions from other operations. Forklifts are shared throughout the warehouse because there is a limited number of resources. This will heavily affect the result. In this research, there is no sufficient data to identify the impact from downstream operations. So, the calibrated labor arrival distribution needs to be found to simulate the reality. In addition, a control logic interarrival time is also determined for scenario E2 to simulate the delayed lumpy arrival scenario caused by disasters, such as storms. More details about the scenario will be covered in Section 3.4.
Table 3. Distribution expression Distribution expression
The simulation model also needs some other parameters to control the flow and situation, also identify the shipments’ features. In this case, the percentage of live load, ‘short’, and manual ID shipments are calculated to assign different attributes to identify different future process. The parameters used in the simulation model are listed in Table 3. In addition, the available resources for unloading are 27 loading docks and 8 counter balance forklifts and drivers. Since the downstream process won’t be described here, the forklift and labor will be considered as one resource.
Name Distribution Expression
Interarrival time of truck Lognormal -0.001 + LOGN (0.221,0.363)
Interarrival time of truck (E3*) Lognormal (-0.001 + LOGN (0.221,0.363))*2
Interarrival time of labor BETA 253 * BETA (0.354, 3.83)
Interarrival time of labor (Calibrated) Normal Normal (36.25, 1)
Normal shipment unloading time Lognormal -2 + LOGN (3.13, 0.811)
Manual ID shipment unloading time Lognormal LOGN (2.23, 2.68)
Control Logic (E2*) Uniform UNIF (60,90)
*E2 simulate the delayed lumpy arrival scenario *E3 simulates the trucks arrive in quarterly push
3.3. DISCRETE EVENT SIMULATION MODEL
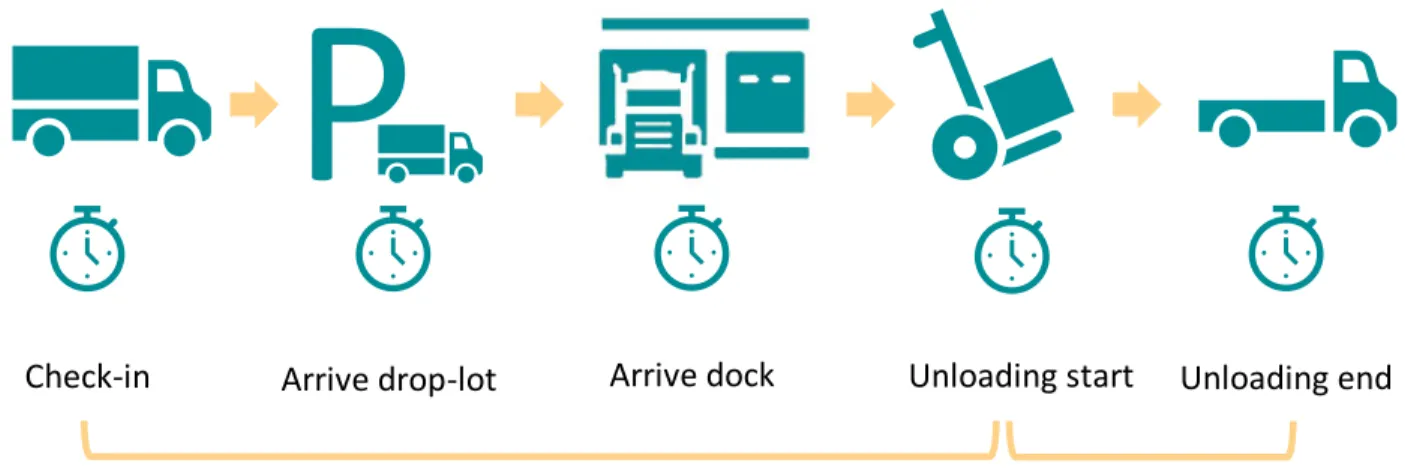
A base discrete event simulation model was created to mimic the truck and decision flow inside the company’s site and measure the time interval for evaluation. The operations in a discrete event simulation model happen in a discrete sequency. So, the movement of truck is created based on the discrete sequency shown in Figure 7.
Parameters Input
Manual ID Shipment 4.1751%
Live Load 0.0370%
Short 76.5319%
Table 4. Empirically-derived steady state parameters for model Empirically-derived steady state parameters for model
P
Check-in Unloading start Unloading end
Figure 7. Discrete events in truck flow Discrete events in truck flow
Hold for dock assignment Unloading period
Arrive dock Arrive drop-lot
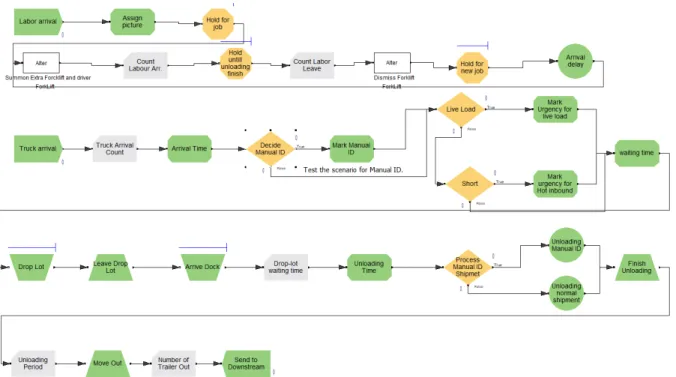
Figure 8 shows the discrete simulation model for the base scenario. This model starts with the first discrete event, which is the truck arrival followed by the distribution of interarrival time of truck as seen Table 3. When the truck arrives, an arrival time is assigned to future recording of how long it takes the truck to move from gate to dock doors, which is drop-lot waiting period. Then the manual ID shipment is identified by the percentage of the manual ID shipment among the overall shipments followed by the identification of live load and ‘short’. The urgent level will be assigned here according to the different scenarios. Then all trucks will move towards to the drop-lot. A waiting queue will be created here and the queue order will be determined based on the priority assigned previously. Trucks with same priorities are all on first in first out (FIFO) order. Each truck needs to seize one dock door before moving to the next step. Once there is an available resource, the truck with the highest priority and the earliest check-in time will seize it first and move to dock door. Once the truck arrives to the dock door, it seizes a forklift with labor
Figure 8. Base distribution arrival simulation model Base distribution arrival simulation model
to unload the truck. While trucks are waiting for labor, a waiting queue is created and the priority is based on FIFO order. When the truck starts unloading, the unloading time is based on the type of shipment. Manual ID shipments take longer time than normal shipments. The distributions of unloading time for both type of shipments is defined in Table 3.
A parallel loop model is created to simulate the labor and forklift arrival. The distribution for interarrival time of labor (See Table 3) is calibrated when validating the simulation model and it needs to catch the allocation of resources in the entire warehouse, part of which are not included in this model. Based on consultation with the FMCG partner company the maximum labor resources is 8 and realized by limiting the maximum labor and forklift arrival. The initial labor resource setting is 0. The labor resource is incremented by 1 when the unloading waiting queue is greater than 0 and decrease by one when the unloading waiting queue drop to 0. Once the labor leaves the resource pool, it takes another interarrival time determined for the labor arrival.
To simulate the lumpy arrival scenarios, described in Section 3.4, a logic control model is built to control the lumpy arrival (See Appendix B). The lumpy event arrives following a Uniform interarrival distribution between 60 to 90 days to simulate one bad weather per season. When the bad weather event start, it will hold the truck arrival for 3 days and there won’t be any truck arrive the company site for 3 days. The truck arrival will resume on the fourth day. At the same time, the trucks affected by the event will also arrive the site following the same interarrival time distribution of truck.
To simulate the quarterly push arrival scenarios (Section 3.4), two quarterly pushes were included in the model (see Appendix C). The frequently is 1.5 times comparing to the base model.
The manual ID shipments will go directly to the dock door or wait in the drop-lop if the dock door is occupied. Since the policy requires holding one dock door and one labor for the assignment, one unit of resources for unloading need to be deducted from the resource pool. Then there will be 26 dock doors and 7 labors unloading the normal shipments.
3.4. SCENARIOS
A simulation model using Arena Software was built using 3 ways to make the manual ID decision process for the inbound side of the warehouse. Once the model was complete it was shown to the company stakeholders in order for them to verify that the design and flow align with the current process at the company. From there the following scenarios were tested using the Arena model.
• Trailers are delayed due to a weather disruption and arrive at the same time. • Different unloading and prioritizing policies
Running multiple scenarios will help analyze the different results and find a solution for the problem that fits most scenarios or all of them. Arena is a professional simulation software designed for the supply chain industry. In addition, Arena may have limitations for continuous event simulation. It is crucial to find out whether the warehouse decision-making is a continuous event or a discrete event. Discrete event simulation is process oriented and has a focal point on the sequence of operations performed by entities. Variables can be changed at will to run multiple scenarios and analyze how the result changes (Borshchev, 2014). During continuous simulation the variables change continuously and drastically from point to point.
3.4.1. EXPERIMENTAL DESIGN
A 3x4 experiment using three scenarios and three unloading policies was designed. The scenarios and policies are the following:
Scenario (E1) Base Distribution
The first scenario is the baseline model which replicates the current state of the warehouse. The arrival distribution was fitted using the truck arrival data obtained from the company. In this scenario trucks arrive at the company with an even distribution with no disruptions and no major delays or spikes on arrival.
Scenario (E2) Weather Event
The second scenario’s arrival distribution changed to a lumpy schedule. A lumpy schedule means that the trailer arrival will not be consistent and instead will vary. This variation uses a three days delay caused by a weather disruption in which the arrival of trucks decreases for three days and increases for three days. This scenario shows how well each policy reacts to busier and slower arrival of trucks.
Scenario (E3) Quarterly Push
In the third scenario, the number of trucks will increase at the end of each quarter to represent the actual increase in arrival during certain days. The model increases the arrival of trucks by 1.5 between days 76 and 90 and increases it again between days 166 and 180. This scenario shows what policy performs better on days where the truck arrivals increase or when the warehouse is behind schedule.
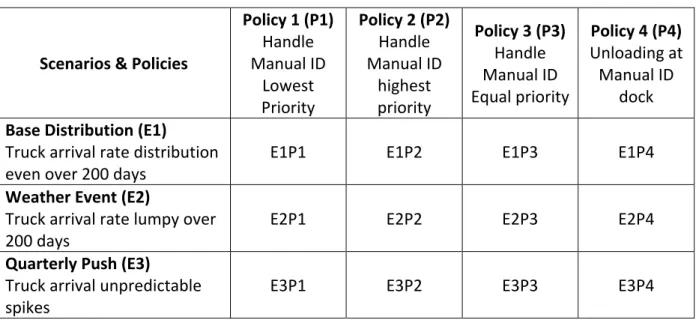
The three scenarios will test four different unloading policies for manual ID trucks. The first policy (P1) will give manual ID trucks a low priority, meaning they will only be unloaded if no
other trailer is waiting at the drop-lot. The second unloading policy (P2) will give the highest priority to manual ID trucks. In this approach the manual ID trucks will jump ahead of any other trucks that are waiting in the drop-lot and will be unloaded first. The final unloading policy (P3) unloads the trucks in a first in, first out (FIFO) approach in which no truck will receive any priority for faster unloading. P4 limits manual ID trucks to only one dock door as according to the company usually only one worker is assigned manual ID trucks.
Table 5. Scenarios Scenarios
According to the interview with warehouse managers, live loads are always necessarily the most urgent inbound loads, and that ‘short’ loads were the second most urgent. However, it was learned that there are different ways to consider ‘manual ID’ loads. By manipulating priority assignments, experimentation with different polities for prioritizing manual ID loads could be made. The ranking rule for waiting queue in the model is based on the highest attribute
Scenarios & Policies
Policy 1 (P1) Handle Manual ID Lowest Priority Policy 2 (P2) Handle Manual ID highest priority Policy 3 (P3) Handle Manual ID Equal priority Policy 4 (P4) Unloading at Manual ID dock Base Distribution (E1)
Truck arrival rate distribution
even over 200 days E1P1 E1P2 E1P3 E1P4
Weather Event (E2)
Truck arrival rate lumpy over
200 days E2P1 E2P2 E2P3 E2P4
Quarterly Push (E3)
Truck arrival unpredictable
value. So the three policies could be adjusted by altering the attribute value, which is defined in the Table 6.
Table 6. Priority assignment Priority assignment
Priority Assignment for Policies 1-4
Shipment type Policy 1 Policy 2 Policy 3 Policy 4
Live load 4 4 4 4
Short 3 3 3 3
Normal shipment 1 1 1 1
Manual ID
shipment 0 5 1 1
Policy 4 requires modified models to simulate designated dock for the Manual ID shipments. The models are shown in Appendix D, Appendix E, and Appendix F.
4.
RESULTS
After building and validating the simulation base model (representing current the scenario), the following different scenarios were tested in order to compare the results and find out what unloading policy is the best overall for the company. The baseline scenario waiting time at the drop-lot was similar to the one obtained from the data. The other scenarios were built by modifying certain parameters and policies from the baseline model as seen on Table 7.
Table 7. Experiments’ result Experiments’ result
Base Distribution Arrival (E1)
Scenario E1P1 E1P2 E1P3 E1P4
Number of trucks in 21812 21785 21794 21848
Number of trucks out 21723 21735 21075.13 21735
Avg. drop-lot waiting time 21.4972 21.8474 21.5768 20.4643
Avg. unloading time 1.1859 1.1858 1.185 1.1859
Avg. total time 22.6831 22.7618 22.7618 21.6502
Utilization of dock 25.7047 25.7532 25.7468 25.2258
Utilization of labor 5.3682 5.36 5.3502 5.3712
Weather Event (E2)
Scenario E2P1 E2P2 E2P3 E2P4
Number of trucks in 21819 21794 21830 21822
Number of trucks out 21722 21699 21731 21727
Avg. drop-lot waiting time 25.479 25.9335 25.6449 25.0125
Avg. unloading time 1.1855 1.1854 1.1864 1.1855
Avg. total time 26.6645 27.1209 26.8313 26.198
Utilization of dock 24.951 24.9501 24.9562 24.4776
Utilization of labor 5.9197 5.3596 5.3725 5.3671
With the results obtained from all the different scenarios and policies a t-test was performed to find if the results from different policies were statistically significant. Table 8 shows the results show all the p-values for each scenario and policy comparison.
Scenario E3P1 E3P2 E3P3 E3P4
Number of trucks in 25734 25750 25769 25772
Number of trucks out 23954 25438 25497 25310
Avg. drop-lot waiting time 26.4204 27.0881 26.4547 31.9248
Avg. unloading time 1.1851 1.1857 1.1848 1.1861
Avg. total time 27.6055 28.2738 27.6423 33.1109
Utilization of dock 26.2288 25.2219 26.2165 25.8102
Utilization of labor 6.2911 6.2967 6.2955 6.2556
*Values with a statistical significance using a 95% confidence interval
Table 8. Statistical significance using t-test Statistical significance using t-test
5.
DISCUSSION AND RECOMMENDATION
The decisions being made in warehouses everyday determine how successful a facility can be. The complexity behind every decision involves keeping track of all the different decision factors and how quickly decisions need to me made. In order to automate a decision being made in the warehouse three different unloading policies were tested in different scenarios. The results were compared and a statistical test was conducted to find if there was statistical significance between the different policy results.
After the analysis of the performance of each policy in each scenario a t-test had to be done in order to determine if the results were actually different from each other. As seen in Table 8 the t-test indicated that in some cases the policies performed equally with a 95% confidence interval. In the first two scenarios policy P4 is the best one, followed by policy P1. Unloading Manual ID trucks at the end results in the lowest average waiting time for trucks. In the third scenario policy P4 should be avoided because it results in a higher average waiting time than all of the other three policies.
The current unloading policy varied by scenarios. Once all the “shorts” and live-loads were processed the manual ID trucks were unloaded based on the pilot’s decision. Some pilots preferred unloading manual IDs first because it is a long task, while others pushed it to the end. The results obtained using the simulation model show that the best policy for scenarios 1 and 2 is P4 and for the third scenario P1 is the best policy for unloading. Figure 9 shows the different waiting times when using each policy. It also shows how the waiting time is reduced when policy P1 is being used.
Table 9. Policy ranking Policy ranking
Figure 9. Experiments' average waiting and unloading time Experiments' average waiting and unloading time
Table 9. ranks the policies by scenario, indicating which policy should be used for which scenario. In some cases some policies were ranked equally because even though the average waiting time was slightly different, the t-test indicated that there is not enough evidence to confirm that the difference is statistically significant. The table also shows how a policy can go from being the best one in the first two scenarios to being the worst one in the last scenario.
6.
CONCLUSION
Warehouse decision making is one of the main efficiency drivers for warehouses. The decisions being made inside the warehouse are very complex due to all the information that has to be considered to make the decision and the short amount of time in which a decision has to be made. The goal for this project was to automate some of the complex decisions inside the warehouse. The literature for automating decisions stated that it was a very complex problem that had to be solved differently for every warehouse and a good approach to reaching a solution was simulation.
The current simulation model was built using data from the company; however there were some distributions that were not fitted but instead were calibrated. The calibrated distributions were done to replicate the factors from outbound shipping that affect inbound workforce availability and space availability. Our recommendation is that a complete model should be built that combines the model from this research project with the rest of the warehouse. By building a complete model the company will be able to have a better understanding of how the decision in one area affects the rest of the warehouse. The model would be the first step to optimizing all the decisions for the warehouse.
The simulation model was built in Arena and used the information Pilots use to make a decision. Using the data provided by the company the truck arrival, labor availability and dock door availability distributions were fitted in order to make a baseline model that resembled reality. The baseline model was then used to create to different scenarios that affected the truck arrival distribution. The three scenarios were used to compare three different unloading policies. After comparing the results an interesting find was that there was no one best policy overall, instead policy P4 was the best for two scenarios and policy P1 was the best for one scenario.
Our recommendation to the company is to review the truck arrival schedule for a period of time to determine what kind of arrival they are expecting and to use the best policy for that case. Using the best unloading policy will lead to a lower average waiting time for trucks at the drop-lot making the truck processing more efficient. After delivering the results to the company it was determined that the result was viable and would be tested in the near future.
REFERENCE
About FMCG company and Our Brands. (2020). http://www.pgcareers.com/about-us
Buil, R., & Piera, M. A. (2008). Warehouse redesign to satisfy tight supply chain management
constraints. 5(3), 6.
Correll, D., Suzuki, Y., & Martens, B. J. (2014). Logistical supply chain design for bioeconomy
applications. Biomass and Bioenergy, 66, 60–69.
https://doi.org/10.1016/j.biombioe.2014.03.036
Dekker, S. (2014). The Field Guide to Understanding “Human Error.” Ashgate Publishing, Ltd.
FMCG Company Slides. (2020).
Frazelle, E. H. (2002). Supply Chain Strategy. McGraw-Hill Professional Publishing. http://public.ebookcentral.proquest.com/choice/publicfullrecord.aspx?p=4654936 Gass, S. I., & Fu, M. C. (Eds.). (2013). Encyclopedia of Operations Research and Management
Science. Springer US. https://doi.org/10.1007/978-1-4419-1153-7
Global 2000—The World’s Largest Public Companies 2020. (n.d.). Retrieved October 15, 2020,
from https://www.forbes.com/global2000/#774ba320335d
Gopakumar, B., Sundaram, S., Wang, S., Koli, S., & Srihari, K. (2008). A simulation based approach for dock allocation in a food distribution center. 2008 Winter Simulation Conference, 2750–2755. https://doi.org/10.1109/WSC.2008.4736393
Karmaker, C. L., & Saha, M. (2015). Optimization of warehouse location through fuzzy multi-criteria decision making methods. Decision Science Letters, 315–334.
https://doi.org/10.5267/j.dsl.2015.4.005
Robinson. (2005). Discrete-event simulation: From the pioneers to the present, what next?
Journal of the Operational Research Society, 56(6), 619–629. https://doi.org/10.1057/palgrave.jors.2601864
Robinson, Stewart. (2004). Simulation – The practice of model development and use. Wiley. Undefined Behavior. (2017, September 27). P vs. NP - An Introduction [Video].
APPENDIX
Appendix A.
Scipy distribution list
Scipy distribution list
alpha foldcauchy invgamma powerlaw
anglit foldnorm invnorm powerlognorm
arcsine frechet_l invweibull powernorm
beta frechet_r johnsonsb rayleigh
betaprime gamma johnsonsu rdist
bradford gausshyper ksone recipinvgauss
burr genexpon kstwobign reciprocal
cauchy genextreme laplace rice
chi gengamma loggamma semicircular
chi2 genhalflogistic logistic t
cosine genlogistic loglaplace triang
dgamma genpareto lognorm truncexpon
dweibull gilbrat lomax truncnorm
erlang gompertz maxwell tukeylambda
expon gumbel_l mielke uniform
exponpow gumbel_r nakagami vonmises
exponweib halfcauchy nct wald
f halflogistic ncx2 weibull_max
fatiguelife halfnorm norm weibull_min
Appendix B. Simulation model for E2 Simulation model for E2
Appendix C. Simulation model for E3 Simulation model for E3
Appendix D. Simulation model for E1P4 Simulation model for E1P4
Appendix E. Simulation model for E2P4 Simulation model for E2P4
Appendix F. Simulation model for E3P4 Simulation model for E3P4