HAL Id: hal-02329484
https://hal.archives-ouvertes.fr/hal-02329484
Submitted on 22 Sep 2020
HAL is a multi-disciplinary open access
archive for the deposit and dissemination of
sci-entific research documents, whether they are
pub-lished or not. The documents may come from
teaching and research institutions in France or
abroad, or from public or private research centers.
L’archive ouverte pluridisciplinaire HAL, est
destinée au dépôt et à la diffusion de documents
scientifiques de niveau recherche, publiés ou non,
émanant des établissements d’enseignement et de
recherche français ou étrangers, des laboratoires
publics ou privés.
Large amplitude motions within molecules trapped in
solid parahydrogen
Alejandro Gutiérrez-Quintanilla, Michèle Chevalier, Justinas Ceponkus,
Rolando Lozada-Garcia, Jean-Michel Mestdagh, Claudine Crépin
To cite this version:
Alejandro Gutiérrez-Quintanilla, Michèle Chevalier, Justinas Ceponkus, Rolando Lozada-Garcia,
Jean-Michel Mestdagh, et al.. Large amplitude motions within molecules trapped in solid
parahydro-gen. Faraday Discussions, Royal Society of Chemistry, 2018, 212, pp.499-515. �10.1039/C8FD00080H�.
�hal-02329484�
Faraday Discussions
ARTICLE
a.Institut des Sciences Moléculaires d'Orsay (ISMO), UMR 8214, CNRS, Univ. Paris-
Sud, Université Paris-Saclay UMR 8214, F-91405 Orsay, France.
b.Instituto Superior de Tecnologías y Ciencias Aplicadas (InSTEC), Universidad de La
Habana. Ave. Salvador Allende No. 1110, Quinta de los Molinos, La Habana 10400, Cuba.
c.Institute of Chemical Physics, Vilnius University, Sauletekio av. 9 bat. III, L-10222
Vilnius, Lithuania
d.LIDYL, CEA, CNRS, Université Paris-Saclay, F-91191 Gif-sur-Yvette, France † Present address: Thales SFI, THALES, 14 rue Grange Dame Rose, 78014 Vélizy-Villacoublay, France
Electronic Supplementary Information (ESI) available: [details of any supplementary information available should be included here]. See DOI: 10.1039/x0xx00000x
Received 00th January 20xx, Accepted 00th January 20xx
DOI: 10.1039/x0xx00000x
www.rsc.org/
Large Amplitude Motions within Molecules Trapped in Solid
Parahydrogen
Alejandro Gutiérrez-Quintanilla, a,b Michèle Chevalier, a Justinas Ceponkus,c Rolando R. Lozada-García, a,b† Jean-Michel Mestdagh,d and Claudine Crépin *a
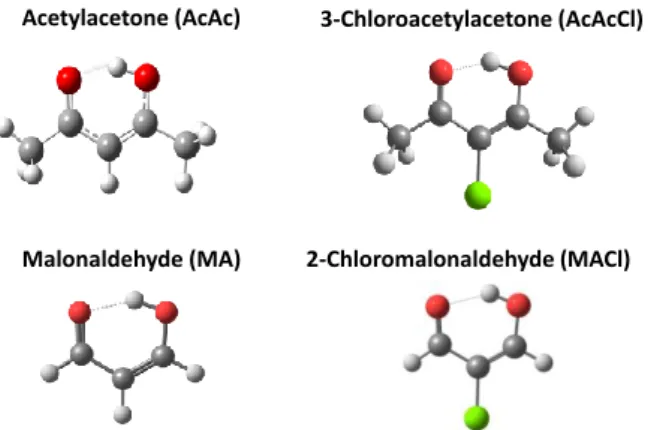
Molecules of the -diketone and -dialdehyde families were trapped in solid parahydrogen (pH2) to investigate the
vibrational behavior of systems including an intramolecular hydrogen bond (IHB). In the simplest -diketone, acetylacetone (AcAc), the H transfer related to the IHB is coupled with methyl torsions. In pH2, the study of the nuclear
spin conversion (NSC) in methyl groups allows the characterisation of the influence of these large amplitude motions on the vibrational modes. The deuteration of the OH group involved in the IHB has important consequences on the vibrational spectrum of the molecule and evidence of NSC in methyl groups is difficult to get. In the chlorine derivative (3-chloroacetylacetone), the H-transfer is not anymore coupled with methyl torsion, and NSC has undetectable effects on the IR spectrum. A search of H tunneling splitting in the IR spectrocopy of -dialdehydes trapped in pH2 was performed. A
few modes of 2-chloromalonaldehyde appear as doublets and were assigned to tunnelling levels. The spectroscopic results related to large amplitude motions are detailed and discussed, highlighting puzzling effects.
Introduction
Parahydrogen (pH2) solid offers specific qualities as a matrix
host that allows great improvements in molecular
spectroscopy and photochemistry of matrix isolated species.1–5
Due to the large zero-point motion of hydrogen molecules in the solid, the distance between nearest neighbours is as large
as in solid argon (0.379 nm in pH2 vs 0.376 nm in Ar),6 with the
advantage that this “quantum” solid is especially soft for the trapped molecular guests. This has two main spectroscopic consequences. First, the bands are essentially homogeneously broadened because of the lack of multiple rigid trapping sites. Second, the small molecules can rotate almost freely. Hence, high resolution spectra can be obtained with rotational
resolution.1 The situation is more complex with non-linear
molecules when both small and large moments of inertia are
present. For example with CH3F, only the rotation about the
C-F axis is weakly perturbed by the pH2 environment.7 Similarly,
large amplitude motions such as methyl torsions seem
preserved in pH2. The spectra of large species are also
expected to be simplified in this cryogenic quantum host, allowing the analysis of intrinsic properties of the molecular guest.
Our group is interested in using the pH2 matrix isolation
technique to study molecules where an intramolecular hydrogen bond (IHB) is coupled with specific vibrational modes
of the molecule and leads to observable broadening.8,9 Our
goal is to explore the H transfer as a large amplitude motion within these molecules, possibly coupled with other large amplitude motions.
In the -diketone and -dialdehyde families, the molecules
that are present in the gas phase as chelated enols in their most stable form are good candidates for such studies. A
resonant assisted hydrogen bond (RAHB), due to a electronic
delocalization in the pseudo cycle of the molecule, enhances
the strength of IHB.10 The molecules of interest in this paper
ARTICLE Faraday Discussions
Please do not adjust margins
The case of Acetylacetone (AcAc) is especially interesting because three entangled large amplitude motions are at play in this molecules, the H-transfer being coupled with the torsion of the two methyl groups. The first results on large amplitude motions in AcAc were published in a former work of
our group where the IR spectrum of AcAc trapped in pH2 was
found to change at a very long time scale.11 This behaviour was
assigned to a Nuclear Spin Conversion (NSC) process within the methyl groups, as explained further in the text. With NSC in methyl groups, this work offered a novel and promising tool to study infrared absorption spectra from levels differing only by a small amount of torsional excitation. The observed spectra revealed indeed a clear broadening of specific vibrational bands upon such torsional excitation, an information that can hardly be obtained by other techniques.
In the present paper, we discuss these results on AcAc in pH2
in terms (i) of quantum matrix effects, by comparison with
AcAc in nH2, (ii) of deuteration effect, in experiments with
double deuterated acetylacetone (AcAcD2, where the D-atoms
are carried by the -OD and =CD groups) in pH2, and (iii) of
substituent effect, in experiments with 3-chloroacetylacetone (AcAcCl) in pH2. In solid pH2, it is difficult to get rid of
ortho-hydrogen (oH2) impurities and NSC process in H2 (conversion
oH2 → pH2) can be followed through the time evolution of the
guest bands perturbed by an oH2 neighbourhood.
3
The additional experimental results, compared to those published in ref. 11, document this point also and bring a deeper
investigation of the AcAc/pH2 system.
In AcAc, because of the presence of methyl groups and their coupling with the H transfer, it is not possible to observe a splitting of vibrational levels due to the H tunnelling in the IHB.
Even in the gas phase, vibrational bands are as broad as in pH2
matrix.12 In contrast, this tunnelling splitting was observed and
measured in jet experiments for many vibrational modes of
malonaldehyde (MA), the simplest -dialdehyde.
Unfortunately, its synthesis is difficult. We obtained only very
preliminary results on MA/pH2 samples. We preferred
conducting experiments with the chlorine derivative (MACl,
see Figure 1) in pH2. We detected doublet lines in its IR
spectrum which can be assigned to the H tunnelling splitting in
specific vibrational levels.13 Surprisingly, similar doublets were
observed in argon matrices, whereas the H-tunnelling of MA
was completely quenched in that solid.14 Our preliminary
results on the -dialdehyde family highlight the advantages to
study H tunnelling in pH2.
Experimental
Chemicals and deuteration synthesis.
Acetylacetone (C5O2H8, 99.5%) was purchased from Fluka,
3-chloroacetylacetone (C5O2H7Cl, 97%), and
2-chloromalonaldehyde (C3O2H4, 95%) from Acros.
Double deuterated acetylacetone (AcAcD2) was prepared following synthesis steps published in Dea Kin-Kin doctoral
thesis, with small modifications.15 Only the hydrogen involved
in the IHB and the olefinic one (the most labile hydrogens) were substituted by deuterium atoms. The whole procedure of deuteration can be examined in ref. 16. Roughly, synthesis consisted in refluxing, under dry conditions, a mixture of
acetylacetone and deuterated water (D2O, >99.9% from
Sigma-Aldrich) for approximately 4 hours at 80-90oC. After reaching
equilibrium at room temperature, organic and aqueous phases were separated by a decantation process, adding sodium chloride (NaCl, >99% from Sigma-Aldrich) and cooling the sample to improve the separation. We added a small quantity
of sodium sulfate (Na2SO4, >99.5% from Merck) to eliminate
possible water impurities in the final product and decanted this mixture at the end.
A first qualitative test to evaluate deuteration was made through the comparison of the gas phase spectra of deuterated and non-deuterated acetylacetone (AcAcH8). The comparison between both spectra and those published by
Ogoshi,17 confirmed the success of the deuteration. Attained
yield for exchange (deuteration) with non-methyl hydrogens was in general around 90%, value deduced from IR spectra in neon matrix. This value included double and mono deuteration, with a yield of AcAcD2 always above 65%. At the end of each synthesis, the final product was stored in a glass reservoir, connected to a vacuum line and degassed with freeze-pump-thaw cycles. Deuteration quality was maintained over long periods (months).
Matrix isolation setups.
The experimental set-ups have been described in details in
some of our previous publications.9,16 Briefly, the experimental
setup includes two helium cryostats: one closed cycle for the
ortho/para-hydrogen conversion process (Air Products,
Displex) and another for the sample deposition. In our first experiments, the latter cryostat was a liquid helium SMC flow
cryostat11 (minimum working temperature of 3.8 K) and more
recently this cryostat was replaced by a closed cycle helium one (ICE: Innovative Cryogenic Engineering, He Compressor: Sumitomo F-50) reaching a minimum temperature of 2.8 K. Both cryostats are connected through a stainless steel line. The host gas flux and the amount of vapour from the sample
Acetylacetone (AcAc) 3-Chloroacetylacetone (AcAcCl)
Malonaldehyde (MA) 2-Chloromalonaldehyde (MACl)
Figure 1: Chelated enol conformers of the molecules under investigation with their short names used in the paper.
Faraday Discussions ARTICLE
entering the line were controlled by microvalves. The mixture of gases arrived directly in front of an internal diamond window, which is attached to the second stage of the cold head of the cryostat. Matrix quality was verified through the infrared spectrum of the deposited sample. The amount of
ortho-hydrogen in the matrix can be controlled or increased by
raising the temperature of the cryostat dedicated to the
conversion. Annealing of pH2 matrices at 4.5 K was performed
to get rid of parts of fcc structures in the solid and to obtain
only the stable hcp lattice of pH2.4 No spectral change was
detected, indicating a lack of fcc structures in our experimental conditions. In particular, we observed a weak amount of water
in most of our samples and the IR signature of H2O in a fcc
surrounding18 was missing. The guest/host ratio was typically
in the 1/1000 to 1/2000 range. The ratio is deduced from the ratio between hydrogen and guest bands.
Infrared spectra were acquired using a standard FT-IR spectrometer (Nicolet Nexus 670/870), and a liquid nitrogen-cooled MCT (HgCdTe: Mercury Cadmium Telluride) detector. The spectra were recorded in transmission mode with a 0.5
cm-1 resolution level. The IR beam path was purged with dry
air.
It is important to note that a direct investigation of the –OH stretching mode (the most involved in the IHB) is impossible in the molecules studied here, because the corresponding IR band is too broad to be detected and analysed.
Results and discussion
Some of the results reported below appeared in previous publications with a short analysis. They are complemented here by additional studies to allow a deeper investigation of the molecular processes which pertain to large amplitude motions in the molecules under study. They also bring evidence of puzzling effects which are tentatively explained.
Acetylacetone family and NSC in hydrogenated matrices.
Fully hydrogenated acetylacetone AcAcH8. The experiments in
pH2 described in ref. 11 were reproduced with the new set-up
at 2.8 K. The use of the closed cycle cryostat allows keeping
matrix without evaporation for longer times and we were able to record the IR spectra during five days (instead of 24h in our previous experiments). Figure 2 shows the initial and the final spectra (panels a and b respectively). Comparison between the two spectra shows clearly a time evolution at the day scale. The same observation was done in ref. 11, where the spectrum was deconvoluted in two components, one decreasing in time (less stable species) and the other increasing with time (most stable species, whose spectrum is reproduced in Figure 2, panel c for comparison).
The time evolution of the spectrum was attributed to the NSC process in the guest molecule. More precisely, it is essentially due to NSC within the methyl group bonded to C=O. As shown in figure 1, the two methyl groups of AcAc are non-equivalent, with different orientations facing the central CH group. The full pattern of torsional levels in AcAc is made complex because of the presence of these two methyl groups coupled with the H
transfer.19 Nevertheless, theoretical calculations predict
indeed a substantially lower rotational barrier for the methyl
group on the C=O side (noted hereafter mCO) than for the
other methyl:11,20 32 cm-1 for mCO vs 411 cm
-1
for the other methyl in DFT calculations at the B3LYP/6-311G(3df,3pd) level of theory. Hence, the torsional levels of the lowest energy are split by tunnelling through this particular periodic torsional potential in sub-levels of different symmetries (E and A) with a
larger gap for mCO than for the other methyl. Because of the
parity constrain of the total wavefunction, the E and A levels are not associated with the same nuclear-spin combination of
the three H-atoms in the mCO group. The lowest level (A) is
associated with the nuclear spin I=3/2 and the other one (E)
with I=1/2. At the low temperature of the pH2 matrix,the E and
A levels of lowest energy are thus populated by molecules
differing by the nuclear spins of the mCO hydrogens. In a first
approximation, the NSC process mentioned in the introduction
is assigned to NSC in mCO hydrogens and is observed due to the
thermal relaxation at 3K from E to A states within the mCO
group. Due to the presence of the second methyl group, each
of these states contains in fact several levels19 and we will call
them pseudo E and A states, noted “A” and “E” respectively. Hence, the observed spectrum is a superposition of two spectra. One is associated with absorption from the “A” state of lowest energy and the other to the “E” state. From the analysis of ref. 11, the most stable species is assigned to
AcAcH8 in the lowest “A” state of the mCO rotor (spectrum
displayed in Figure 2c). Several bands of “A” and “E” spectra are clearly distinct. They concern specific modes. For example,
the -OH out-of-plane bending mode around 950 cm-1 has a “A”
component at 950 cm-1 and a “E” component at 961 cm-1 (see
Figure 2). Other “doublet” structures associated with “A” and “E” components are observed when comparing Figures 2a and 2b. A very important point regarding the present work concerns very specific modes where the “E” component is much broader than the “A” component. Such a situation is met
in Figure 2 with the bands at 1250 cm-1 and 1463 cm-1,
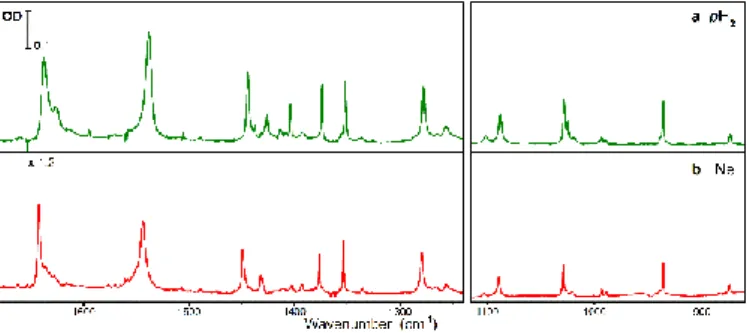
Figure 2: IR spectra of AcAcH8 isolated in pH2 (a) as deposited sample (the amount of
oH2 is estimated ≤ 0.01% in this sample) (b) five days later (c) most stable species
ARTICLE Faraday Discussions
Please do not adjust margins
showing broad blue wings of higher intensity in 2a than in 2b and missing in 2c. These wings were assign to the “E”
spectrum.11
Turning back to the present results in Figure 2, the IR spectrum of panel b) is not identical to that of panel c). Hence, even after five days, the spin relaxation is not completed and a small amount of torsionally excited AcAcH8 is still present in the sample. The ratio “A”/”E” between the two components is measured as 9.00±0.05 at the end of the present experiment, while it was 0.96±0.05 in the as-deposited sample.
NSC from ortho- to para-hydrogen is also observed in the host
itself because of the presence of oH2 impurities. These
impurities are inherent to pH2 solids and induce weak spectral
changes in the guest bands.3,21,22 We performed experiments
where the AcAcH8/pH2 samples contain various amounts of
oH2 in order to check that the time evolution of the spectral
bands was not due simply to the oH2-pH2 NSC when one or
several oH2 molecules form a complex with AcAcH8. The
amount of oH2 was varied from 0.01% to a few %, as estimated
either from the temperature of the converter or from the
intensity of the oH2 band at 4153 cm-1.23 The comparison of
the spectrum displayed in the present Figure 2a (sample with
0.01% oH2) with that given in Figure 2a of Ref. 11 (sample with
0.7% oH2) shows that the presence of a small amount of oH2
does not modify considerably the observed vibrational bands compared to the changes discussed above between metastable and stable components of the spectrum. This confirms the assignment of the latter changes to the transitions from “E” and “A” rather than to complexation with
oH2.
Complexation of AcAcH8 with oH2 can be achieved on purpose
when large amounts of oH2 is present in the pH2 matrix. Figure
3 displays the results obtained in a sample containing a large
amount of oH2 (22% after deposition) and kept one day long to
illustrate the combination of time and oH2 effects on AcAcH8
vibrational features. Only the most significant parts of the IR spectra are shown in Figure 3, i.e. the vibrational bands with
quite distinct “A” and “E” components in pH2; panels a and b
correspond to spectra obtained with the sample of Figure 2 for
easier comparison with the H2 (22% oH2) sample displayed in
panels c and d; panels a and c correspond to as-deposited samples whilst panels b and d correspond to the same samples 22h later, respectively. In the selected spectral ranges, the “A” components are at lower energies than the “E” components.
Even with a large amount of oH2, the “A” component is strong
(see for example at 1361 and 950 cm-1 in Figure 3c), whereas it
should be very weak if this component were assigned to
AcAcH8 without oH2 as nearest neighbours. The bands
showing distinct “A” and “E” components in pH2 are less
structured in H2 (22% oH2). However a time evolution is
observed (compare c and d panels of Figure 3) exhibiting the
same tendency as in pH2, assigned to NSC from “E” to “A”.
Because of its quadrupole moment, oH2 has specific
electrostatic interactions with the guest molecules.3,4 Our
photoisomerisation study of AcAcH8 in hydrogen solids has shown that these interactions allow the detection of an
additional open isomer of AcAcH8 in nH2 which is not
observed in pH2.24 This specific isomer was found to isomerize
to a more stable form in pH2 by a tunnelling process,
25
which is
quenched in nH2 by the additional quadrupole interaction.
Taking this peculiar interaction between oH2 and AcAcH8 into
account, we propose a tentative scheme to rationalize the
available observations. When AcAcH8 is complexed with oH2
molecules, the concerted H-atom transfer mechanism where the methyl torsions are involved may be reduced and the
torsional barrier of mCO increased. The “E”-“A” splitting is
therefore reduced or even suppressed in both the ground state and the vibrational levels.
A first consequence of this model is that AcAcH8 complexed
with oH2 has a single absorption line (or two very close ones)
whatever the mode which is excited. The red components in
the oH2 experiments, at about the same location as in the pure
pH2 experiments, would correspond to these single lines. A
second consequence is when an oH2 molecule which is
complexed with AcAcH8 experiences a NSC and switches to
pH2. Before the oH2-pH2 conversion, the nearly degenerated
“E” and “A” states are almost equally populated at the matrix
temperature (~3K). Upon oH2-pH2 conversion, “E” and “A”
state splitting increases. Actually, with 22% oH2 in the sample,
several oH2 molecules are complexed with AcAcH8. The “E”
and “A” splitting may therefore appear as a “semi-continuum”,
depending on the number of oH2 molecules and the number of
oH2-pH2 conversions which are involved. This is in line with the
absence of band structures in H2 (22% oH2) and the enlarged
blue sides of the bands in Figure 3c instead of the clear blue components in Figure 3a.
With such a model, the observed time evolution would reflect
two NSC processes which have opposite spectral
consequences: NSC within the AcAcH8 methyl groups and the
oH2-pH2 conversion. As just discussed, the oH2-pH2 conversion
induces a change of the “E”-“A” splitting, which switches from
very small to its value in pure pH2. Before conversion, the “E”
and “A” components are almost equally populated and the
very slow oH2-pH2 conversion feeds these two components in
Figure 3: Zooms on parts of IR spectra of AcAcH8 (a) and (b) in pH2 (same sample as in
Figure 2, 0.01% oH2), as deposited and 22h later, respectively; (c) and (d) in H2 (22%
Faraday Discussions ARTICLE
equal amounts when the “E”-“A” splitting has switched to its
pure pH2 value. This is consistent with the persistent
observation of “E” components. Then the “E”-“A” conversion itself proceeds in molecules for which the “E”/”A” ratio of population is out of thermal equilibrium. The global result is a decrease with time of all the “E” components as observed experimentally (Figure 3d).
Double deuterated acetylacetone AcAcD2 in pH2. Since the
methyl torsions are coupled with the hydrogen transfer in acetylacetone (a D-atom transfer in AcAcD2), it is interesting
to compare the spectral behaviour of AcAcH8 in pH2 to that of
AcAcD2. Figure 4 displays the IR spectrum of AcAcD2 in pH2
matrix just after deposition. It shows much narrower lines than AcAcH8 (Figure 2a). Strikingly, the AcAcD2 spectrum in
pH2 is very similar to that observed when AcAcD2 is isolated in
a neon matrix.25 The latter is displayed in Figure 4, for
comparison.
This is in strong contrast with the observations of AcAcH8 where many vibrational bands are broader and more
structured in pH2 than in Ne, due to the superposition of the
spectra from “A” and “E” levels in the quantum matrix.11 Table
1 reports the experimental frequencies in pH2 and Ne,
together with the theoretical predictions given in ref. 25. The deuteration effect is important on almost all the vibrational bands and, as just said, in about the same way as in
Ne.25 A band narrowing upon deuteration was expected in all
the bands involving a –OH(D) motion because of the more
localized deuterium atom in the IHB.26 In particular the –OH(D)
bending is at play in many vibrational modes and the deuteration of the hydroxyl group affects a lot of bands. One can also notice that the OD stretching mode is detected as a
very broad band around 1990 cm-1 whereas the OH stretching
mode was not observed in the spectrum of AcAcH8/pH2
because of a too strong broadening.
As expected from the similarities between spectra in pH2 and
in Ne, a time evolution of the AcAcD2 bands is hardly detected
when looking for NSC in mCO. Only slight changes in some
bands are observed when keeping the matrix during few days.
This strongly different behaviour between AcAcH8/pH2 and
AcAcD2/pH2 samples is a further evidence that NSC in the
methyl groups is a signature of the efficiency of the concerted mechanism between methyl group torsion and H-atom transfer.
The most important time evolution in AcAcD2/pH2 is detected
in the band around 708 cm-1, assigned to the -OD out-of-plane
bending mode (OD). It is in agreement with the AcAcH8
changes where the larger shift between “E” and “A” spectra
was detected in the OH band.11 Right panel of Figure 5 shows
the time evolution of this band in a sample kept at 3K during eight days. This specific sample contained AcAcH8 and monodeuterated acetylacetone as impurities and the time
evolution of the OH band assigned to these species in the
same sample is also displayed in Figure 5, left panel (in Ne, the
frequency shift between the OH modes of AcAcH8 and the
monodeuterated isotopologue (0.5 cm-1) was much smaller
than the bandwidth (5 cm-1)25 and the two species were
difficult to distinguish in the spectra of Figure 5). The
frequency gap between the OD bands in “E” and ”A” states is
reduced to 1.4 cm-1 while it is 11 cm-1 in the OH mode.
Obviously, the torsional energy brought in the “E” state has only a very weak influence on the IR spectrum of AcAcD2.
Table 1: Experimental frequencies of the chelated enol form of AcAcD2 in neon and
para-hydrogen matrices, compared to calculated harmonic frequencies
[B3LYP/6-311++G(3df,3pd)] (cm-1). Intensities (km/mol) obtained in the harmonic approximation.
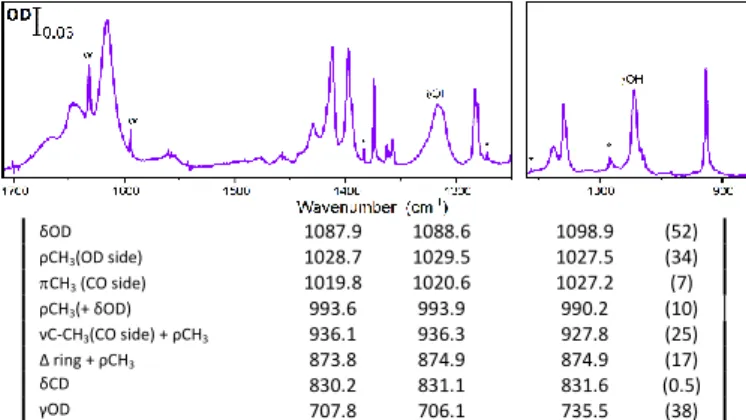
Assignment a Experiment Theoreticalb pH2 Neb harmonic*sf c (Intensity) νaCH3 (CO side) 3015 3034 d 3027d 3083.2 (10) νaCH3 (OH side) 3078.3 (9) νaCH3 (OH side) 2971 3031.5 (5) νaCH3(CO side) 3029.5 (6) νsCH3 (OH side) 2935 2951d 2980.5 (8) νsCH3 (CO side) 2928 2976.4 (3) νCD 2299 2304.5 2328.7 (1) νOD 1991e 2000d 2158.3 (259) νa(C=C + C=O ) 1637.2 1641.8 1631.7 (263) νs(C=C + C=O ) + δOD 1538.5 1544.2 1530.6 (374) δaCH3(OD side) 1444.6 1449.4 1448.3 (87) δaCH3(CO side) 1426.3 1429.3 1436.9 (39) sCH3(OD side) 1392.9 1392.7 1391.5 (28) δsCH3 1374.0 1376.1 1376.8 (11) δsCH3(CO side) 1352.3 1354.0 1358.5 (54) sC-C-C=C-C ring breath 1278.0 1279.5 1278.4 (126) Figure 5: Infrared spectra (after subtraction of AcAcH8 and monodeuterated
isotopologues) of double deuterated acetylacetone (AcAcD2) in (a) para-hydrogen and (b) neon matrices.
Figure 4: Time evolution of OH (left panel) and OD (right panel) bands in an AcAcD2/pH2 sample including totally hydrogenated and monodeuterated acetylacetone as impurities.
ARTICLE Faraday Discussions
Please do not adjust margins
δOD 1087.9 1088.6 1098.9 (52) ρCH3(OD side) 1028.7 1029.5 1027.5 (34) CH3 (CO side) 1019.8 1020.6 1027.2 (7) ρCH3(+ δOD) 993.6 993.9 990.2 (10) νC-CH3(CO side) + ρCH3 936.1 936.3 927.8 (25) Δ ring + ρCH3 873.8 874.9 874.9 (17) δCD 830.2 831.1 831.6 (0.5) γOD 707.8 706.1 735.5 (38) a
main characteristic motions; ν, stretching; δ, in plane bending; γ, out of plane bending;
ρ, in plane rocking; , out of plane rocking; Δ, in plane ring deformation; s, symmetric;
a, asymmetric; bfrom reference 25 ; csf: scaling factor (0.981); d broad bands; every
broad band, the center is not well defined
In our DFT calculations at the B3LYP/6-311++G(3df,3pd) level
of theory, the torsional harmonic frequencies localized in mCO
are the same in AcAcH8 and AcAcD2 (28 cm-1) indicating
similar rotational wells.16,24,25 Nevertheless, because of the
coupling with the H or D transfer, the energy gap between “E” and “A” ground states depends on the deuteration. Without theoretical investigations, the decrease due to deuteration is
difficult to estimate. The tunnelling splitting related to mCO was
measured in solid acetylacetone by means of neutron scattering: its value was reduced in AcAcD2 to 76% of the
AcAcH8 splitting.27 The deuteration effect highlighted in
Figures 4 and 5 underlines the reduced hydrogen transfer in AcAcD2.
3-chloro acetylacetone AcAcCl in pH2. The substitution of H by Cl
in the alpha position has an important effect on the structure of the molecule as shown in Figure 1: the two methyl groups
have symmetric orientations versus the C-Cl axis in AcAcCl.28
The consequence is that the H transfer is no longer coupled with the methyl torsions in this molecule.
Figure 6 shows the IR spectrum of AcAcCl in pH2. Some bands
are especially broad. They are associated with modes involved in the H bond, for example the OH in-plane bending mode
(OH) marked in the figure. The OH band is observed at 972 cm
-1
, i.e. at a higher frequency than the OH band of AcAcH8
located at 950 cm-1 in pH2. It is in agreement with a stronger
IHB in AcAcCl, as previously observed and theoretically
predicted.28–30 The strength of the IHB is due to steric effects:
the repulsion between lone pairs of Cl and electrons of the
pseudocycle induces a decrease of the O···O distance.28
Waiting for days to observe a NSC effect was unsuccessful, as expected. Theoretically, the lowest torsional frequency is
predicted much higher (at 78 cm-1 at the
B3LYP/6-311++G(3df,3pd) level of theory) than for mCO in AcAcH8. It
implies higher torsional barriers and smaller tunnelling splittings for both methyl groups. In such cases, the related E and A levels can be more or less equally populated at 3K. In these conditions, NSC in the methyl groups of AcAcCl cannot be observed in our experiments. As the H transfer is not
coupled with methyl torsions, a vibrational excitation can promote the H transfer in similar ways for all the torsional levels. The energy difference between the levels of different symmetries is not large enough to distinguish their absorption spectra in the matrix.
The example of AcAcCl, involving a strong IHB (stronger than in AcAc), demonstrates again the specificity of the results
obtained with AcAc in pH2, due to the internal characteristics
of AcAc with methyl torsions entangled with H transfer, and not to guest/host interactions.
NSC in AcAc: Kinetics. The rate of NSC between “E” and “A”
states of AcAc is very slow, at the day scale. It has the same order of magnitude as NSC in the methyl groups of small
molecules embedded in pH2.7,31 Its observation is very
challenging and only very few samples were kept at 3K during days to perform kinetic studies. The very slow NSC process is sensitive to the presence of impurities and to the amount of guest molecules in the sample. A quantitative kinetic study is therefore difficult and only tendencies are reported below.
In the spectra of AcAcH8/pH2 shown in Figure 2a and 2b, the
amount of oH2 is very small (≤ 0.01%) and the rate of NSC is
estimated to 0.021 h-1. It is slower than the value of 0.045 h-1
reported in ref. 11 obtained in a sample carrying 0.7% oH2.
This is not surprising given examples reported where the NSC
rate is enhanced in the presence of oH2 impurities.7,32
The spectrum taken from a sample enriched with oH2 is shown
in Figure 3. The experimental conditions were similar to those of Ref. 11 (i.e. using the SMC cryostat). Surprisingly, and in apparent contradiction with the previous assessment on the
oH2 effects, the NSC rate was estimated at least a factor two
slower than in the comparable experiment in pH2. In fact, this
slowed down rate can be interpreted by the opposite effects
of NSC in H2 (oH2→pH2 conversion) and NSC in AcAc, as
discussed previously. A decrease of the NSC rate in clustering
with (oH2)n was already observed in the study of water in pH2
solids.18
From our experiments with the deuterated species, it was not possible to extract a clear conclusion on the deuteration effect on the NSC kinetics. The rates of NSC in the hydrogenated or mono and double deuterated AcAc are similar, as illustrated in Figure 5.
The simplified picture of “E” and “A” states is consistent with the measurement of an equal population of these states in the initial spectrum of AcAcH8 (Figure 2a). This actually reflects the populations of these states at room temperature before the matrix deposition. The population ratio between these two “A” and “E” states when, at long time, AcAcH8 is at equilibrium at the matrix temperature is a way to quantify the tunnelling
splitting E in the ground state: E=kTln([“A”]T /[“E”]T) where
[X]T is the population of X state at the thermal equilibrium at
the temperature T, taking into account that the degeneracy of “A” and “E”, including nuclear spin statistics, are the same. In practice, such a measurement is very difficult to achieve
Faraday Discussions ARTICLE
because the quality of the observed spectrum becomes extremely bad when the isolation time is very long. Hence, full
equilibrium cannot be reached. Only a lower bound E > 5±1
cm-1 can be given. This value is similar to that reported for the
free rotation of the methyl group of CH3F in pH2.7 It highlights
a valuable enhancement of the E-A splitting in a methyl torsion by coupling with the H transfer. Theoretical calculations taking into account all the couplings at play in AcAc possibly explain
this result,19 but further theoretical investigations would be
necessary for a full understanding.
Vibrational analysis. The differences between the spectra of “E”
and “A” states reflect the effect of a small amount of torsional energy on vibrational transitions. In AcAc, the H-transfer is realized in a concerted mechanism involving both (i) a rearrangement between the C-C and C=C (resp. C-O and C=O) bonds of the pseudo cycle and (ii) methyl torsions. H-transfer will be easier from the “E” state when combined with well-adapted in–plane vibrations. Actually, when a small amount of
torsional energy is present in mCO (“E” state), many vibrational
modes of AcAcH8 are affected, especially those participating to the H-transfer. In particular, we observed a broadening of the bands from the “A” spectrum to the “E” one, more or less pronounced, depending on the mode. This is presented in the supplementary material of Ref. 11 but not discussed, given the format of this publication. This is partly highlighted in Figure 2 and discussed hereafter in the light of the mode description performed in our B3LYP/6-311++G(3df,3pd) calculations (see
in particular the supplementary material of Ref. 11).11,25
The largest shift between “E” and “A” bands is measured in the
OH mode (11 cm-1) with a higher frequency in the “E” state.
This mode is well localized on the hydroxyl group in that kind of molecules, and its frequency increases with the strength of the IHB. We know from the “NSC in AcAc: Kinetics” section above that the “E”-“A” splitting is quite large in AcAcH8. It puts the
“E” level not far from the top of the mCO torsional barrier.
Likely, the corresponding wavefunction has a quite large extension along the torsion coordinate. In this context, the observed blue shift is in agreement with calculations performed on the corresponding transient rotamer involving
symmetric methyl groups (i.e. with a /3 rotation of mCO),11
and is consistent with a much easier H-transfer in the “E” level.
In the 900-1000 cm-1 spectral range, two other modes show
significant changes whether “A” or “E” spectra are considered:
a blue shift (5 cm-1) and broadening from “A” to “E”. These
modes, with maxima at 997 and 911 cm-1 in the spectrum of
Figure 3b, involve the rocking of mCO and affect the O···H-O
geometry.
A “A” to “E” blue shift of 2 cm-1 is also clearly observed in the
narrow and intense band near 1362 cm-1 (Figure 3). It is
assigned to the umbrella bending mode of mCO. The
narrowness of the “A” and “E” bands underlines the absence of coupling of that mode with the IHB. Likewise, the out-of-plane bending mode of the CH olefinic group (observed at
770 cm-1) appears also as a narrow band. In contrast with OH,
it shows a red shift (1.8 cm-1) from “A” to “E” states, indicating
less steric constraints in the “E” state.
The in-plane bending motion of the hydroxyl group (OH) is
involved in several modes of AcAcH8 detected in the
1200-1700 cm-1 spectral range. The OH contribution is dominant in
the band around 1290 cm-1. It is very broad, ca 80 cm-1, as
shown in figure 2c where the “A” component is extracted and appears as a kind of large “background”. Its maximum cannot be determined accurately. This prevents observing a possible
effect due to the mCO torsional excitation. A narrower band
(width of 9 cm-1) is detected in its vicinity at 1250 cm-1. Its blue
wing observed in Figure 2a (corresponding to the “E”
component) is much broader (ca 30 cm-1) than the “A”
component shown in Figure 2c. This reflects the effect of the
mCO torsion on the coupling of this mode with the H transfer:
this mode involves a OH motion which is not in phase with the
pseudo cycle deformation accompanying the H transfer, in
contrast with the former mode around 1290 cm-1. The
vibrational enhancement of the H-transfer is not strong in the “A” state for that latter mode, whilst an additional torsional energy helps thus a lot to induce the H-transfer.
More puzzling is the broadening in the “E” state of the mode
at 1463 cm-1. Its bandwidth increases by more than a factor
seven when switching from the “A” to “E” spectrum (Figure 2): this mode involves very weakly a motion of the IHB part of the molecule and is more localized on the asymmetric bending
(scissor) of the other methyl group (mOH). This suggests that
the promotion of both methyl motions can by itself enhance the coupling with the H transfer.
Surprisingly, the time evolution of the AcAcD2 spectrum does not highlight numerous vibrational effects related to NSC in
mCO. We saw indeed that the most obvious one concerns the
OD mode. The “E”-“A” shift is reduced to 0.2% of the
vibrational energy, five time less than for OH. One can
distinguish very small blue shifts (< 0.5 cm-1) in the bands at
874 and 1352 cm-1, assigned to modes involving bendings of
mCO. No significant broadening of the bands in the “E” state is
detected. Whereas the time evolutions on the OH and OD
modes lead to “E”/”A” ratio of the same order at infinite time, the effect of the torsional energy in the “E” state does not affect significantly the vibrational bands, i.e. the vibrational coupling with the D transfer. The deuteration effect in the IHB is strong and appears to quench the torsional effects detected in AcAcH8.
These results show that a perturbation of one of the three large amplitude motions involved in the H-transfer mechanism would affect severely the process, thus reducing substantially the efficiency of the concerted mechanism.
ARTICLE Faraday Discussions
Please do not adjust margins
Without methyl groups, the molecules of the -dialdehyde
family under study involve the H-transfer as single large amplitude motion. Malonaldehyde (MA) in its enol form, depicted in Figure 1, is the simplest molecule with an IHB in a pseudo aromatic ring system allowing a RAHB. Although the
barrier in the H-transfer seems higher in MA than in AcAc,33,34
a large splitting of energy levels due to the H tunnelling process is observed in the isolated MA molecule. This is in line with the simplified H motion in this smaller molecule. This
splitting was measured for the ground vibrational state35–37
and for various vibrational levels38–41 in the gas phase.
Surprisingly, no tunnelling was observed for the molecule
embedded in heavy matrices14,40,42,43 while it was detected for
similar but larger molecules in the same kind of matrices.44,45
Because of the quantum properties of pH2 solids, one can
expect that the H transfer will be less perturbed in MA/pH2
samples. We performed a first attempt to isolate MA in the
pH2 solid. The synthesis and the deposition of MA turned out
to be difficult to achieve, resulting in spectroscopic data of bad
quality. However, a rough comparison with data in jet
experiments suggests that H-tunnelling is preserved in the pH2
environment. Further experiments to obtain better spectra are necessary to conclude.
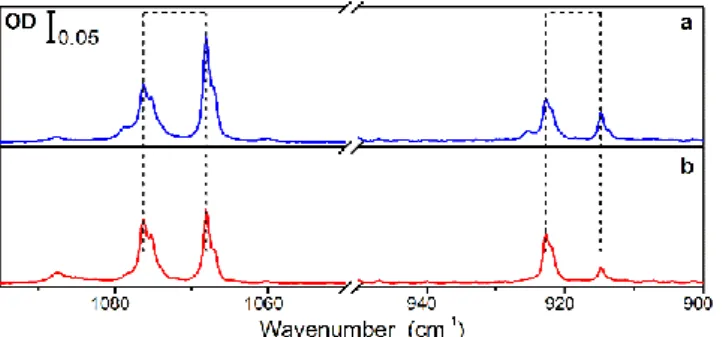
MACl in pH2. A nice IR spectrum of the chlorine derivative
(MACl, Figure 1) was obtained in pH2. A series of doublet bands
appear in the spectrum. They are assigned to H tunnelling
splitting.13 Our study brings an experimental proof of the
weakening of the IHB by the chlorine substitution of the olefinic hydrogen of MA, in agreement with theoretical
predictions.13,46 This reduces the H tunnelling splitting of the
ground state from MA (21.6 cm-1)37 to MACl. Similar doublets
are also detected when isolating MACl in Ar at 8K, i.e. at a much higher temperature, leading to assume that both levels
are populated in pH2 at 3K, on the contrary of the MA case.13
Doublets correspond thus to vibrational excitation from both ground levels to both upper levels. They are clearly detected in two specific modes (see Figure 7) for which the tunnelling splitting in the upper level is large enough. The splitting is
larger in pH2 than in Ar (8 cm-1 versus 5 cm-1), in agreement
with a less invasive environment in the case of the quantum matrix. Surprisingly, the H tunnelling process seems to be quenched in neon, since single bands are observed instead of
doublets.13
In pH2, we observed an evolution of these two doublets with
time, with an increase of the high frequency component and a decrease of the other, as shown in Figure 7. As the changes occur in the dark at the time scale of tens of hours, the process at play can be linked to NSC in the system. Due to the symmetry of the molecule, the two tunnelling levels in the
ground state, which are of A1 and B2 symmetries in the
permutation group G4, are populated by molecules with
different nuclear spins in the hydrogens of the C-H bonds.47
However, assuming a small energy gap between these two levels, a significant population transfer from one to the other level by NSC in MACl is not expected. We performed additional
experiments in pH2, in samples containing a small amount of
oH2. With ca 2% of oH2, the doublets are essentially replaced
by single bands at the frequencies of the low energy component of the doublets, i.e. at the frequencies of the components decreasing with time. We conclude that the NSC
at play is a oH2 →pH2 conversion. This matches with
observation reported above when AcAcH8 forms complexes
with oH2. Again, the tunnelling process seems to be quenched
with oH2 in the neighbourhood of the guest molecule, with a
release of the H tunnelling due to NSC in H2. The effect of oH2
impurities, as in the case of AcAcH8, is thus to constraint large
amplitude motions. One can notice that the influence of oH2
on MACl is observed even in matrices with less than 0.01% of
oH2. It suggests a high mobility of oH2 toward the guest
molecule, as was observed in CH3F/pH2 samples.21
The close matrix neighbourhood of the guest has thus a lot of influence on the H-tunnelling process: tunnelling splitting in
MACl observed in Ar and pH2, and not in Ne, quenched in
presence of oH2 in pH2, tunnelling process quenched in all rare
gas matrices in the case of MA. Extended experiments are planned in order to better rationalize these intriguing observations.
Conclusions
We probed the weakness of the interaction between a guest
molecule and the pH2 solid by investigating the environment
effects on large amplitude motions of the guest and especially on the H-transfer inside an intramolecular hydrogen bond. We observed a tunnelling splitting of vibrational levels in molecules with a strong IHB, in 2-chloromalonaldehyde of the
malonaldehyde family, in the “quantum” matrix of pH2
whereas the tunnelling process can be quenched in “classical” matrices. This tunnelling splitting is not observed in acetylacetone, even in the gas phase, because of the coupling
with the torsion of methyl groups. However, pH2 solid offers a
nice environment to test the methyl torsion as a large amplitude motion and its influence on the vibrational behaviour and the vibrational coupling with H-transfer in the latter case. We can follow the nuclear spin conversion process between torsional levels and it opens new ways to document the role of methyl torsions in reactive processes.
Figure 7: Doublets in the IR spectrum of MACl in pH2 (a) just after deposition; (b) one
Faraday Discussions ARTICLE
NSC in methyl groups was previously observed in pH2 in small
methylated molecules (methyl fluoride, methanol).7,31 Its study
in larger molecules, especially in molecules with entangled large amplitude motions, gives access to new spectroscopic information. To get spectroscopic evidence of NSC in methyl groups, the molecule must have a nearly free methyl rotor. Torsional barriers are usually too high in non-linear methylated larger molecules. The case of AcAc is specific and very interesting with its complex torsional-vibrational pattern.
The role of the traces of oH2 in pH2 solids can make harder the
understanding of the vibrational spectra, in particular in the study of NSC processes. We addressed this problem in our study to highlight the specific behaviours of MA and AcAc
derivatives in pH2.
There are still intriguing results that need a theoretical approach to be understood. In particular, we hope that our vibrational data will open the way to a theoretical analysis of the vibrational behaviour of the molecules of interest.
Conflicts of interest
There are no conflicts to declare.Acknowledgements
This work was supported by the French Science Agencies (ANR-06-BLAN-0314; RTRA Triangle de la Physique - 2010-004-T NOSTADYNE and 2013-0436T REACMAQ) and by the French-Lithuanian PHC GILIBERT program (25405YJ and 32894YA). We acknowledge the use of the computing center MésoLUM of the LUMAT research federation (FR LUMAT 2764).
References
1 T. Momose and T. Shida, Bull. Chem. Soc. Jpn., 1998, 71, 1–
15.
2 T. Momose, M. Fushitani and H. Hoshina, Int. Rev. Phys.
Chem., 2005, 24, 533–552.
3 K. Yoshioka, P. L. Raston and D. T. Anderson, Int. Rev. Phys.
Chem., 2006, 25, 469–496.
4 M. E. Fajardo, in Physics and Chemistry at Low
Temperatures, ed. L. Khriachtchev, Pan Stanford Publishing
Pte.Ltd., Singapore, Pan Stanfo., 2011, pp. 167–202.
5 M. Bahou, P. Das, Y.-F. Lee, Y.-J. Wu and Y.-P. Lee, Phys.
Chem. Chem. Phys., 2014, 16, 2200–10.
6 I. F. Silvera, Rev. Mod. Phys., 1980, 52, 393–452.
7 Y. P. Lee, Y. J. Wu and J. T. Hougen, J. Chem. Phys., 2008,
129, 104502.
8 J. Ceponkus, W. Chin, M. Chevalier, M. Broquier, A. Limongi
and C. Crépin, J. Chem. Phys.
9 R. R. Lozada-Garcia, J. Ceponkus, W. Chin, M. Chevalier and
C. Crépin, Chem. Phys. Lett., 2011, 504, 142–147.
10 G. Gilli and P. Gilli, The Nature of the Hydrogen Bond,
Oxford University Press, 2009.
11 R. R. Lozada-Garcia, J. Ceponkus, M. Chevalier, W. Chin, J.
M. Mestdagh and C. Crépin, Angew. Chemie - Int. Ed., 2012, 51, 6947–6950.
12 T. N. Wassermann, Georg-August-Universität Göttingen,
2005.
13 A. Gutiérrez-Quintanilla, M. Chevalier, R. Platakyte, J.
Ceponkus, G. Rojas-Lorenzo and C. Crépin, Phys. Chem.
Chem. Phys., 2018, 20, 12888–12897.
14 D. W. Firth, P. F. Barbara and H. P. Trommsdorff, Chem.
Phys., 1989, 136, 349–360.
15 P. Kin-Kin Dea, ‘The Nature of the intramolecular hydrogen
bonf in the enol tautomer of 2,4-pentanedione’, California
Institute of Technology, PhD Thesis., 1972.
16 A. Gutiérrez-Quintanilla, Molecules and complexes with
hydrogen bond: solvation and photoreactivity in cryogenic matrices, Université Paris-Saclay - Université Paris-Sud,
PhD thesis., 2016.
17 H. Ogoshi and K. Nakamoto, J. Chem. Phys., 1966, 45,
3113–3120.
18 M. E. Fajardo, S. Tam and M. E. DeRose, J. Mol. Struct.,
2004, 695–696, 111–127.
19 Y. C. Chou, J. Mol. Spectrosc., 2010, 263, 34–43.
20 I. Matanović, N. Došlić and Z. Mihalić, Chem. Phys., 2004,
306, 201–207.
21 K. Yoshioka and D. T. Anderson, J. Chem. Phys., 2003, 119,
4731.
22 D. T. Anderson and L. O. Paulson, J. Phys. Chem. A, 2009,
113, 1770–1778.
23 S. Tam and M. E. Fajardo, Rev. Sci. Instrum., 1999, 70,
1926–1932.
24 R. R. Lozada-García, J. Ceponkus, M. Chevalier, W. Chin,
J.-M. Mestdagh and C. Crépin, Phys. Chem. Chem. Phys., 2012, 14, 3450–3459.
25 A. Gutierrez-Quintanilla, M. Chevalier and C. Crepin, Phys.
Chem. Chem. Phys., 2016, 18, 20713–20725.
26 Z. Mielke and L. Sobczyk, in Isotope Effects In Chemistry
and Biology, eds. A. Kohen and H. H. Limbach, Taylor &
Francis, CRC Press, Boca Raton, 2005, pp. 281–304.
27 M. R. Johnson, N. H. Jones, A. Geis, A. J. Horsewill and H. P.
Trommsdorff, J. Chem. Phys., 2002, 116, 5694–5700.
28 S. F. Tayyari, M. Zahedi-Tabrizi, R. Afzali, S. Laleh, H. A.
Mirshahi and Y. A. Wang, J. Mol. Struct., 2008, 873, 79–88.
29 F. Dolati, S. F. Tayyari, M. Vakili and Y. A. Wang, Phys.
Chem. Chem. Phys., 2016, 18, 344–350.
30 A. F. Jalbout, M. Ali Naseri, M. Fazli, H. Raissi, M. Rezaei, A.
Nowroozi and A. De Leon, Int. J. Quantum Chem., 2009,
109, 1481–1496.
31 Y. P. Lee, Y. O. Wu, R. M. Lees, L. H. Xu and J. T. Hougen,
Science, 2006, 311, 365–368.
32 M. Miki and T. Momose, Fiz. Nizk. Temp., 2000, 26, 899–
908.
33 Y. Wang, B. J. Braams, J. M. Bowman, S. Carter and D. P.
Tew, J. Chem. Phys., 2008, 128, 1–9.
34 S. A. Broadbent, L. A. Burns, C. Chatterjee and P. H.
ARTICLE Faraday Discussions
Please do not adjust margins
35 S. L. Baughcum, R. W. Duerst, W. F. Rowe, Z. Smith and E.
B. Wilson, J. Am. Chem. Soc., 1981, 103, 6296–6303.
36 S. Baughcum, Z. Smith, E. Wilson and R. Duerst, J. Am.
Chem. Soc., 1984, 106, 2260–2265.
37 T. Baba, T. Tanaka, I. Morino, K. M. T. Yamada and K.
Tanaka, J. Chem. Phys., 1999, 110, 4131–4133.
38 T. N. Wassermann, D. Luckhaus, S. Coussan and M. A.
Suhm, Phys. Chem. Chem. Phys., 2006, 8, 2344–2348.
39 N. O. B. Lüttschwager, T. N. Wassermann, S. Coussan and
M. A. Suhm, Phys. Chem. Chem. Phys., 2010, 12, 8201– 8207.
40 N. O. B. Lüttschwager, T. N. Wassermann, S. Coussan and
M. A. Suhm, Mol. Phys., 2013, 111, 2211–2227.
41 C. Duan and D. Luckhaus, Chem. Phys. Lett., 2004, 391,
129–133.
42 T. Chiavassa, P. Verlaque, L. Pizzala, A. Allouche and P.
Roubin, J. Phys. Chem., 1993, 97, 5917–5925.
43 A. Trivella, S. Coussan, T. Chiavassa, P. Theulé, P. Roubin
and C. Manca, Low Temp. Phys., 2006, 32, 1042–1049.
44 R. L. Redington and T. E. Redington, J. Mol. Spectrosc.,
1979, 78, 229–247.
45 P. F. Barbara, P. K. Walsh and L. E. Brus, J. Phys. Chem.,
1989, 93, 29–34.
46 J. N. Woodford, J. Phys. Chem. A, 2007, 111, 8519–8530.
47 E. S. Goudreau, Far-infrared synchrotron-based
spectroscopy of proton tunnelling in malonaldehyde, The