HAL Id: hal-00301629
https://hal.archives-ouvertes.fr/hal-00301629
Submitted on 20 Dec 2004HAL is a multi-disciplinary open access
archive for the deposit and dissemination of sci-entific research documents, whether they are pub-lished or not. The documents may come from teaching and research institutions in France or abroad, or from public or private research centers.
L’archive ouverte pluridisciplinaire HAL, est destinée au dépôt et à la diffusion de documents scientifiques de niveau recherche, publiés ou non, émanant des établissements d’enseignement et de recherche français ou étrangers, des laboratoires publics ou privés.
Retrieval of CO from SCIAMACHY onboard ENVISAT:
detection of strongly polluted areas and seasonal
patterns in global CO abundances
C. Frankenberg, U. Platt, T. Wagner
To cite this version:
C. Frankenberg, U. Platt, T. Wagner. Retrieval of CO from SCIAMACHY onboard ENVISAT: detection of strongly polluted areas and seasonal patterns in global CO abundances. Atmospheric Chemistry and Physics Discussions, European Geosciences Union, 2004, 4 (6), pp.8425-8438. �hal-00301629�
ACPD
4, 8425–8438, 2004 Global CO distribution retrieved by SCIAMACHY C. Frankenberg et al. Title Page Abstract Introduction Conclusions References Tables Figures J I J I Back CloseFull Screen / Esc
Print Version Interactive Discussion
EGU Atmos. Chem. Phys. Discuss., 4, 8425–8438, 2004
www.atmos-chem-phys.org/acpd/4/8425/ SRef-ID: 1680-7375/acpd/2004-4-8425 European Geosciences Union
Atmospheric Chemistry and Physics Discussions
Retrieval of CO from SCIAMACHY
onboard ENVISAT: detection of strongly
polluted areas and seasonal patterns in
global CO abundances
C. Frankenberg, U. Platt, and T. Wagner
Institute of Environmental Physics, Heidelberg, Germany
Received: 2 November 2004 – Accepted: 14 December 2004 – Published: 20 December 2004 Correspondence to: C. Frankenberg (cfranken@iup.uni-heidelberg.de)
ACPD
4, 8425–8438, 2004 Global CO distribution retrieved by SCIAMACHY C. Frankenberg et al. Title Page Abstract Introduction Conclusions References Tables Figures J I J I Back CloseFull Screen / Esc
Print Version Interactive Discussion
EGU
Abstract
SCIAMACHY onboard the European environmental research satellite ENVISAT is an UV/visible/near-infrared spectrometer providing 3 near infrared channels covering wavelengths from 1–1.75 µm, 1.94–2.04 µm and 2.26–2.38 µm with moderate spectral resolution (0.22–1.5 nm). From their structured absorption in these spectral regions,
5
we can quantitatively determine the total column densities of the greenhouse gases CO2, CH4, N2O and H2O as well as of CO. A modified DOAS algorithm based on optimal estimation (IMAP-DOAS) has been developed at the University of Heidelberg to account for the peculiarities of these absorbers. CO is a relatively weak absorber whose spectral signature is overlapped by strong CH4 and H2O absorptions. Hence,
10
retrieval of CO from SCIAMACHY spectra (within 2.26–2.38 µm) is a challenging task. Therefore, the calibration of the raw spectra with respect to dark current issues and nonlinearity were analysed in detail and substantially improved to enable reasonable retrieval of CO. This paper focusses on first results of the CO retrieval where various sources like biomass burning events and their seasonal variability can be clearly
iden-15
tified.
1. Introduction
CO is one of the most important pollutants in the troposphere and although CO itself is not a greenhouse gas, it has an indirect effect on climate as sink for the OH radical, thus leading to longer lifetime of direct greenhouse gases such as CH4 (IPCC,2001).
20
The main sources are presumed to be biomass burning, oxidation of hydrocarbons and methane as well as fossil fuel use (Holloway et al.,2000). It has already been measured by spaceborne instruments, namely by MAPS (Measurement of Air Pollution from Satellite) onboard space shuttles in 1981, 1984, and 1994 (Reichle Jr. et al.,1999) and by the Interferometric Monitor for Greenhouse gases (IMG) onboard ADEOS from
25
ACPD
4, 8425–8438, 2004 Global CO distribution retrieved by SCIAMACHY C. Frankenberg et al. Title Page Abstract Introduction Conclusions References Tables Figures J I J I Back CloseFull Screen / Esc
Print Version Interactive Discussion
EGU since 1999 (Deeter et al.,2003) is still in orbit measuring global CO abundances using
the gas correlation technique in the thermal infrared.
SCIAMACHY is the first instrument that allows retrieval of CO by measuring ab-sorptions in the near infrared, i.e. observing reflected and scattered sunlight instead of thermal emission (Buchwitz et al.,2004). Thus, the integrated concentration of CO
5
along the light path (the slant column density, SCD) can be inferred from the ratio of nadir radiance and solar irradiance spectra using the DOAS method (Platt,1994). The near infrared spectral region has the advantage that there is little scattering within the atmosphere, thus most of the measured photons are directly reflected from the earth’s surface (for cloud-free scenes and sufficiently high surface albedo). Thus, CO
10
measurements by SCIAMACHY are, in contrast to thermal emission sounders, highly sensitive to lower layers of the troposphere where the sources are located and the bulk of the CO SCD is usually found. This is of special importance for the detection of en-hanced CO abundances in the boundary layer, thus particularly of interest for human health issues.
15
2. The SCIAMACHY instrument and data analysis
SCIAMACHY onboard the European Space Agencies environmental research satellite ENVISAT consists of 8 grating spectrometers measuring in the ultraviolet, visible and near infrared wavelength region (240 nm–2380 nm) (Bovensmann et al., 1999). The satellite operates in a near polar, sun-synchronous orbit at an altitude of 800 km and a
20
local equator crossing time at approximately 10:00 a.m. In each orbit, a swath width of 960 km across track with a maximum pixel resolution of 26 km×15 km is covered, thus being a substantial improvement to the large footprint of the predecessor instrument GOME onboard ERS-2. Global coverage is achieved every six days. For the CO retrieval, the typical ground pixel size is 30 km (along track) times 120 km (across track).
25
SCIAMACHY is designed to measure sunlight that is either transmitted, reflected or scattered by the earth’s atmosphere or surface. For this purpose it has 3 viewing
ACPD
4, 8425–8438, 2004 Global CO distribution retrieved by SCIAMACHY C. Frankenberg et al. Title Page Abstract Introduction Conclusions References Tables Figures J I J I Back CloseFull Screen / Esc
Print Version Interactive Discussion
EGU geometries, Nadir, Limb and Occultation. This work focusses only on Nadir spectra
be-cause they yield detailed information on the tropospheric CO abundance. We discuss instrument calibration issues, the development of a new algorithm and results of the CO retrieval.
2.1. Retrieval algorithm
5
In contrast to the UV/Vis spectral region, the near infrared exhibit peculiarities that render classical DOAS algorithms for CO retrieval unsuitable: First, there is a strong sensitivity to temperature and pressure of the strong and narrow absorption lines that are not fully resolved by the spectral resolution of the instrument, thus making the re-trieval nonlinear. Second, the weak CO absorptions are overlapped by strong methane
10
and water vapour lines whose interferences are stronger than the CO absorption itself. Buchwitz et al.(2000) were the first to focus on the near infrared and introduced the concept of weighting function modified (WFM)-DOAS. To account for the general non-linearity of the problem and to avoid interferences between strong absorbers, we devel-oped a new iterative maximum a posteriori DOAS (IMAP-DOAS) (Frankenberg et al.,
15
2004) at the University of Heidelberg. The algorithm is based on optimal estimation theory introduced to the remote sensing community byRodgers(1976). This method directly iterates the vertical column densities of the absorbers of interest until the ex-pected spectral signature of the total optical density fits the measurement. It accounts for nonlinearities due to spectrally non-resolved strong absorptions and considers
sen-20
sitivity to pressure and temperature changes in the atmospheric profile. This algorithm minimises systematic biases that would occur in classical DOAS algorithms. A detailed description of the algorithm can be found inFrankenberg et al.(2004). Other research groups, e.g.Schrijver (2004), also developed modified algorithms for the near infrared spectral region and first results are shown byBuchwitz et al.(2004) andGloudemans
25
et al. (2004).
The CO retrieval turned out not only to be a challenging task from a spectroscopic point of view, but also due to instrumental issues: An ice layer on the near infrared
de-ACPD
4, 8425–8438, 2004 Global CO distribution retrieved by SCIAMACHY C. Frankenberg et al. Title Page Abstract Introduction Conclusions References Tables Figures J I J I Back CloseFull Screen / Esc
Print Version Interactive Discussion
EGU tectors affects dark current and the instrumental function. These are important issues
and have to be analysed and corrected in detail.
2.2. Spectral calibration, dark current and nonlinearity
The near infrared channels exhibit a substantially higher dark current than the UV/Vis channels of SCIAMACHY. In addition to this complication, the leakage current (the
5
time dependent part of the dark current) and the fixed pattern noise are not a smooth function but show strong variations over the entire detector array. Due to the variable ice deposition on the detectors, the dark current and even the slit function show time dependent behaviour (Kleipool,2004). Thus, a simple correction is not possible and the expected operational correction algorithms (Slijkhuis,2001) have not yet solved the
10
problem.
Due to these crucial problems, a reasonable retrieval of CO is not possible without application of sophisticated calibration methods. A first correction scheme has been implemented in the current IMAP-DOAS algorithm using daily readouts of the dark current to correct the raw spectra with the respective pixel exposure times (as initially
15
proposed by the instrument PI, J. Burrows, see technote by Kleipool, 2003a). Fur-thermore, the standard deviations of the daily dark current readouts are used in the algorithm to generate a daily dead/bad pixel mask and for the weighting of the avail-able pixels in the weighted least squares fit according to their dark current stability. Since the dark current can also vary over the orbit (Kleipool,2004), a first order dark
20
current offset correction has been implemented as the fit factor in our algorithm. In ad-dition to these complications, the detector pixels exhibit a nonlinearity (Kleipool,2003b) that has not yet been considered in the operational calibration tools (Slijkhuis,2001). The proposed correction byKleipool(2003b), which treats even and odd detector pix-els separately, has been implemented in our correction scheme. These modifications
25
ACPD
4, 8425–8438, 2004 Global CO distribution retrieved by SCIAMACHY C. Frankenberg et al. Title Page Abstract Introduction Conclusions References Tables Figures J I J I Back CloseFull Screen / Esc
Print Version Interactive Discussion
EGU 2.3. Spectral fitting
For the retrieval of CO, a fit window between 2324 and 2335 nm was chosen. Due to the decline of instrument sensitivity towards larger wavelengths, this has been found to be an optimal fitting window with respect to signal to noise ratio. CO is a relatively weak absorber whose absorption lines are superposed by strong absorptions by CH4
5
and H2O.
The root mean square (RMS) of the (not-weighted) residual of the fit in this wave-length range is typically about 0.9% (see Fig. 2). Considering this residual only as noise in the spectra, an upper limit of the statistical errors (standard deviation) in the CO column is about 3·1017molec/cm2.
10
All outliers in the retrievals are masked by using only fits where the root mean square of the residual is below 1.7% and the statistical error of the CO vertical column density is below 30%. This subset of appropriate retrievals can then be used for the analysis of the global distribution and variations of CO vertical column densities.
2.4. Aims
15
The aim of the CO retrieval is to detect global patterns and variations in the total column abundances of CO. Although the highest mixing ratios are expected in the boundary layer, which is sometimes shielded from satellite observations by clouds, a substantial amount of CO can also be present above the clouds. Thus, all observations have been taken into account for the analysis and cloud-covered pixels have not been masked
20
out.
However, in order to account for clouds and other processes that can artificially di-minish the retrieved total column, global pictures of CO for a certain time period are de-picted as described in the following. Pixels (meeting the criteria described in Sect.2.3) with higher VCD’s are displayed above pixels with lower VCD’s. This procedure unveils
25
the patterns of maximum CO abundances. Since clouds usually diminish the retrieved columns, this method also hides measurements that might be artificially reduced.
Nev-ACPD
4, 8425–8438, 2004 Global CO distribution retrieved by SCIAMACHY C. Frankenberg et al. Title Page Abstract Introduction Conclusions References Tables Figures J I J I Back CloseFull Screen / Esc
Print Version Interactive Discussion
EGU ertheless, in some areas no cloud free conditions might have occurred within the given
time periods, biasing the observed maximum values. Future work will take more so-phisticated cloud algorithms into account, using information on cloud top-height and cloud cover.
3. Results
5
Monthly maps created as described above are a useful method to show the general patterns of CO abundance and their seasonal variations. Figure3 depicts the maxi-mum CO VCD for a whole year divided into bimonthly periods ranging from September 2003 to August 2004. Since most CO sources are located in the northern hemisphere, a clear north-south gradient can be identified. This finding substantiates that even low
10
column abundances can be measured by SCIAMACHY.
Further, large-scale CO enhancements with seasonal variations can also be clearly identified in Africa, South America and Southeast Asia. In March and April, we re-trieved vertical columns in Thailand and India with values of up to 6.5 · 1018molec/cm2. Biomass burning is presumed to mostly contribute to these seasonal patterns of strong
15
enhancements in CO. The seasonal variations of the global distribution of biomass burning events can be well observed by MODIS (Moderate Resolution Imaging Spec-troradiometer) aboard Terra. Figure4shows fire counts made by MODIS from Septem-ber 2003 through February 2004. The areas with high fire frequencies correlate well with high abundances of CO, substantiating the assumption that the CO
enhance-20
ments stem from biomass burning. Also striking are the enhanced CO concentrations in South-America in September/October 2003, coinciding with the typical period of fires in this region. In this context it has to be noted that, particularly in the tropics, oxidation of hydrocarbons can also be a substantial source of CO.
However, there are also patterns of CO enhancements that do not exhibit strong
25
seasonality: The region around Bejing in China shows high CO abundances over the whole time period and can be associated with high industrial activities. These values
ACPD
4, 8425–8438, 2004 Global CO distribution retrieved by SCIAMACHY C. Frankenberg et al. Title Page Abstract Introduction Conclusions References Tables Figures J I J I Back CloseFull Screen / Esc
Print Version Interactive Discussion
EGU also peaked at about 7 · 1018molec/cm2in March/April 2004.
In addition to these seasonal and constant sources, there are CO enhancements due to occasionally occurring fires, such as in Alaska and northern Canada (July/August 2004, forest fires) or Kazakhstan in September and October 2003.
4. Conclusions
5
For the retrieval of CO from SCIAMACHY near infrared spectra, we implemented sev-eral important spectral calibration procedures and applied our newly developed IMAP-DOAS algorithm (Frankenberg et al.,2004) to account for the peculiarities of the near infrared and the CO retrieval in particular. We have demonstrated that SCIAMACHY can perform global measurements of the CO total column density with high sensitivity
10
even to the boundary layer. Although the calibration of the spectra and the slit func-tion posed some serious problems the solufunc-tions to which have yet to be perfected, first results are very encouraging and demonstrate that SCIAMACHY is able to detect CO globally with sufficient accuracy. We observed seasonal variations of biomass burning events as well as enhancements due to anthropogenic activities such as in China.
Fur-15
thermore, we detected sporadic biomass burning events in various regions on earth. Thus, our observations provide important information on tropospheric chemistry issues on a global scale.
More efforts in the calibration of the spectra and a diminishing ice deposition on the detectors will further improve fit quality and retrieval results. Using longer time periods,
20
will enable us to analyse the correlation of industrial activities and biomass burning with CO in more detail.
Acknowledgements. The authors wish to thank all people involved in the SCIAMACHY and
ENVISAT mission, especially ESA/ESTEC, DLR, SRON, KNMI and of course the IUP Bremen team, especially J. P. Burrows without whom SCIAMACHY would not have been possible. We
25
are also very grateful to A. Piters and J. van de Vegte from KNMI for their immense help in handling SCIAMACHY data.
ACPD
4, 8425–8438, 2004 Global CO distribution retrieved by SCIAMACHY C. Frankenberg et al. Title Page Abstract Introduction Conclusions References Tables Figures J I J I Back CloseFull Screen / Esc
Print Version Interactive Discussion
EGU
References
Bovensmann, H., Burrows, J. P., Buchwitz, M., Frerik, J., No ¨el, S., Rozanov, V. V., Chance, K. V., and Goede, A.: SCIAMACHY – mission objectives and measurement modes, J. Atmos. Sci., 56, 127–150, 1999. 8427
Buchwitz, M., Rozanov, V., and Burrows, J.: A near-infrared optimized DOAS method for the
5
fast global retrieval of atmospheric CH4, CO, CO2, H2O, and N2O total column amounts from SCIAMACHY Envisat-1 nadir radiances, J. Geophys. Res., 105, 15 231–15 245, 2000. 8428
Buchwitz, M., Beek, R., Bramstedt, K., No ¨el, S., Bovensmann, H., and Burrows, J.: Global carbon monoxide as retrieved from SCIAMACHY by WFM-DOAS, Atmos. Chem. Phys. Dis-cuss., 4, 2805–2837, 2004,
10
SRef-ID: 1680-7375/acpd/2004-4-2805. 8427,8428
Deeter, M. N., Emmons, L. K., Francis, G. L., Edwards, D. P., Gille, J. C., Warner, J. X., Khat-tatov, B., Ziskin, D., Lamarque, J.-F., Ho, S.-P., Yuding, V., Attie, J.-L., Packman, D., Chen, J., Mao, D., and Drummond, J. R.: Operational carbon monoxide retrieval algorithm and se-lected results for the MOPITT instrument, J. Geophys. Res., 108, 4399–4409, 2003. 8427 15
Frankenberg, C., Platt, U., and Wagner, T.: Iterative maximum a posteriori (IMAP)-DOAS for retrieval of strongly absorbing trace gases: Model studies for CH4 and CO2 retrieval from near infrared spectra of SCIAMACHY onboard ENVISAT, Atmos. Chem. Phys. Discuss., 4, 6067–6106, 2004,
SRef-ID: 1680-7375/acpd/2004-4-6067. 8428,8432 20
Gloudemans, A., Schrijver, H., Straume, A., Aben, I., Maurellis, A., Buchwitz, M., de Beek, R., Frankenberg, C., and Wagner, T.: CH4 and CO total columns from SCIAMACHY: compar-isons with TM3 and MOPITT, in Remote Sensing of Clouds and the Atmosphere VIII, vol. 5235 of Proceedings ACVE2, 3–7 May, Frascati, Italy, 2004. 8428
Holloway, T., II, H. L., and Kasibhatla, P.: Global distribution of carbon monoxide, J. Geophys.
25
Res., 105, 12 123–12 147, 2000. 8426
IPCC: Climate Change 2001: The Scientific Basis, Summary for Policy Makers, IPCC (In-tergovernmental Panel on Climate Change) Third Assessment Report, (available at: http:
//www.ipcc.ch/), 2001. 8426
Kleipool, Q.: Algorithm Specification for Dark Signal Determination, Tech. rep.
SRON-SCIA-30
PhE-RP-009, SRON, 2003a. 8429
ACPD
4, 8425–8438, 2004 Global CO distribution retrieved by SCIAMACHY C. Frankenberg et al. Title Page Abstract Introduction Conclusions References Tables Figures J I J I Back CloseFull Screen / Esc
Print Version Interactive Discussion
EGU be implemented in the data processor, Tech. rep. SRON-SCIA-PhE-RP-013, SRON, 2003b.
8429
Kleipool, Q.: SCIAMACHY: Orbital Variation of dark signal, Tech. rep. SRON-SCIA-PhE-RP-18, SRON, 2004. 8429
Kobayashi, H., Shimota, A., Kondo, K., Okumura, E., Kameda, Y., Shimoda, H., and Ogawa,
5
T.: Development and evaluation of the Interferometric Monitor for Greenhouse Gases: a high throughput Fourier transform infrared radiometer for nadir Earth observations, Appl. Opt., 38, 6801–6807, 1999. 8426
Platt, U.: Differential optical absorption spectroscopy (DOAS), in: Air Monitoring by Spectro-scopic Techniques, John Wiley, New York, 1994. 8427
10
Reichle Jr., H. G., Anderson, B. E., Connors, V. S., Denkins, T. C., Forbes, D. A., Gormsen, B. B., Langenfels, R. L., Neil, D. O., Nolf, S. R., Novelli, P. C., Pougatchev, N. S., Roell, M. M., and Steele, L. P.: Space shuttle based global CO measurements during April and October 15 1994, MAPS instrument, data reduction, and data validation, J. Geophys. Res., 104, 21 443–21 454, 1999. 8426
15
Rodgers, C.: Retrieval of atmospheric temperature and composition from remote measure-ments of thermal radiation, Rev. Geophys. Space Phys., 14, 609–624, 1976. 8428
Schrijver, H.: Retrieval of carbon monoxide, methane and nitrous oxide from SCIAMACHY measurements, in ESA WPP-161 1, vol. 5235 of Proc. ESAMS, European Symposium on Atmospheric Measurements from Space, 285–294, Estec, Nordwijk, The Netherlands, 2004.
20
8428
Slijkhuis, S.: SCIAMACHY Level 0 to 1c Processing Algorithm Theoretical Baseline Document, ATBD: ENV-ATB-DLR-SCIA-0041, DLR, 2001. 8429
ACPD
4, 8425–8438, 2004 Global CO distribution retrieved by SCIAMACHY C. Frankenberg et al. Title Page Abstract Introduction Conclusions References Tables Figures J I J I Back CloseFull Screen / Esc
Print Version Interactive Discussion EGU 2324 2326 2328 2330 2332 2334 -0,5 -0,4 -0,3 -0,2 -0,1 0,0 2324 2326 2328 2330 2332 2334 -0,08 -0,04 0,00 0,04 0,08 -0,12 -0,09 -0,06 -0,03 0,00 0,03 DSOD wavelength [nm] DSOD measured DSOD modelled DSOD CO SOD
Measured DSOD - other species resulting CO fit
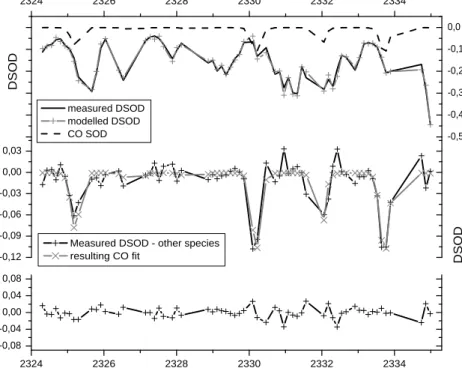
Fig. 1. Example of a CO fit with relatively strong CO absorptions (V CD≈8 · 1018molec/cm2).
The upper panel shows the differential slant optical density (DSOD) of all absorbers (CH4, H2O and CO) as well as that of CO separated (dashed line). The centre panel shows the measured slant optical density with the slant optical density of CH4and H2O subtracted in order to depict only the absorption structures of CO. The lower panel shows the residual of the fit (please note the different scale).
ACPD
4, 8425–8438, 2004 Global CO distribution retrieved by SCIAMACHY C. Frankenberg et al. Title Page Abstract Introduction Conclusions References Tables Figures J I J I Back CloseFull Screen / Esc
Print Version Interactive Discussion EGU 0.4 0.6 0.8 1 1.2 1.4 1.6 1.8 2 2.2 2.4 0 1000 2000 3000 4000 5000 6000 7000 residual rms [%] occurences
Fig. 2. Histogram of the RMS of the fit residual for the CO retrieval in channel 8 during July
ACPD
4, 8425–8438, 2004 Global CO distribution retrieved by SCIAMACHY C. Frankenberg et al. Title Page Abstract Introduction Conclusions References Tables Figures J I J I Back CloseFull Screen / Esc
Print Version Interactive Discussion EGU (a) 09-10/2003 (b) 11-12/2003 (c) 01-02/2004 (d) 03-04/2004 (e) 05-06/2003 (f) 07-08/2004
Fig. 3. Maximum observed CO vertical column density [molec/cm2] in six two-month periods from September
2003 to August 2004. 1·1018molec/cm2correspond roughly to an column-averaged CO mixing ratio of 50ppbv.
Enhancements due to seasonal variations of biomass burning (e.g. in Africa), constant anthropogenic sources (e.g. China) or sporadic fires (e.g Alaska in July/August 2004) can be observed (see text). Although the CO columns are not averaged over the given time periods, the patterns of enhancements appear rather smooth, proving the good fit quality and the absence of outliers. Over certain areas (gray), no suitable measurements are available due to very low surface albedo (e.g. over the ocean) or too high solar zenith angles.
Fig. 3. Maximum observed CO vertical column density [molec/cm2] in six two-month periods
from September 2003 to August 2004. 1 · 1018molec/cm2 correspond roughly to an column-averaged CO mixing ratio of 50 ppbv. Enhancements due to seasonal variations of biomass burning (e.g. in Africa), constant anthropogenic sources (e.g. China) or sporadic fires (e.g. Alaska in July/August 2004) can be observed (see text). Although the CO columns are not averaged over the given time periods, the patterns of enhancements appear rather smooth, proving the good fit quality and the absence of outliers. Over certain areas (gray), no suitable measurements are available due to very low surface albedo (e.g. over the ocean) or too high
ACPD
4, 8425–8438, 2004 Global CO distribution retrieved by SCIAMACHY C. Frankenberg et al. Title Page Abstract Introduction Conclusions References Tables Figures J I J I Back CloseFull Screen / Esc
Print Version Interactive Discussion
EGU
Fig. 4. Bimonthly fire distributions from September 2003 through February 2004. Displayed are fire counts
measured by MODIS aboard Terra. At the time of publication, no newer data than February 2004 was available.
12
Fig. 4. Bimonthly fire distributions from September 2003 through February 2004. Displayed
are fire counts measured by MODIS aboard Terra. At the time of publication, no newer data than February 2004 was available.

![Fig. 3. Maximum observed CO vertical column density [molec/cm 2 ] in six two-month periods from September 2003 to August 2004](https://thumb-eu.123doks.com/thumbv2/123doknet/14702332.565189/14.918.141.566.32.468/maximum-observed-vertical-column-density-periods-september-august.webp)

