Publisher’s version / Version de l'éditeur:
Technical Note (National Research Council of Canada. Division of Building
Research), 1968-03-01
READ THESE TERMS AND CONDITIONS CAREFULLY BEFORE USING THIS WEBSITE.
https://nrc-publications.canada.ca/eng/copyright
Vous avez des questions? Nous pouvons vous aider. Pour communiquer directement avec un auteur, consultez la première page de la revue dans laquelle son article a été publié afin de trouver ses coordonnées. Si vous n’arrivez pas à les repérer, communiquez avec nous à [email protected].
Questions? Contact the NRC Publications Archive team at
[email protected]. If you wish to email the authors directly, please see the first page of the publication for their contact information.
NRC Publications Archive
Archives des publications du CNRC
For the publisher’s version, please access the DOI link below./ Pour consulter la version de l’éditeur, utilisez le lien DOI ci-dessous.
https://doi.org/10.4224/20359037
Access and use of this website and the material on it are subject to the Terms and Conditions set forth at
Canada's Fire Costs
Shorter, G. W.
https://publications-cnrc.canada.ca/fra/droits
L’accès à ce site Web et l’utilisation de son contenu sont assujettis aux conditions présentées dans le site LISEZ CES CONDITIONS ATTENTIVEMENT AVANT D’UTILISER CE SITE WEB.
NRC Publications Record / Notice d'Archives des publications de CNRC:
https://nrc-publications.canada.ca/eng/view/object/?id=19663e9a-8b97-4bd4-a601-838fbb66a558 https://publications-cnrc.canada.ca/fra/voir/objet/?id=19663e9a-8b97-4bd4-a601-838fbb66a558DIVISION OF BUILDING RESEARCH
No.
NATIONAL RESEARCH COUNCIL OF CANADA
518
NOTJE
'IfE
C
JHI
Ii
II
C
AIL
PREPARED BY G. W. Shorter CHECKED BY ApPROVED BY N. B. H. DATE March 1968 PREPARED FOR Inquiry and record purposes
SUBJECT CANADA'S FIRE COSTS
The Dominion Fire Commissioner, with the
co-operation of the Provincial Fire Marshals and Fire Commissioners arid other provincial and federal agencies, publishes each year a report entitled "Fire Losses in Canada. ,,(1) The information in this report provides a general appraisal of the fire problem in Canada. In 1965, the 68, 000 fires which occurred resulted in a property loss of $144 million and 589 fire deaths (Table I). Over the last 10 years the property loss per head and the fire death rate have remained relatively constant.
Examination of fire losses by occupancy (Table II) shows that although 72 per cent of all fires occur in residential properties, losses in this type of occupancy represent only
26 per cent of the total fire losses. On the other hand, the avail-able records on loss of life indicate that 75 per cent of all fire
deaths occur in residential buildings. Manufacturing and mercantile occupancies, which account for only 12 per cent of all fires, result in losses amounting to 46 per c'ent of the total losses.
e,
2
-The three Inost common causes of fire in Canada are those associated with smoking, heating and electrical wiring and appliances (Table III). In spite of extensive promotion of fire prevention measures, careless smoking habits cause
40.5 per cent of all fires.' Although for many years Canada has been active in the field of certification of heating and electrical equipment and standard installation procedures, fires associated, with the use of this type of equipment cause 22.5 per 」セョエ of all fires. The other 37 per cent of fires, which cause 71.3 per cent
of the total loss, result from a wide variety of causes termed miscellaneous or undetermined. In view of these statistics, architects and designers should assume that it is difficult to elimInate all fii-'e hazards and their designs should reflect this assumption.
Canada is generally considered to have an unenviable' fire record. Reliable and uniform statistics on an international basis are lacking, but some information appeared in an article in the NFPA i'FireJournal. ,,(2) Information on relative property losses (Table IV) and on relative loss of life for several countries (Table V) was taken from the above article. Although the accuracy of these figures is questionable, they do show that Canada has a serious fire problem which needs constant attention.
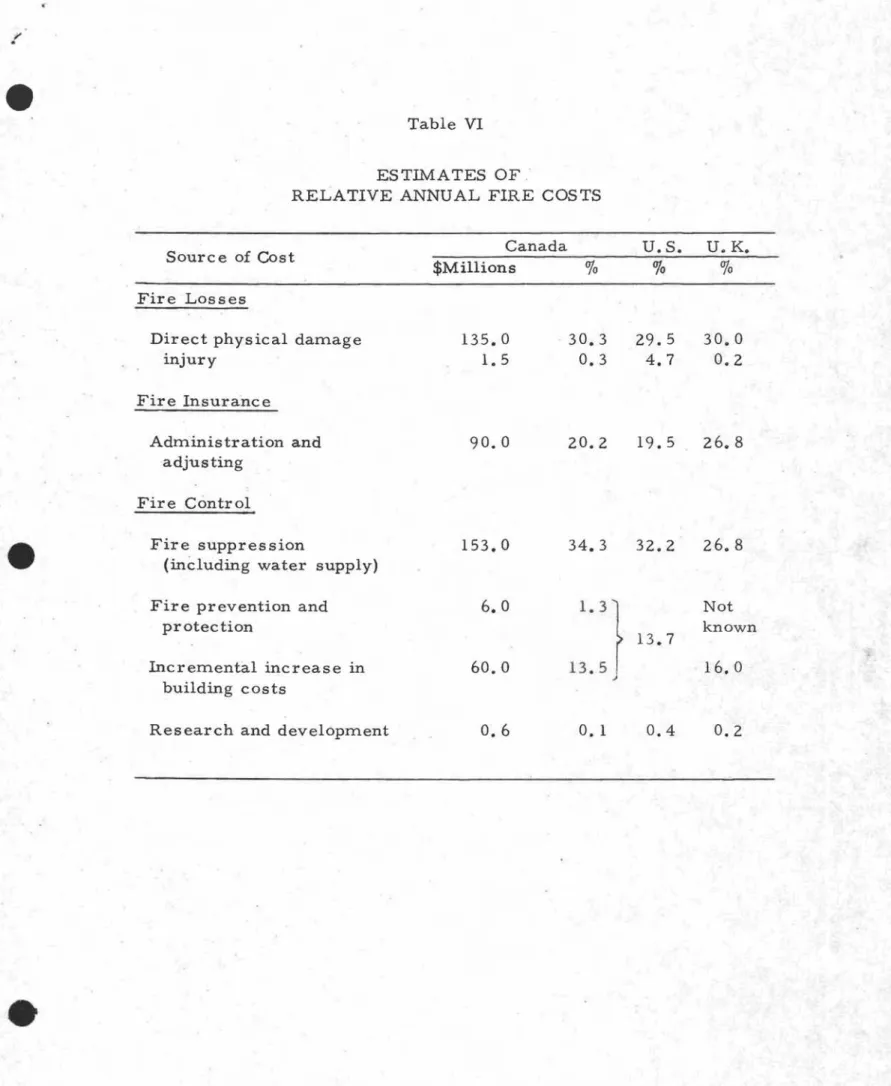
An attempt has been made in Table VI to set forth the relative annual fire costs for the United Kingdom and the United States as well as Canada.
A variety of sources were used by the author to establish the the Canadian figures. U. S. figures were obtaIned from
"A
Study of Fire Probiems" puqlished by National Academy of Sciences (3); U. K. figures were obtained from the "The Cost of Fire" published by Fire, The Journal of the British Fire Services (4).REFERENCES
(1) Report of the Dominion Fire Commissioner, Fire Losses in Canada, 1965, Office of the Dominion Fire Commissioner, Ottawa.
(2)
(3 )
(4)
3
-P. Bugbee. Are We Losing the Battle Against Fire Waste. Fire Journal, 61 (5): p. 5-7. September 1967. A Study of Fire Problems, National Academy of Sciences Pub1. 949, Chapter III, p. 26-51.
J. F. Fry. The Cost of Fire, Fire, The British Fire Servic es, 56 (703): p. 591- 594. April 1964.
Table I
*
PROVINCIAL LOSSES AND FIRE DEATHS
Population Number of fires Loss Per head Fire deaths
**
Fire death rate
1965 19. 6 million 68 thousand $144 million $7.37 589 3.0 10-Year average $7.40 3.2
*
Does not include forest and federal losses.**
Fire death rate is the number of fire deaths per 100, 000 population per annum.Table II
FIRE LOSSES BY OCCUPANCY (lO-Year average 1956-65)
Occupancy Residential properties Institutional and assembly
buildings Farm properties Manufacturing properties Mercantile properties Miscellaneous properties Number of Fires
(Thousands) Per cent 58.6 72 1.1 1 5.8 7 1.6 2 7.8 10 6.0 8 Loss
($ Millions) Per cent 34.3 26 8.2 6 12.2 9 18.5 14 42.0 32 17.4 13
Table III CAUSES OF FIRES (10- Year average 1956-65) Cause Number of Fires (Thousands) Loss
Per cent ($ Millions) Per cent Heating 10.2 12.6 12.6 9.5 Electrical wiring and
appliances 8.0 9.9 16.3 12.2 Smoking 32.4 40.5 9.3 7.0 Miscellaneous 17.5 21. 6 26.4 19. 8 Undetermined 12.8 15.4 68.4 51. 5
Table IV
VARIOUS COUNTRIES RELATIVE PROPERTY LOSS BY FIRE (1964) Country Fire Loss in Miilions of U. S. Dollar s Gross National Product in Billions of U. S. Dollars
Fire Loss Per Billion Dollars of GNP (Millions of Dollars) Canada 136.20 38.5 Denmark 19.48 8.9 France 306.10 87.5 Norway 18.00 6.3 Sweden 30.00 17.5 Switzerland 9.88 12.9 U.K. 215.00 92.2 U.S. 1,652.70 628.7 3.54 2.19 3.50 2.86 1. 71 0.77 2.33 2.63
Table V
VARIOUS COUNTRIES RELA TIVE LOSS OF LIFE
BY FIRE (1964)
Country Fire Death Rate* Australia 1. 74 Belgiwn 0.87 Canada 3. lO France 0.45 Japan 0.97 Sweden 0.94 U. K. 1.97 U. S. 6.20
*
Fire death rate is the number of fire deaths per lOO. 000 population per annum.Table VI ESTIMATES OF'
RELATIVE ANNUAL FIRE COSTS
Source of Cost Fire Losses
Canada $Millions
0/0
u.
S. U. K.Direct physical damage injury Fire Insurance Administration and adjusting Fire Control Fire suppression
(inCluding water supply)
135.0 1.5 90.0 153.0 30.3 0.3 20.2 34.3 29.5 4.7 19.5 32.2 30.0 0.2 26.8 26.8
Fire prevention .and protection Incremental increase in building costs 6.0 60.0