Publisher’s version / Version de l'éditeur:
Vous avez des questions? Nous pouvons vous aider. Pour communiquer directement avec un auteur, consultez la
première page de la revue dans laquelle son article a été publié afin de trouver ses coordonnées. Si vous n’arrivez pas à les repérer, communiquez avec nous à [email protected].
Questions? Contact the NRC Publications Archive team at
[email protected]. If you wish to email the authors directly, please see the first page of the publication for their contact information.
https://publications-cnrc.canada.ca/fra/droits
L’accès à ce site Web et l’utilisation de son contenu sont assujettis aux conditions présentées dans le site LISEZ CES CONDITIONS ATTENTIVEMENT AVANT D’UTILISER CE SITE WEB.
Design for Teaching and Learning in a Networked World: 10th European
Conference on Technology Enhanced Learning, EC-TEL 2015, Toledo, Spain,
September 15-18, 2015, Proceedings, Lecture Notes in Computer Science; no.
9307, pp. 56-69, 2015-09-18
READ THESE TERMS AND CONDITIONS CAREFULLY BEFORE USING THIS WEBSITE. https://nrc-publications.canada.ca/eng/copyright
NRC Publications Archive Record / Notice des Archives des publications du CNRC :
https://nrc-publications.canada.ca/eng/view/object/?id=fc3eabce-eff5-482b-b930-b88bd5393f44
https://publications-cnrc.canada.ca/fra/voir/objet/?id=fc3eabce-eff5-482b-b930-b88bd5393f44
NRC Publications Archive
Archives des publications du CNRC
For the publisher’s version, please access the DOI link below./ Pour consulter la version de l’éditeur, utilisez le lien DOI ci-dessous.
https://doi.org/10.1007/978-3-319-24258-3_5
Access and use of this website and the material on it are subject to the Terms and Conditions set forth at
Evaluation of expert-based Q-Matrices predictive quality in matrix
factorization models
quality in matrix factorization models
Guillaume Durand, Nabil Belacel, and Cyril Goutte National Research Council Canada,
Information and Communications Technologies, Canada {guillaume.durand,nabil.belacel,cyril.goutte}@nrc-cnrc.gc.ca
http://www.nrc-cnrc.gc.ca/index.html
Abstract. Matrix factorization techniques are widely used to build col-laborative filtering recommender systems. These recommenders aim at discovering latent variables or attributes that are supposed to explain and ultimately predict the interest of users. In cognitive modeling, skills and competencies are considered as key latent attributes to understand and assess student learning. For this purpose, Tatsuoka introduced the con-cept of Q-matrix to represent the mapping between skills and test items. In this paper we evaluate how predictive expert-created Q-matrices can be when used as a decomposition factor in a matrix factorization rec-ommender. To this end, we developed an evaluation method using cross validation and the weighted least squares algorithm that measures the predictive accuracy of matrices. Results show that expert-made Q-matrices can be reasonably accurate at predicting users success in specific circumstances that are discussed at the end of this paper.
Keywords: Cognitive models, Matrix factorization, Recommender systems, Com-petency-based learning
1
Introduction
Nowadays, recommender systems are extensively used. Technologies, usage and application domains including learning and education keep going further, bigger and wider. Recommenders are usually classified into two categories [14] depend-ing on the approach they implement; content filterdepend-ing or collaborative filter-ing. Content filtering requires the creation of user profiles to provide them with matching products. A lot of domain specific information is required. Collabora-tive filtering overcomes this difficulty by providing recommendations based on past actions of the users, finding similarities between them and extrapolating to future behaviors. Among collaborative filtering methods, latent factor mod-els are probably the most well known since they were popularized during the Netflix Prize. A latent factor model aims at discovering latent traits character-izing both users and their resources usage, in order to make predictions. Matrix factorization is a common technology used to perform latent traits modeling.
A matrix factorization approximates a matrix R by the product of two smaller matrices Q and S, i.e., R ≈ QS = ˆR. The link between latent traits modeling and cognitive diagnostic modeling, appeared obvious to many [10, 23, 24] since skills or competencies are latent attributes allowing to understand, assess [25, 5, 23] and to some extent predict [22, 16, 24, 15] student success. The overlap between cognitive diagnostic modeling goes even further since matrix represen-tations have been used for decades with Tatsuoka’s [25] Rule-Space model and the introduction of the Q-matrix, a matrix representing the mapping between test items and skills. In this context, a matrix factorization recommender would predict the success or failure on unperformed items. Starting from a matrix R containing the results of students to items, a basic matrix factorization would produce a Q-matrix mapping test items to latent skills, and a matrix S contain-ing the mappcontain-ing between students and skills. Many researchers have recently tried to automatically generate [24, 23] or improve [10, 4] Q-matrices using ma-trix factorization methods. While the quality of the reconstruction of R is duly measured by comparing R to ˆR, the quality of the generated Q-matrix is difficult to evaluate. For instance, it is not unusual to generate a Q-matrix leading to a perfect R reconstruction but as good as chance in terms of predictive accuracy. In order to address this problem, we propose the method presented below (sec-tion 3), that aims at specifically evaluating the predictive quality of a Q-matrix. We applied this method to several expert-made datasets (section 4) and present our experimental results in section 5.
2
Q-matrix and matrix factorization
The Rule-Space model [25, 28, 29] was introduced in the eighties to statistically classify students items responses into a set of ideal response patterns associated to different cognitive skills. One of the major assumptions of Rule-Space is that students only need to master specific skills in order to successfully complete test items. Rule-Space aims at performing fine granularity diagnostic assessments. In its first phase, Rule-Space consists in identifying skills called attributes to create ideal response patterns. A second phase relies on statistical classification using item response analysis to map student answers to ideal response patterns. There were initially no real process specified by Rule-Space to design and develop the cognitive diagnostic assessments required by its first phase. However, Gierl et al. [11] in their tutorial proposed four sequential steps. In the first step, the (k) cognitive attributes are identified and their hierarchical relationships specified by cognitive experts. In a second step, an incidence matrix is built by considering the potential pool of items [3] representing all (2k− 1) combinations of attributes an
item could evaluate. The incidence matrix also called Q-matrix is then reduced according to the attribute hierarchy. As reduction example, let’s consider the skill ”addition of natural numbers” as a prerequisite to the skill ”addition of integers”. If an item in the Q-matrix is designed to evaluate only ”addition of integers”, this item would be removed in the refinement process because it is deemed impossible to evaluate ”addition of integers” without evaluating ”addition of
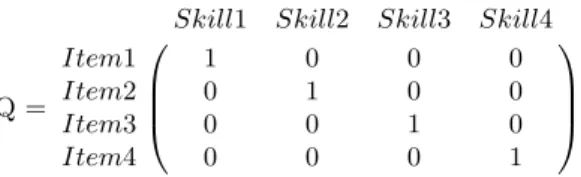
natural numbers”. The third step consists in constructing the test items based on the reduced Q-matrix. Finally, in the fourth step, ideal item response vectors are created based on the reduced Q-matrix (Fig. 1). These ideal item response vectors are then used in the statistical pattern classification of student responses; the second phase of Rule-Space.
Q =
Skill1 Skill2 Skill3 Skill4
Item1 1 0 0 0 Item2 0 1 0 0 Item3 0 0 1 0 Item4 0 0 0 1
Fig. 1: Example of a reduced Q-matrix with one skill per item.
To some extent, Q-matrix extraction could be seen as a Rule-Space reverse engineering exercise. The objective is to discover the Q-matrix from real response patterns having most of the time no information regarding the ideal response pattern and a very limited knowledge of the possible skills involved in the items. The analysis starts from the result matrix R and approximates it as a product of Q-matrix and student matrix S:
R≈ Q × S. (1)
The estimates of Q and S minimize the reconstruction error k ˆR− R k between R and its estimate ˆR = Q × S. As explained by Desmarais and Naceur [10] this factorization correspond to a specific interpretation of the Q-matrix called compensatory. A compensatory Q-matrix assumes that each skill adds to the item success. Other interpretations include the conjunctive Q-matrix, which assumes that all skills in an item row are necessary for success, and the disjunctive Q-matrix, which assumes that knowledge of any skill in the row yields success. The conjunctive Q-matrix is widely used [10, 1], and as noted by Desmarais et al. [9], it may be solved by applying the standard factorization to the Boolean negation of the result matrix qR as:
qR≈ Q×qS (2)
The matrix factorization framework can therefore be applied to model conjunc-tive as well as compensatory Q-matrices making our method for evaluating and validating a Q-matrix relevant over a wider range of assumptions.
3
Q-matrix evaluation method and validation
The evaluation considers both conjunctive and compensatory factorization mod-els (Eqs. 1–2). Assuming R (or qR) and Q known, we evaluate how well Q would
Algorithm 1: Q-matrix cross validation evaluation algorithm. Data:
R: Result Matrix Q: Q-matrix to evaluate
N: Number of cross validation folds
Result: Performance: The estimator Root Mean Square Error P erf ormance ←− 0
M ask ←−Mask of size R randomly populated by integers 1..N forM aski∈M ask do
W eight ←− matrix of size R populated by 1 W eight(M ask == i) ←− 0
S ←−wsolve(R, Q, W eight) ˆ
R ←− Q × S
P erf ormance ←− P erf ormance + perf ormance(R, ˆR, 1 − W eight) P erf ormance ←− P erf ormance/N
predict missing values through a classical 10-fold cross validation algorithm de-tailed in algorithm 1.
To obtain S we defined the function wsolve that uses a least squares method provided by the function Matlab mldivide (S = Q \ R) that solves the system or linear equations Q × x = R. The function wsolve extends the function mldivide by taking into account a weight matrix that is a boolean matrix of the size of R having 0 where missing values are injected by the cross validation masks (M aski). Wsolve is an implementation of the weighted least squares method1.
Instead of using directly the W eight matrix, we calculate w = √W eight and solve column by column k the system (wk.× Q) × sk = (wk.× rk) with mldivide.
Thus equations containing missing values are not used in the solving of the system.
Matlab offers many alternatives to weighted least squares like using the func-tion fminsearch [30] implementing the Nelder-Mead optimizafunc-tion method over a cost function. The Nelder-Mead [18] algorithm is based on the simplex method for finding a local minimum. Using Nelder-Mead proved to be particularly inef-ficient in our case because of the slow convergence rate. An improvement over the simplex approach would have been to consider a simple or a conjugate gradi-ent algorithm. However, gradigradi-ents approach would not have been as fast as our analytic approach. Most results detailed in the following sections were obtained almost instantly on an average office laptop.
To validate our evaluation method, we used simulated data by defining a Q-matrix as shown in figure 2 and a matrix S detailing learners abilities.
The student matrix S encodes the skills that each student has acquired. Students may have acquired anything between 0 and K of these skills, so the mapping is always ”1-N” (with N possibly 0).
1
Weighted least squares method: http://en.wikipedia.org/wiki/Least_squares# Weighted_least_squares
Q =
Skill1 Skill2 Skill3 Skill4
Item1 1 0 0 0 Item2 0 1 0 0 Item3 0 0 1 0 Item4 0 0 0 1 Item5 1 1 0 0 Item6 1 0 1 0 Item7 0 1 1 0 Item8 1 1 1 0 Item9 1 0 0 1 Item10 0 1 0 1 Item11 1 1 0 1 Item12 0 0 1 1 Item13 1 0 1 1 Item14 0 1 1 1 Item15 1 1 1 1
Fig. 2: Q-matrix containing all the possible items (24− 1) with 4 skills.
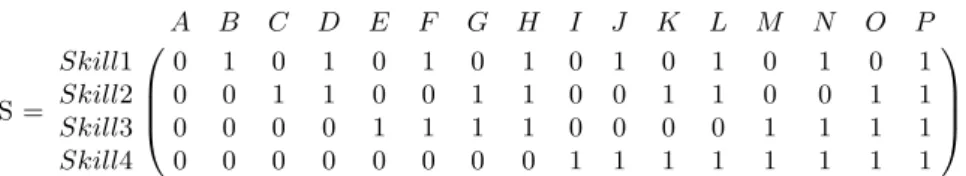
Assuming binary values, the simplest student matrix encoding all combina-tions of skills is presented in figure 3.
S = A B C D E F G H I J K L M N O P Skill1 0 1 0 1 0 1 0 1 0 1 0 1 0 1 0 1 Skill2 0 0 1 1 0 0 1 1 0 0 1 1 0 0 1 1 Skill3 0 0 0 0 1 1 1 1 0 0 0 0 1 1 1 1 Skill4 0 0 0 0 0 0 0 0 1 1 1 1 1 1 1 1
Fig. 3: Student matrix with all the possible student-skills mapping.
There are several ways of combining the information in the Q-matrix and student matrix, depending on how we combine the item line in Q and the student column in S:
1. Conjunctive: The student needs to have all the skills in the item to succeed. 2. Compensatory: The more required skills the student has, the more likely she
is to succeed.
3. Disjunctive: The student succeeds if he has any of the skills necessary for the item. However, ”disjunctive models are closely related to compensatory mod-els, in which lacking certain attributes can be compensated for by possessing other attributes”[7].
While disjunctive approaches didn’t appear relevant to us since we didn’t find in the literature examples of disjunctive Q-matrix generations and because
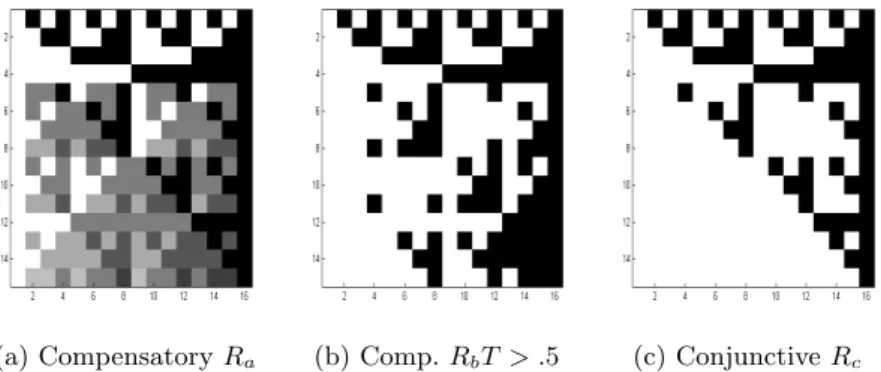
of its link with the compensatory case, we limited the validation of the evalu-ation method to the compensatory and conjunctive approaches creating the R matrices illustrated by figure 4. The compensatory matrix Ra has non-binary
(a) Compensatory Ra (b) Comp. RbT > .5 (c) Conjunctive Rc
Fig. 4: Graphical representation of the result matrices. From white to black, values in the cells go from 0 to 1.
values and cells contain the probability of success. This matrix was calculated so that a student mastering one skill out of the two required is predicted to have 50% chances of success. As R matrices in cognitive modeling are usually binary matrices, matrix Rb has been obtained by applying a threshold of .5 on
Ra, converting values above this threshold to one and inferior values to 0.
Table 1: Average RMSE as computed by the evaluation method.
Data set Ra Rb Rc
RMSE (Compensatory) .2838 .3400 .4563 RMSE (Conjunctive) .2838 .5218 .1055
We ran the evaluation algorithm one hundred time and obtained the aver-aged results in table 1. While ˆRa was not rounded prior to calculate the RMSE
(Root Mean Square Error), we calculated an optimal threshold and rounded ˆRb
and ˆRc to calculate each fold RMSE. In the case of Ra, both conjunctive and
compensatory models provide results of similar quality making difficult to dis-criminate from a conjunctive or a compensatory matrix. Compared to Rb, errors
obtained by Ra on the compensatory model suggests that the calculus of the
optimum threshold tends to increase the error. Finally, errors obtained by Rb
and Rc show a big difference in the predictive quality between compensatory
to discriminate properly between conjunctive and compensatory matrices in this simulated dataset. This is particularly significant in the case of the conjunctive matrix Rcthat provides almost perfect predictions in a conjunctive factorization.
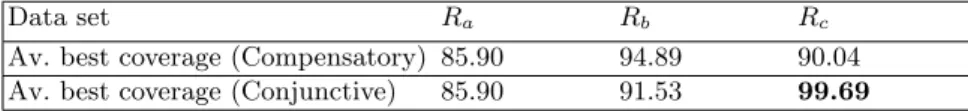
Table 2: R reconstruction coverage measure in percentages.
Data set Ra Rb Rc
Av. best coverage (Compensatory) 85.90 94.89 90.04 Av. best coverage (Conjunctive) 85.90 91.53 99.69
In table 2 we calculate the percentage of similarity between each cells of R and ˆ
R. Usage of weighted least square computations algorithm leads almost every-time to a perfect retrieval of Rc with the conjunctive model. Compared to the
RMSE calculation, coverage does not only measure the accuracy of predicting the missing values. It is also a measure of the model stability since non missing values can differ in ˆR. Conjunctive matrix recovery is particularly stable with the conjunctive model.
4
Datasets
We considered four different datasets in our study. Some of them are available through the Cognitive Diagnosis Modeling (CDM)2package freely available with
the statistical toolkit R. The selection process was guided by our will to experi-ment on real datasets with Q-matrices designed by cognitive modeling experts. Therefore we discarded from our selection process datasets with questionable Q-matrices origin and simulated sets. Each dataset is composed of a result matrix containing performances of the students to the same set or items and a Q-matrix associated the same set of items to a list of skills. There is no missing data either on the R or Q matrices and both of them in each set are binary matrices.
The first dataset is a very well known cognitive model designed by Tatsuoka [26, 27] involving 2144 middle school students answering 20 items (see table 3) on fraction algebra. Eight skills were identified to answer correctly those items as follow [7]:
1. Convert a whole number to a fraction, 2. Separate a whole number from a fraction, 3. Simplify before subtracting,
4. Find a common denominator, 5. Borrow from whole number part,
6. Column borrow to subtract the second numerator from the first, 7. Subtract numerators,
2
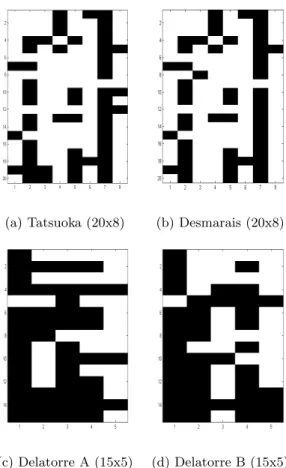
(a) Tatsuoka (20x8) (b) Desmarais (20x8)
(c) Delatorre A (15x5) (d) Delatorre B (15x5)
Fig. 5: Graphical representation of the Q-matrices used in our evaluation. Black cells are populated in the Q-matrix by ones while white cells are associated with zeros.
8. Reduce answers to simplest form.
As all the required skills need to be present to answer properly each item, this dataset is intrinsically conjunctive [10]. The next datasets are all related to this first one.
The second dataset proposed an ”improved” version of initial Tatsuoka’s Q-matrix. This refined Q-matrix was automatically discovered by a matrix fac-torization method proposed by Desmarais and Naceur [10]. This new Q-matrix contains the same number of skills but the mapping of skills 3 (Simplify before subtracting) and 8 (Reduce answer to simplest form) is slightly different as illus-trated by figure 5b. Though this Q-matrix was not fully generated by an expert, it was evaluated and compared to the original Q-matrix on a previous paper [10] making it a good candidate to validate or not our method.
Table 3: Items of Tatsuoka’s Fraction Subtraction dataset [8]. 1. 5 3− 3 4 2. 3 4− 3 8 3. 5 6− 1 9 4. 3 ×1 2 −2 × 3 2 5. 4 ×3 5 −3 × 4 10 6. 6 7− 4 7 7. 3 − 2 ×1 5 8. 2 3− 2 3 9. 3 ×7 8 −2 10. 4 × 4 12−2 × 7 12 11. 4 ×1 3−2 × 4 3 12. 1 ×1 8− 1 8 13. 3 ×3 8−2 × 5 6 14. 3 ×4 5−3 × 2 5 15. 2 −1 3 16. 4 ×5 7−1 × 4 7 17. 7 ×3 5− 4 5 18. 4 × 1 10−2 × 8 10 19. 4 − 1 ×4 3 20. 4 ×1 3−1 × 5 3
De la Torre [6, 5] used as well two datasets derived from the initial Tatsuoka’s 536 students by 20 items dataset. This time, the R matrix was modified as a subset of 536 students by 15 items and two smaller Q-matrices (A and B) containing only 5 skills were introduced. The 15 items was composed of items 2, 4, 6, 7, 9, 10, 11, 12, 14, 15, 16, 17, 18, 19 and 20 following the numbering of table 3.
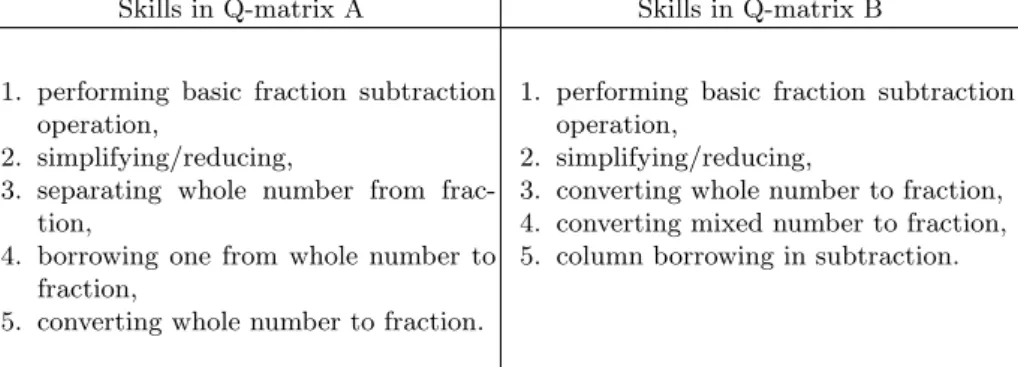
Each Q-matrices A and B were designed according to a specific solving strate-gies [17, 6].
Table 4: Skills of Q-matrices A and B.
Skills in Q-matrix A Skills in Q-matrix B
1. performing basic fraction subtraction operation,
2. simplifying/reducing,
3. separating whole number from frac-tion,
4. borrowing one from whole number to fraction,
5. converting whole number to fraction.
1. performing basic fraction subtraction operation,
2. simplifying/reducing,
3. converting whole number to fraction, 4. converting mixed number to fraction, 5. column borrowing in subtraction.
5
Experimental results
The evaluation algorithm was executed one hundred times on all the datasets and the average RMSE as well as the Mean Absolute Error (MAE) were calculated on normalized ˆR. The normalization consisted in converting to 0 negative values and values above one to one prior to calculate the error at each iteration of the cross validation.
Table 5: Results obtained by the Q-matrix evaluation method on expert-made Q-matrices.
Dataset (a) Tatsuoka (b) Desmarais (c) Delatorre A (d) Delatorre B RMSE (Compensatory) .4270 .4064 .4251 .4911
RMSE (Conjunctive) .4051 .3810 .3969 .4374 MAE (Compensatory) .2737 .2537 .2633 .3417 MAE (Conjunctive) .2531 .2353 .2321 .2893
Results obtained (see table 5) shows better results with conjunctive factor-ization model for all of the datasets. The cognitive models tested were designed to be conjunctive and the evaluation method was able to discriminate properly. The second result is regarding the automatically improved Q-matrix (b) that proves to be significantly more predictive with our method than the original Q-matrix (a) both with the compensatory and the conjunctive models. The results for matrix b obtained with our 10-fold non-stratified cross validation tend to support the results Desmarais and Naceur [10] obtained with their item strat-ified method. They calculated the MAE for the Tatsuoka’s dataset with the original Q-matrix (a) (M AEconj.≈ .175, MAEcomp.≈ .190) and their improved
Q-matrix (b) (M AEconj.≈ .155, MAEcomp.≈ .155)) and obtained lower errors
but leading to the same conclusion.
Q-matrices (c) results are comparable to results obtained by Q-matrix (b) and slightly better than Q-matrix (a). This might advocate for a predominant strategy A over the alternative strategy B since Q-matrix (d) results are not as good as the previous ones. The cognitive strategies involved in the solving of the items and implemented in Q-matrices (c) and (d) might not be split in such exclusive way. It would be interesting to validate this assumption by attempting to split R by student strategies and reevaluate how Q-matrices (c) and (d) would perform.
The evaluation of simulated data has shown that the proposed method was almost perfect in the full conjunctive. With real data we can see that the error measured is more important. We assume that the difference observed is basically coming from several factors. The first factor is the Q-matrix quality and definitely the purpose of our work. Depending on the solving strategies identified by the
expert, different Q-matrices can be proposed and their goodness of fit is variable as shown in the obtained results.
The second factor comes from the nature of education that may differ from other matrix factorization application domains. One major assumption of Rule-Space, we mentioned at the beginning of this paper, is that items should require only the students mastery of specific skills to be successfully completed. However, in practice students not having the skills can also succeed (by guessing the answer) and student having the required skills may also fail (slip into an error). As the linear model induced by matrix factorization is deterministic, it does not take into account those parameters contrary to other probabilistic cognitive diagnostic models like DINA [12]. Q-matrices (c) and (d) were studied in [6] with DINA, a model having guess and slip parameters, but the authors were interested in the capacity of DINA to fit the dataset. Intuitively, one would expect that Q-matrices misconceptions should produce a smaller residual error that would be compensated by the probabilistic parameters (guess and slip parameters for DINA) making difficult to discriminate the influence of the Q-matrix compared to the estimated parameters in the model goodness of fit. Adding parameters to a predictive model make the evaluation of the Q-matrix more difficult since the expert misconceptions can be more easily compensated. Some researchers were able to observe and study more in detail this phenomenon.
6
Related Work
Rupp and Templin [20] evaluated the impact of ill-defined Q-matrices on the DINA [12] model using a simulation dataset. Considering 4 attributes, and sub-sequently 15 items, they generated 10000 respondents answer using a normal distribution of skill patterns. They defined Q-Matrix misspecification conditions by eliminating blocks of items (adding or removing skills for specific items) and representing incorrect dependency relationships (adding or removing skills when specific skills are present or missing). Under the effect of misconceptions, and depending on the category of misconceptions, the estimated guess and slip val-ues became larger than the initial ones while the respondent misclassifications (learner skillset wrongly inferred) correlational measures (Kappa, Lambda, etc.) didnt necessary lead to significantly different results from the calculated value using the original Q-matrix.
Jimmy de la Torre [4] proposed an empirical method to validate a Q-matrix for DINA [12] as well. De la Torre observed from his δ-method and like Rupp and Tremplin [20] that small guess and slip parameters are sufficient but not neces-sary conditions to establish model-data fit. Therefore, he defined an optimization function that maximizes the difference of probabilities of correct response be-tween examinees who have all the required attributes and those who do not. This difference of probability characterizes a discrimination index called δ that changes according to the item q-vector. A bigger δ would characterize a bet-ter q-vector and ultimately a betbet-ter Q-matrix. De la Torre method proved to be successful at discriminating both simulated and real q-vectors. However the
δ-method requires as input estimates of the guess and slip parameters that are variables from one item to the other.
Desmarais and Naceur [10] proposed a stratified cross validation mechanism to evaluate and compare improvement in Q-matrices in a matrix factorization model as presented in this paper. Instead of randomly injecting missing values as proposed in our evaluation method they calculated in turn expected results to each item given the outcomes obtained on the 19 others (fig. 5a). For each iteration, S is calculated based on a 19 items Q-matrix. Then ˆRis computed with the full Q-matrix and missing values in ˆR compared to R are replaced by the ”geometric mean of the average item difficulty and the examinee ability over the 19 given items”. Therefore the error calculated add or withdraw to the Q-matrix goodness of fit the error coming from the heuristic to replace the missing values in ˆR. The error calculated may rather measure the heuristic than the Q-matrix goodness of fit in case where a lot of missing data would occur for the tested item.
7
Conclusion
We proposed in this paper to evaluate the predictive quality of expert-created Q-matrices in the context of matrix factorization recommender systems. The presented method has proven to be an efficient way to evaluate the predictive quality of conjunctive cognitive models. On the validation datasets, the model was able to fit the data in the case of a conjunctive R-matrix associated to the conjunctive factorization and experimental results supported results obtained by prior research studies [10]. As mentioned [2], matrix factorization models lead to prediction errors that are comparable to other cognitive diagnostic models. We were able to evaluate Tatsuoka’s original dataset (a) with the item response theory model used by PSLC Datashop [13] and obtained for an unstratified 10-fold cross validation an rmse of 0.3751. The weighted least squares algorithm handles missing values without replacing them. This feature is particularly inter-esting for incomplete dataset. PSLC Datashop [13] offers numerous dataset with missing data and we were capable with very limited modifications to apply our method and to compare our results with the results obtained by the platform. Considering the dataset DS 605 [19, 21] and the Q-matrices (aka Knowledge Component Models in Datashop) ”KTracedSkills” and ”Rules” we obtained an rmse of 0.3471 (compensatory) and 0.3249 (conjunctive) for ”KTracedSkills” and 0.2675 (compensatory) and 0.2183 (conjunctive) for ”Rules”. Results obtained are consistent with the unstratified cross validation rmse of 0.304451 (”KTraced-Skill”) and 0.186956 (”Rules”) computed by Datashop. Those results comfort the potential of the proposed method to be used in practical cases where learn-ers do not perform the same items, or progress at different paces. In this case, uncompleted items should not necessarily prevent the Q-matrix to be tested and iteratively improved in parallel with the testing activity. Beyond the exercise of evaluating expert-based Q-matrices, this evaluation method could allow practi-tioners to quickly evaluate cognitive models they design without requiring more
sophisticated cognitive diagnostic models using multiple parameters and their sometimes heavy associated knowledge. This could prove to be particularly use-ful in technology enhanced learning environment to design competency-based learning functionalities that may be more accurate.
Acknowledgments. This work is part of the National Research Council Canada program Learning and Performance Support Systems (LPSS), which addresses training, development and performance support in all industry sectors, including education, oil and gas, policing, military and medical devices.
References
1. T. Barnes. The Q-matrix method: Mining student response data for knowledge. In AAAI Educational Data Mining workshop, page 39, 2005.
2. B. Beheshti and M. C. Desmarais. Predictive performance of prevailing approaches to skills assessment techniques: Insights from real vs. synthetic data sets. 2014. 3. M. Birenbaum, A. E. Kelly, and K. K. Tatsuoka. Diagnosing Knowledge States in
Algebra Using the Rule Space Model. Educational Testing Service Princeton, NJ: ETS research report. Educational Testing Service, 1992.
4. J. de la Torre. An empirically based method of q-matrix validation for the dina model: Development and applications. Journal of Educational Measurement, 45(4):343–362, 2008.
5. J. de la Torre. DINA model and parameter estimation: A didactic. Journal of
Educational and Behavioral Statistics, 34(1):115–130, March 2009.
6. J. de la Torre and J. Douglas. Model evaluation and multiple strategies in cognitive diagnosis: An analysis of fraction subtraction data. Psychometrika, 73(4):595–624, 2008.
7. J. de la Torre and J. A. Douglas. Higher-order latent trait models for cognitive diagnosis. Psychometrika, 69(3):333–353, 2004.
8. L. T. DeCarlo. On the analysis of fraction subtraction data: The DINA model, clas-sification, latent class sizes, and the Q-matrix. Applied Psychological Measurement, 35(1):8–26, 2011.
9. M.C. Desmarais, B. Beheshti, and R. Naceur. Item to skills mapping: Deriving a conjunctive Q-matrix from data. In Stefano A. Cerri, William J. Clancey, Giorgos Papadourakis, and Kitty Panourgia, editors, Intelligent Tutoring Systems, volume 7315 of Lecture Notes in Computer Science, pages 454–463. Springer Berlin Hei-delberg, 2012.
10. M.C. Desmarais and R. Naceur. A matrix factorization method for mapping items to skills and for enhancing expert-based Q-matrices. In H. C. Lane, K. Yacef, J. Mostow, and P. Pavlik, editors, Artificial Intelligence in Education, volume 7926 of Lecture Notes in Computer Science, pages 441–450. Springer Berlin Heidelberg, 2013.
11. M. J. Gierl, J. P. Leighton, and S. M. Hunka. Exploring the logic of Tatsuoka’s rule-space model for test development and analysis. Educational Measurement:
Issues and Practice, 19(3):34–44, 2000.
12. B. W. Junker and K. Sijtsma. Cognitive assessment models with few assumptions, and connections with nonparametric item response theory. Applied Psychological
13. K.R. Koedinger, R.S.J.d. Baker, K. Cunningham, A. Skogsholm, B. Leber, and J. Stamper. A data repository for the EDM community: The PSLC Datashop. In C. Romero, S. Ventura, M. Pechenizkiy, and R.S.J.d. Baker, editors, Handbook of
Educational Data Mining. CRC Press, 2010.
14. Y. Koren, R. Bell, and C. Volinsky. Matrix factorization techniques for recom-mender systems. Computer, 42(8):30–37, August 2009.
15. A.S. Lan, C. Studer, and R.G. Baraniuk. Quantized matrix completion for per-sonalized learning. In 7th Intl. Conf. on Educational Data Mining, pages 280–283, 2014.
16. J. Liu, G. Xu, and Z. Ying. Data-driven learning of Q-matrix. Applied Psychological
Measurement, 36(7):548–564, 2012.
17. R. J. Mislevy. Test theory reconceived. Journal of Educational Measurement, 33(4):379–416, 1996.
18. J. A. Nelder and R. Mead. A simplex method for functional minimization.
Com-puter Journal, 7:308–313, 1965.
19. S. Ritter, J.R. Anderson, K.R. Koedinger, and A. Corbett. Cognitive tutor: Applied research in mathematics education. Psychonomic Bulletin & Review, 14(2):249– 255, 2007.
20. A. A. Rupp and J. Templin. The effects of q-matrix misspecification on parameter estimates and classification accuracy in the dina model. Educational and
Psycho-logical Measurement, 68(1):78–96, 2008.
21. J. Stamper and S. Ritter. Cog model discovery exper-iment fall 2011. dataset 605 in datashop. retrieved from https://pslcdatashop.web.cmu.edu/datasetinfo?datasetid=605. 2013.
22. J. C. Stamper and K. R. Koedinger. Human-machine student model discovery and improvement using DataShop. In Artificial Intelligence in Education, pages 353–360. Springer Berlin Heidelberg, 2011.
23. Y.-L. Su, K. M. Choi, W.-C. Lee, T. Choi, and M. McAninch. Hierarchical cognitive diagnostic analysis for TIMSS] 2003 mathematics. Technical Report 35, Center for Advanced Studies in Measurement and Assessment (CASMA), University of Iowa, 2013.
24. Y. Sun, S. Ye, S. Inoue, and Y. Sun. Alternating recursive method for Q-matrix learning. In 7th Intl. Conf. on Educational Data Mining, pages 14–20, 2014. 25. K. K. Tatsuoka. Rule space: an approach for dealing with misconceptions based on
item response theory. Journal of Educational Measurement, 20(4):345–354, 1983. 26. K. K. Tatsuoka. Analysis of errors in fraction addition and subtraction problems.
Final report, Computer-based Education Research Laboratory, University of Illi-nois at Urbana-Champaign, 1984.
27. K. K. Tatsuoka. Toward an integration of item-response theory and cognitive error diagnosis. Diagnostic monitoring of skill and knowledge acquisition, pages 453–488, 1990.
28. K. K. Tatsuoka. Item Construction and Psychometric Models Appropriate for
Constructed Responses. Educational Testing Service Princeton, NJ: ETS research report. Educational Testing Service, 1991.
29. K. K. Tatsuoka. Architecture of knowledge structures and cognitive diagnosis: A statistical pattern recognition and classification approach. In P. D. Nichols, S. F. Chipman, and R. Brennan, editors, Cognitively Diagnostic Assessment, pages 327– 359. Hillsdale, NJ: Lawrence Erlbaum Associates, 1995.
30. Inc. The MathWorks. Matlab 7, function reference. In Matlab 7. Natick, Mas-sachusetts, 2008.