Publisher’s version / Version de l'éditeur:
Vous avez des questions? Nous pouvons vous aider. Pour communiquer directement avec un auteur, consultez la première page de la revue dans laquelle son article a été publié afin de trouver ses coordonnées. Si vous n’arrivez pas à les repérer, communiquez avec nous à [email protected].
Questions? Contact the NRC Publications Archive team at
[email protected]. If you wish to email the authors directly, please see the first page of the publication for their contact information.
https://publications-cnrc.canada.ca/fra/droits
L’accès à ce site Web et l’utilisation de son contenu sont assujettis aux conditions présentées dans le site LISEZ CES CONDITIONS ATTENTIVEMENT AVANT D’UTILISER CE SITE WEB.
Energy Science & Engineering, 7, 6, pp. 2373-2382, 2019-11-02
READ THESE TERMS AND CONDITIONS CAREFULLY BEFORE USING THIS WEBSITE. https://nrc-publications.canada.ca/eng/copyright
NRC Publications Archive Record / Notice des Archives des publications du CNRC :
https://nrc-publications.canada.ca/eng/view/object/?id=e3bcbe78-9218-4d66-ac16-a7d6a1f62914 https://publications-cnrc.canada.ca/fra/voir/objet/?id=e3bcbe78-9218-4d66-ac16-a7d6a1f62914
Archives des publications du CNRC
This publication could be one of several versions: author’s original, accepted manuscript or the publisher’s version. / La version de cette publication peut être l’une des suivantes : la version prépublication de l’auteur, la version acceptée du manuscrit ou la version de l’éditeur.
For the publisher’s version, please access the DOI link below./ Pour consulter la version de l’éditeur, utilisez le lien DOI ci-dessous.
https://doi.org/10.1002/ese3.412
Access and use of this website and the material on it are subject to the Terms and Conditions set forth at
Power coefficient measurements of a novel vertical axis wind turbine
Hilewit, Doma; Matida, Edgar A.; Fereidooni, Amin; Abo el Ella, Hamza;
Nitzsche, Fred
Energy Sci Eng. 2019;7:2373–2382. wileyonlinelibrary.com/journal/ese3
|
23731
|
INTRODUCTION
Earth's rotation and its unequal spatial absorption of solar energy (along with air buoyancy) are the main sources of large‐scale wind patterns. This attractive renewable energy can be harvested using wind turbines. There are two main types of wind turbines, depending on the orientation of the main axis of rotation: horizontal axis wind turbines (HAWTs) and vertical axis wind turbine (VAWTs). Although both wind turbines offer competitive efficiencies,1,2 HAWTs are consid-ered to be the preferred choice by the wind turbine industry. The VAWTs are normally available in three different types:
self‐starting Savonius, H‐Darrieus (having straight or helical blades), and Darrieus troposkien (resembling an egg beater and invented by G. Darrieus in 19311).
The Darrieus troposkien turbine has been studied exten-sively since the 1960s. The Sandia National Laboratories performed careful and comprehensive performance measure-ments of 2‐, 5‐, 17‐, and 34‐m‐diameter Darrieus troposkien VAWTs.3-6 The largest 34‐m turbine had an aspect ratio of 1.25 (H/D = height / diameter), producing 625‐kW power at a wind speed of 12.5 m/s.6 Troposkien VAWTs reached com-mercialization in the 1980s (eg, by FlowWind Corporation, which installed more than 500 turbines in California). The Received: 9 April 2019
|
Revised: 20 June 2019|
Accepted: 2 July 2019DOI: 10.1002/ese3.412
R E S E A R C H A R T I C L E
Power coefficient measurements of a novel vertical axis wind
turbine
Doma Hilewit
1|
Edgar A. Matida
1|
Amin Fereidooni
2|
Hamza Abo el Ella
2|
Fred Nitzsche
1This is an open access article under the terms of the Creative Commons Attribution License, which permits use, distribution and reproduction in any medium, provided the original work is properly cited.
© 2019 The Authors. Energy Science & Engineering published by the Society of Chemical Industry and John Wiley & Sons Ltd.
1Department of Mechanical & Aerospace
Engineering, Carleton University, Ottawa, ON, Canada
2National Research Council Canada,
Ottawa, ON, Canada
Correspondence
Doma Hilewit, 1125 Colonel By Drive, Ottawa, ON, K1S 5B6, Canada. Email: [email protected]
Abstract
Wind tunnel experiments were performed to evaluate the power coefficients of three vertical axis wind turbines (VAWTs), namely, (a) conventional VAWT (two‐bladed troposkien shape), (b) novel 50% shifted troposkien shape‐vertical axis wind tur-bine (50% STS‐VAWT), and (c) novel 100% STS‐VAWT. All turtur-bines had the same height, swept area, and NACA0015 airfoil with the same chord length. During the power coefficient measurements for each one of the turbines, the wind tunnel veloc-ity was varied while the turbine rotation was kept constant through rheostatic load adjustment. Two different turbine rotations were used (600 rpm and 700 rpm). The resulting tip speed ratios (TSRs) ranged from approximately 2 to 6 in the current investigation. Both the power coefficients and the tip speed ratios were corrected against wind tunnel blockage effects. The 50% STS‐VAWT model showed an overall better aerodynamic performance (both corrected and uncorrected power coefficients) when compared against the other two configurations, likely due to a combination of (a) power generation increased due to blade‐wake interaction (BWI) reductions and (b) power generation capacity related to the blade length of each turbine.
K E Y W O R D S
installed Darrieus troposkien VAWTs were affected by cyclic fatigue weaknesses at the joints between the extruded alu-minum blades and gradually vanished from the mainstream market.7 The first megawatt‐class prototype of a troposkien turbine (ie, the 4‐MW) named Éole was installed in early 1987 at Cap‐Chat from a joint project between Hydro Quebec and NRC (National Research Council Canada). With 64 m diameter and 96 m height, the Éole turbine was considered to be the largest VAWT ever built at that time. After six years of operation, the turbine was shut down due to damage to its bearings.8
Recently, Möllerström et al. 9 summarized all VAWT projects producing more than 100 kW of power per turbine. Relevant to wind farm configurations, near‐wake regions of VAWTs have also been studied meticulously by Ferreira10 and Persico et al.11 using particle image velocimetry (PIV) and/or hot‐wire anemometry. Numerically, troposkien VAWTs can also be studied using computational fluid dynamics (CFD) techniques12-14 or using blade element theory in addition to vortex filament methods.15,16
Despite their drawbacks, there has been a recent revival of Darrieus troposkien VAWTs,2,17 due to advantages that make them attractive for offshore applications with water depths greater than 40 meters (using floating platforms instead of anchoring the turbine at the bottom of the sea, eg, “The DeepWind Project” in Europe). Advantages included the fol-lowing: (a) They are able to harvest the wind from any direc-tion and attain a very high speed without a yaw mechanism guiding the blade18,19; (b) the generator and the gearbox of the turbine can be installed at sea level (or ground level for onshore applications) which leads to easier and safer maintenance; (c) since the center of gravity of the turbine is close to the sea level, the system becomes more inherently stable when it is afloat20; (d). there are reduced blade structural requirements since the blade is curved and attached to the tower at two points. This leads to reduced machine complexity and better
scalability to very large turbine sizes21,22; (e) the troposkien design typically has a constant airfoil shape along the length of its blades which makes it easier to fabricate23; and (f) the troposkien turbine's extracted power per unit ground area is approximately ten times bigger than HAWTs.24,25
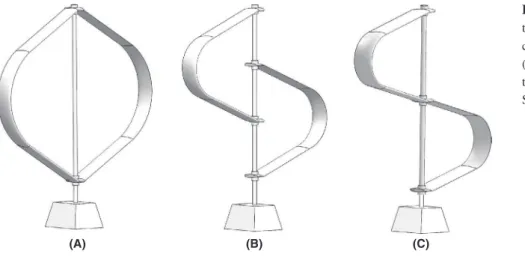
Despite advantages, VAWTs suffer from an intrinsic de-ficiency rooted in the complex aerodynamic behavior of the turbine due to blade‐wake interactions (BWIs), sometimes also referred to as blade‐vortex interactions (BVIs), although the latter is normally used when blade tip vortices are in-volved. An advancing blade will interact with the wake (or vortices) produced by another blade (or past revolutions of blades) during normal turbine operation. The combination of all wake vortices will change the angle of attack of the flow over the advancing blade, thus changing (normally re-ducing) the lift and torque (or power) generated by the blade. The detrimental BWI effects depend on the tip speed ratio (TSR).26 TSR is the ratio between the maximum blade rota-tional velocity and the wind velocity. It has been conjectured by the authors that the performance of VAWTs could be im-proved if the interactions between the advancing blade with the wake of other rotating blades could be reduced. In light of this idea, a modification to the conventional troposkien shape VAWT was considered. While keeping the same swept area (total frontal projection area of the revolving turbine) for comparison purposes, the advancing blade is shortened (thus reducing costs) and shifted vertically with respect to the second blade. This new configuration has been named “Shifted Troposkien Shape‐Vertical Axis Wind Turbine (STS‐VAWT)”. To validate this concept, a series of wind tunnel experiments were conducted for three types of config-urations, as shown in Figure 1. Notice that the wake of one of the blades will only partially affect the other blade for the 50% STS‐VAWT configuration. For the 100% STS‐VAWT configuration, the wake of one blade will only affect itself (at difference revolutions) but not the other blade directly.
FIGURE 1 Vertical axis wind turbine (VAWT) configurations: (A) conventional VAWT (troposkien shape), (B) novel 50% STS‐VAWT (50% shifted troposkien shape‐VAWT), (C) novel 100% STS‐VAWT
|
2375HILEWIT ET aL.
2
|
WIND TUNNEL EXPERIMENTS
2.1
|
Troposkien geometry
All turbines have been designed with the same height, H, and the same maximum radius of rotation, b, as shown in Figure 2. The heights of the troposkien blades, h, for the 50% STS‐VAWT and 100% STS‐VAWT, were made shorter than the conventional VAWT (h = H). The troposkien shape can be derived from the balance of forces on a uniform skipping rope that is rotating vertically at a constant velocity. Blackwell and Reis21 provided the following solution (adopting notation from Figure 2):
where z is the vertical position, a is the half height of the blade, and F is the complete elliptical integral of the first kind with a parameter k, defined as
The parameter φ is given by
where r is the blade radius at a particular height (b or R is the maximum radius at the equator of the blade) and β is the blade diameter‐to‐height ratio. β is correlated to the parameter k by
The integrals can be obtained numerically through itera-tive determination of k as function of β. Finally, the troposkien blade length, S, and the swept area, As, can be determined by
where E(𝜋
2,k) is the complete elliptical integral of the second kind with parameter k, defined as
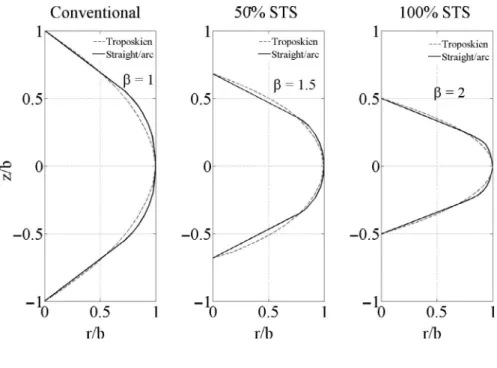
Since any point on a perfect troposkien shape has its own local curvature, fabricating the blades requires high‐quality machining which is often not cost‐effective. However, con-formity with the troposkien shape is particularly important to ensure minimal bending stress along the blade. Hence, wind turbine companies normally design and manufacture straight/ arc approximations of the troposkien shape configurations. These approximations consist of a middle circular segment that is connected to the shaft supports by two straight seg-ments. This strategy for designing the blades is also followed here as shown in Figure 3. As demonstrated by the figure, the straight/arc approximation closely matches the troposkien shape for all the β values.
To ensure that any difference in performance of a partic-ular turbine was caused by its specific configuration, all tur-bines have the same number of blades (2), maximum radius of rotation, overall height, swept area, chord length, and air-foil cross section (NACA0015). The overall dimensions of the conventional VAWT, 50% STS‐VAWT, and 100% STS‐VAWT are listed in Table 1. Following these design configurations, all three turbines were fabricated using a rapid prototyping machine (ABS plastic) and connected to a vertical round shaft (6061 aluminum tube with 1.9 cm external diameter).
2.2
|
EXPERIMENTAL SETUP
The wind tunnel experiments were performed in the at-mospheric boundary layer (ABL) wind tunnel located in the department. The ABL wind tunnel (cross section: W × H = 1.68 m × 1.12 m) is a low‐speed open‐circuit wind (1) z a= 1 − F(𝜙,k) F(𝜋 2,k) , (2) F(𝜙,k)= ∫ 𝜙 0 d𝜃 √ 1− k2sin2 𝜃 . (3) 𝜙= sin−1 [ 1 𝛽 (r a )] , (4) 𝛽= 2k (1− k2)F(𝜋 2;k) (5) S 2a= 2 1− k2 E(𝜋 2,k) F(𝜋 2,k) − 1, (6) As 4a2= ln ( 1+k 1−k ) (1 − k2) F2(𝜋 2,k) , (7) E(𝜙,k)= ∫ 𝜙 0 √ 1− k2sin2𝜃d𝜃.
FIGURE 2 Conventional and shifted troposkien shape designs: (A) conventional VAWT (B) 50% STS‐VAST (C) 100%
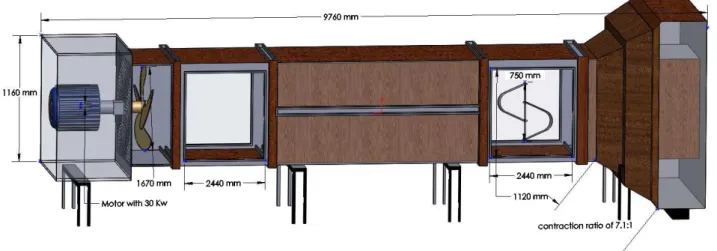
tunnel with a contraction nozzle ratio of 7.1:1 (see Figure 4). The maximum wind tunnel speed is 62 km/h with a flow tur-bulence intensity of 0.42%. The wind velocity can be adjusted by controlling the fan frequency. The VAWT was placed ver-tically at the center of the test section (close to the contrac-tion nozzle) and was mounted on two small foundacontrac-tions with bearings installed on the floor and at the ceiling of the test section. A timing pulley was connected to the output shaft of
the turbine which was passed through the lower foundation and the wind tunnel floor to the output shaft of the permanent magnet DC motor (Dyton 3XE19, 17 W, 1800 rpm), which can be used as generator, as shown in Figure 5.
The generator was located 30 cm from the center of the wind tunnel and connected to two separate digital multime-ters (Mastech MS8268 Digital AC/DC) to measure the volt-age and current produced by the turbine. A rheostat (NBR series, 50 Ω, 25 W) was used as a load control to adjust the current and maintain a constant rotational turbine speed. The rotational speeds of the turbines were measured using a Digital Laser Tachometer (DT‐2234C+). In the measure-ments of a particular turbine, a higher wind tunnel speed is set and the resistance of the rheostat is increased until the ro-tation of the turbine reaches a determined value (for example, 700 rpm, obtained from the digital tachometer). The power generated by the turbine (from current and voltage) can be obtained. The procedure is repeated for different wind tunnel speeds and the power coefficient as function of the tip speed ratio can be obtained for a fixed rpm. Each set of experiments has been repeated three times.
2.3
|
Wind tunnel blockage corrections
The correction of power coefficients and tip speed ratios due to the wind tunnel blockage ratio (BR, the ratio between the turbine swept area, As, and the wind tunnel test‐sectional area, At) has been discussed in the literature for vertical axis wind turbines,27,28 but due to the rotational nature of the sys-tem, it seems that standard correction consensus for VAWTs has not been fully formed yet when compared to HAWTs.29 Although simplistic, the current investigators opted to mod-ify and use a traditional but conservative method (a higher
FIGURE 3 Comparison between troposkien and straight/arc blade shapes
TABLE 1 Turbine specifications
Parameters of the
models Conventional VAWT 50% STS‐VAWT 100% STS‐VAWT
Number of blades (N) 2 2 2 Turbine radius (b) [m] 0.375 0.375 0.375 Turbine height (H) [m] 0.75 0.75 0.75 Swept area (As) [m2] 0.36 0.36 0.36 Chord length (c) [m] 0.1 0.1 0.1 Blade height (h = 2a) [m] 0.75 0.50 0.375 Blade length (S) [m] 1.10 0.93 0.855 Solidity (σ = NcS/As) 0.59 0.50 0.46 Blade weight [kg] 0.345 0.290 0.284 Blade weight/length ratio 0.313 0.311 0.33 Blade airfoil NACA 0015 NACA
|
2377HILEWIT ET aL.
level of correction will be applied and reduce overall power coefficients) based on Pope and Harper.30
The blockage ratio (BR) for the current turbines was 19.1%. In wind turbine experiments, the results are normally corrected if the BR is higher than 10%.31,32 The “blocked” wind tunnel values of power coefficient, CP, tip speed ratio, TSR or λ, and velocity, U, must be correlated with the uncon-fined corrected values of CPc, λc, and Uc as follows:
and
The power coefficient is defined by
where P is the power produced by the turbine, ρ is the air den-sity, As is the turbine swept area, and U is the wind speed. The tip speed ratio is defined as
where ω is the rotational speed and R is the maximum radius of rotation for the turbine. Pope and Harper30 proposed the follow-ing blockage correction equation for unusually shaped objects
where the frontal area, Af, includes the turbine swept area
and the rig frontal area (turbine supports and exposed exper-imental components), and At is the wind tunnel cross section
area (1.68 m × 1.12 m). The corrected velocity becomes
When taking into account the conservation of mass before and around the blockage
(8) CPc= CP ( U Uc )3 (9) 𝜆c= 𝜆 ( U Uc ) . (10) CP= 1 P 2𝜌V∞ 3A S , (11) 𝜆=𝜔R U , (12) 𝜀t=1 4 Af At, (13) Uc= U (1 + 𝜀t). (14)
𝜌UAt= 𝜌Uside(At− Af).
FIGURE 4 3D geometry of the wind tunnel (the flow direction is from right to left in this figure)
The correlation could be rewritten as
If the area ratio is applied, a single correction is obtained (𝜀t = 0.0489 for the current investigation), and if velocity
measurements are available, the velocity ratio can also be used to estimate the correction factor, 𝜀t. In this study, the
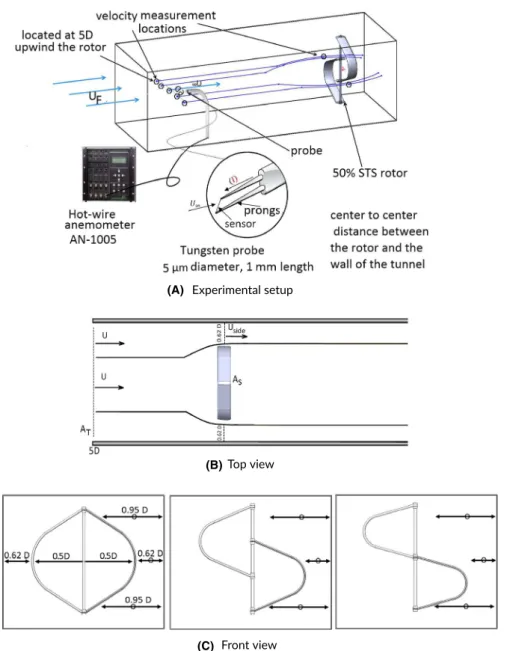
velocities were measured at two different locations using a hot‐wire anemometer technique, as shown in Figure 6. The first location was 5 turbine diameters (5D) upwind of the rotor (ie before the turbine, giving velocity U), while the second location was between the turbine and the tunnel wall during turbine rotation (ie where the greatest block-age effects occurred), leading to the velocity Uside, which is taken as the average of three points at the faster side of each turbine (see again Figure 6). The power coefficients and tip
speed ratios of the turbine models were corrected by mod-ifying the area ratio approach used by Pope and Harper30 through inclusion of velocity ratio information. This modi-fied correction should better represent the blockage effects due to turbine rotation and operating conditions (tip speed ratio). It should be noted that the velocities are the average readings of three measurements.
A hot‐wire probe (9055P0111, Dantec Dynamics) con-nected to an anemometer unit (AN‐1005, A.A. Lab Systems Ltd.) was used during the streamwise velocity measure-ments. The anemometer was operated on CTA (constant temperature anemometry) mode. The probe was calibrated in the wind tunnel against mean velocity measurements using a Pitot‐static tube, which was connected to a pressure transducer (ie PX653, Omega) and a DAQ acquisition (ie NI‐9205, National Instruments Corporation). A PC equipped with the data acquisition card was also employed to re-ceive the output signal from the hot‐wire anemometer. The (15) 𝜀t=1 4 Af At= 1 4 ( 1− U Uside ) .
FIGURE 6 A schematic of the velocity measurement locations at the ABL wind tunnel: A, hot‐wire anemometer experimental setup. B, Top view of the rotor inserted into the ABL wind tunnel, where U and Uside are velocities, AT, As
are areas for the tunnel and the turbine. C, Front view schematic of the velocity measurement locations for the three different configurations (dimensions are not to scale)
(A)
(B)
|
2379HILEWIT ET aL.
output voltage of the probe was recorded with a sampling rate (SR) of 2.8 kHz and for 30 seconds at each measure-ment location. The velocity, U, was varied between 3.1 and 9.7 m/s in the current investigation, with root‐mean‐square streamwise fluctuations of approximately 0.01 and 0.04 m/s, respectively.
3
|
UNCERTAINTY ANALYSIS
The total uncertainty of the power coefficient, UC
P, is given
by a combination of bias, BC
P, and random errors, SCP, as
follows
where t = 2.353 (measurement repeats, n = 3) represents the “student's t‐distribution” at 95% confidence level. The random error for the power coefficient can be calculated from the ex-periments. The power coefficient bias error can be expressed as
where
The power, P, was measured by a multimeter (voltage multiplied by current). Due to blockage effect corrections, losses in the pulleys and belt, the bias error was estimated as 5% or BP/P = 0.05. Assuming ideal gas law, the bias error of
density was estimated as, Bρ/ρ = 0.02. The swept area was
calculated using a CAD software. Models were manufac-tured using ABS plastic (rapid prototyping). Assuming that the structure is relatively rigid during experiments, the swept area bias is taken as, BA
S∕AS= 0.0036. The velocity, U, was
measured using hot‐wire anemometry. The bias error is es-timated as, BU/U = 0.01. The bias of the tip speed ratio is
given by
where
The following values were assumed:
BR/R = 0.0026(radiusbiaserror),Bf∕f = 0.01 (rotation
fre-quency bias error), and BU/U = 0.01 (free stream velocity
bias error). The random error for λ was assumed to be similar to the bias error. Using calculations for the corrected peak power coefficient of the 50% STS‐VAWT at 600 rpm, we have an uncertainty of approximately ± 5.4% for the power coefficient and ± 3.7% for the tip speed ratio at 95% confi-dence level interval.
4
|
RESULTS AND DISCUSSION
Wind tunnel experiments for each turbine were performed. Power generation was measured for different wind tunnel ve-locities while maintaining the rotation of the turbine constant. Two sets of rotations were used in the present measurements (600 and 700 prm).
4.1
|
Measurements at 600 rpm
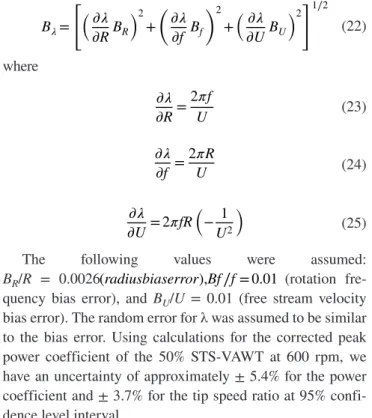
Figure 7 shows the uncorrected power coefficient experimen-tal results as function of the tip speed ratio, λ, for the conven-tional VAWT (solid black line), 50% STS‐VAWT (light gray line), and 100% STS‐VAWT (gray line) at 600 rpm. Notice that the curves show the average and the standard deviation of three measurements taken for each prototype. For the con-ventional VAWT, the power coefficient rises from a low tip speed ratio (CP = 0.14 at λ = 3.25) to a peak around CP = 0.26
(at λ = 3.75). This sloped (increasing CP) region is dominated
by dynamic stall (concerning the flow around the blades). After the peak is reached, secondary effects including BWIs (blade wake interactions) start dominating the flow phenom-ena around the blades, thus reducing the performance of the turbine. In this region, the power coefficient decreases when the tip speed ratio is increased. The region around the peak of the power coefficient curve is normally referred to as the transition region.1 The 50% STS‐VAWT power coefficient (16) UC P= ±[(BCP) 2 + (tSCP) 2]1∕2 (17) BCP= [ ( 𝜕CP 𝜕P BP )2 +( 𝜕CP 𝜕𝜌 B𝜌 )2 +( 𝜕CP 𝜕AS BA )2 +( 𝜕CP 𝜕U BU )2]1∕2 (18) 𝜕CP 𝜕P = 1 1∕2𝜌U3A S (19) 𝜕CP 𝜕𝜌 = P 1∕2U3A S ( − 1 𝜌2 ) (20) 𝜕CP 𝜕AS = P 1∕2𝜌U3 ( − 1 A2 S ) (21) 𝜕CP 𝜕U = P 1∕2𝜌AS ( − 3 U4 ) (22) B𝜆= [ (𝜕𝜆 𝜕RBR )2 + ( 𝜕𝜆 𝜕f Bf )2 + (𝜕𝜆 𝜕UBU )2 ]1∕2 (23) 𝜕𝜆 𝜕R= 2𝜋f U (24) 𝜕𝜆 𝜕f = 2𝜋R U (25) 𝜕𝜆 𝜕U= 2𝜋fR ( − 1 U2 )
curve presented similar trend (three regions) as expected, re-sembling an inverted parabola with a peak (vertex), this time higher (CP = 0.28 at λ = 4.2) than the conventional VAWT,
indicating better overall performance for mid to high TSR, while maintaining similar performance for lower TSR. This overall performance (more power is generated for the same swept area despite shorter troposkien blades) can be attrib-uted to a reduction in BWI unwanted effects. Despite further reducing BWIs, the 100% STS‐VAWT showed a lower peak power (CP = 0.24 at λ = 4.0) than the conventional VAWT
as well as the 50% STS‐VAWT, although outperforming the conventional VAWT for higher tip speed ratios (λ > 4.1). This under achievement can be attributed to the size of the 100% STS‐VAWT blades. Although reducing BWIs, shorter blades (lower solidity) also generated less power. Performance im-provement seems to be a balance between BWI reduction, size (height and/or length) of the blades, and dynamic stall at low TSRs. It must be pointed out here that full design op-timization was beyond the scope of the current investigation. Additional hot‐wire velocity measurements were per-formed to determine the wind tunnel blockage effect correc-tion for each turbine at different tip speed ratios. Figures 8 shows the experimental results of the velocity ratio U/Uside (between the wind tunnel velocity and the velocity of the flow around the wind turbine) as function of wind tunnel free stream velocity, U, for the conventional VAWT, 50% STS‐VAWT, and 100% STS‐VAWT at 600 rpm. The veloc-ity ratio increases when the wind tunnel velocveloc-ity is increased for all turbines. At a particular wind tunnel velocity, the ve-locity around the turbine, Uside, was the fastest around the 50% STS‐VAWT, closely followed by the 100% STS‐VAWT, while the conventional VAWT had the slowest Uside or high-est velocity ratio U/Uside, regardless of rotation. Despite hav-ing the same blockage when swept area is considered, all three turbines seem to produce different levels of blockage due to their characteristic geometric features at the rotations studied in the present work. Having the information depicted in Figure 8, the modified Pope and Harper, Equations and ,
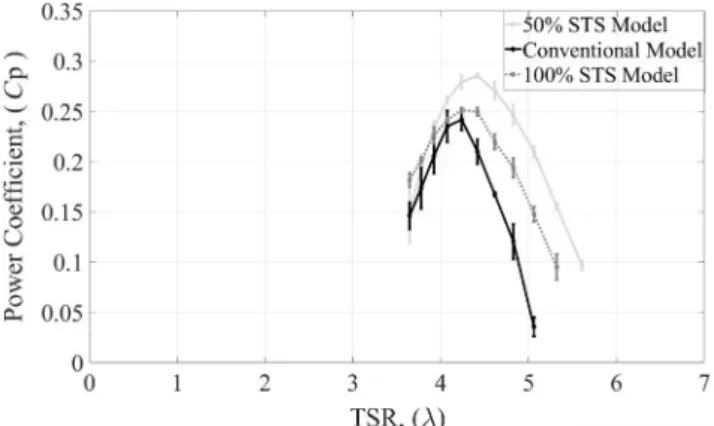
can be used to correct both the power coefficients, Equation , and the tip speed ratios, Equation . The corrected CP values will be lower than the uncorrected raw data and the CP curves
will be shifted to the left due to the correction of the TSRs. Figure 9 shows the corrected power coefficient results as a function of the tip speed ratio. Corrections reduced the overall values of Cp for all turbines while shifting all curves
to the left (smaller corrected tip speed ratios), as expected. At 600 rpm, the 100% STS‐VAWT has similar (at lower and higher tip speed ratios) or lower (around the peak power) ef-ficiencies when compared against the conventional VAWT. At the same rotation, the 50% STS‐VAWT has a higher peak power (which also occurred at a higher TSR) when com-pared against the conventional VAWT, while having simi-lar performance at low tip speed ratios (λ < 3.0). Although the values of peak power should be looked at with some caution due to the uncertainty analysis, the peak power for the 50% STS‐VAWT (CP = 0.23$) increased approximately
by 10% when compared against the conventional VAWT (CP = 0.21), despite smaller blade height (or smaller costs).
4.2
|
Measurements at 700 rpm
Figure 10 shows the uncorrected power coefficient results for the 700 rpm measurements. At this rotation, the 100% STS‐VAWT outperformed the conventional VAWT for the range of tip speed ratio tested. Excluding small tip speed ra-tios (λ < 3.8), the 50% STS‐VAWT outperformed both the 100% STS‐VAWT and the conventional VAWT at 700 rpm. An increase in rotation from 600 to 700 rpm, resulted in a slightly increase in peak power from CP = 0.28 at λ = 4.2 (see
again Ref. 7 to C
P = 0.286 at λ = 4.4 (current figure).
Figure 11 shows the experimental results of the velocity ratio U/Uside as function of wind tunnel free stream velocity,
U, for the conventional VAWT, 50% STS‐VAWT, and 100%
STS‐VAWT at 700 rpm. Velocity ratios for 700 rpm are lower than the values at 600 rpm (shown in Figure 8) for the same wind tunnel velocity.
FIGURE 7 Power coefficient (Cp) vs TSR before corrections at
600 rpm
FIGURE 8 Velocity ratio as a function of free stream velocity at 600 rpm
|
2381HILEWIT ET aL.
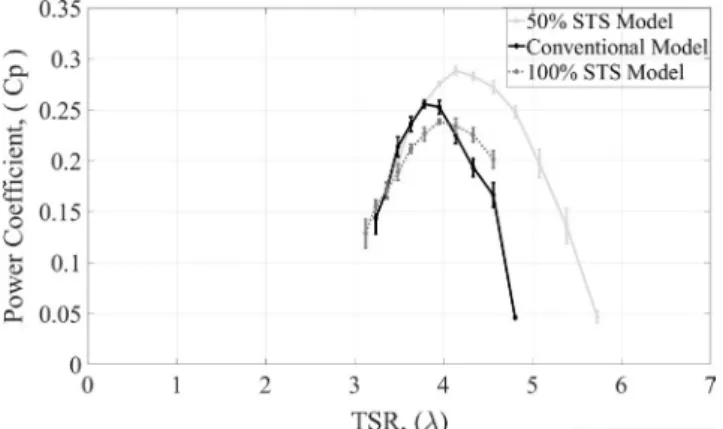
Figure 12 shows the corrected power coefficient results as a function of the tip speed ratio at 700 rpm. The overall perfor-mance is more clearly delineated, with the 50% STS‐VAWT outperforming both the 100% STS‐VAWT and the conven-tional VAWT when the power coefficient is concerned. It has also been discussed that the comparisons should have used the same solidity for all turbines. Solidity is defined as σ = (NcS)/As, where N is the numbers of blades, c is the chord length, S is the blade length, and As is the swept area. Solidity could be increased for the 50% STS‐VAWT and the 100% STS‐VAWT (by increasing the chord length of their blades) to match the solidity of the conventional VAWT, but it would only give further advantage to the novel turbines, which would produce even more power for the same swept area. The solidity was not kept constant in the present work, thus likely giving the lower bound of performance improve-ments for both the 50% and 100% STS‐VAWTs.
5
|
CONCLUSIONS
Wind tunnel measurements at two rotational speeds (600 and 700 rpm) were performed to investigate the power
coefficients of three troposkien vertical axis wind turbines: (a) conventional VAWT, (b) novel 50% STS‐VAWT, and (c) novel 100% STS‐VAWT. The measured power coefficients were corrected using a modified Pope and Harper blockage effect equation by taking into account velocity measure-ments before (free stream velocity) and around the turbines. Regardless of correction, 50% STS‐VAWT showed a higher peak power performance when compared against both the conventional VAWT and the 100% STS‐VAWT for 600 as well as 700 rpm. 50% STS‐VAWT blades seem to reduce BWI effects, thus increasing overall performance, while re-ducing overall costs (materials and fabrication) of the turbine. Despite reducing BWIs, 100% STS‐VAWT underperformed due to smaller blade size (or smaller solidity). Additional ex-perimental and numerical studies must be performed in order the fully understand the novel concepts proposed here. Future measurements should be performed at different wind tun-nels with larger cross sections (thus reducing the blockage ratio) to verify the blockage effect correction presented here. Scalability studies as well as stress analysis (due to the non-symmetrical unbalance of the novel turbines) should also be investigated.
FIGURE 9 Power coefficient (Cp) vs TSR after corrections at
600 rpm
FIGURE 10 Power coefficient (Cp) vs TSR before corrections
at 700 rpm
FIGURE 11 Velocity ratio as a function of free stream velocity at 700 rpm
FIGURE 12 Power coefficient (Cp) vs TSR after corrections at
CONFLICT OF INTEREST None declared.
ORCID
Doma Hilewit https://orcid.org/0000-0002-9687-4161
REFERENCES
1. Paraschivoiu I. Wind turbine design: with emphasis on Darrieus concept. Polytechnic International Press; 2002.
2. Paraschivoiu I, Ammar S, Saeed F. VAWT versus HAWT: a com-parative performance study of 2‐6 MW rated capacity turbines. Transactions of the Canadian Society for Mechanical Engineering. NRC Research Press; 2018:1‐11.
3. Blackwell BF, Sheldahl RE, Feltz LV. Wind tunnel performance data for the Darrieus wind turbine with NACA0012 blades. Sandia National Laboratories, Report SAND76‐0130.
4. Sheldahl RE, Klimas PC, Feltz LV. Aerodynamic performance of a 5‐metre‐diameter Darrieus turbine with extruded alumi-num NACA‐0015 blades. Sandia National Laboratories, Report SAND80‐0179.
5. Worstell MH. Aerodynamic performance of the 17‐metre‐diame-ter Darrieus wind turbine. Sandia National Laboratories, Report SAND78‐1737.
6. Ashwill TD. Measured data for the Sandia 34‐meter verti-cal axis wind turbine. Sandia National Laboratories, Report SAND91‐2228.
7. Touryan KJ, Strickland JH, Berg DE. Electric power from vertical‐ axis wind turbines. J Propul Power. 1987;3(6):481‐93.
8. Spera DA. Wind turbine technology: fundamental concepts of wind turbine engineering, Vol. 3. New York: ASME Press; 1994. 9. Möllerström E, Gipe P, Beurskens J, Ottermo F. A historical
re-view of vertical axis wind turbines rated 100 kW and above. Renew Sustain Energy Rev. 2019;105:1‐13.
10. Ferreira CJS. The near wake of the VAWT: 2D and 3D views of the VAWT aerodynamics. Ph.D. Thesis Dissertation, University of Delft; 2009.
11. Persico G, Dossena V, Paradiso B, Battisti L, Brighenti A, Benini E. Time‐resolved experimental characterization of the Wakes Shed by H‐Shaped and Troposkien Vertical Axis Wind Turbines. Trans ASME J Energy Res Technol 2017;139:1‐11.
12. Castelli MR, Masi M, Battisti L, et al. Reliability of numer-ical wind tunnels for VAWT simulation. J Phys Conf Ser. 2016;753:082025.
13. Victor S, Paraschivoiu M. Performance of a Darrieus turbine on the roof of a building. Trans Can Soc Mech Eng. 2018;42:341‐349. 14. Ferreira CJ, van Bussel G, van Kuik G. A 2D CFD simulation of
dynamic stall on a vertical axis wind turbine: verification and vali-dation with PIV measurements.; 2007:1‐11.
15. Scheurich F, Fletcher TM, Brown RE. Simulating the aerodynamic performance and wake dynamics of a vertical‐axis wind turbine. Wind Energy. 2011;14(2):159‐77.
16. Strickland JH, Webster BT, Nguyen T. A vortex model of the Darrieus turbine: an analytical and experimental study. J Fluids Eng. 1979;101(4):500‐5.
17. Walter M, Bonnie R. Large‐scale offshore wind power in the United States: assessment of opportunities and barriers. Technical Report, Assessment of opportunities and barriers, NREL/TP–500– 407455063; 2010.
18. Peace S. Another approach to wind. Mechanical Engineering Magazine Select Articles. 2004;126(06):28‐31.
19. Roscher B. Structural optimization of a vertical axis wind turbine with aeroelastic analysis. M. Sc, Wind Energy and Aerospace Engineering, Technical University of Denmark and Delft University of Technology; 2014.
20. Vita L, Paulsen US, Pedersen TF. A novel floating offshore wind turbine concept: new developments. European Wind Energy Association (EWEA); 2010.
21. Blackwell BF, Reis G. Blade shape for a tropskien type of vertical‐ axis wind turbine. Sandia report, 2012;SLA‐74‐0154; 1977. 22. Blackwell BF, Sheldahl RE. Selected wind tunnel test results for
the Darrieus wind turbine. Journal of Energy. 1977;1(6):382‐6. 23. Islam M, Ting DS, Fartaj A. Aerodynamic models for Darrieus‐
type straight‐bladed vertical axis wind turbines. Renew Sustain Energy Rev. 2008;12(4):1087‐109.
24. Dabiri JO. Potential order‐of‐magnitude enhancement of wind farm power density via counter‐rotating vertical‐axis wind turbine arrays. Journal of renewable and sustainable energy. 2011;. 3(4):p.043104. 25. Benedict M, Lakshminarayan V, Pino J, Chopra I. Fundamental
understanding of the physics of a small‐scale vertical axis wind tur-bine with dynamic blade pitching: an experimental and computa-tional approach, In 54th AIAA/ASME/ASCE/AHS/ASC Structures, Structural Dynamics, and Materials Conference, 2013; p. 1553. 26. Fujisawa N, Shibuya S. Observations of dynamic stall on Darrieus
wind turbine blades. J Wind Eng Ind Aerodyn. 2001;89(2):201‐14. 27. Cavagnaro R, Polagye B. An evaluation of blockage corrections for
a helical cross‐flow turbine.; 2014:7‐8.
28. Jeong H, Lee S, Kwon SD. Wind tunnel interference effects on power performance of small Darrieus wind turbines. In The 2014 World Congress on Advances in Civil, Environmental, and Materials Research (ACEM14); 2014.
29. Chen TY, Liou LR. Blockage corrections in wind tunnel tests of small horizontal‐axis wind turbines. Exp Thermal Fluid Sci. 2011;35(3):565‐569.
30. Pope A, Harper J. Low‐speed wind tunnel testing. Wiley, 2nd Edition; 1966.
31. Bahaj AS, Molland AF, Chaplin JR, Batten WMJ. Power and thrust measurements of marine current turbines under various hydrody-namic flow conditions in a cavitation tunnel and a towing tank. Renewable Energy. 2007;32(3):407‐426.
32. Hirai S, Honda A, Kariromi K. Wind loads investigations of HAWT with wind tunnel tests and site measurements. Beijing: Wind Power Asia; 2008.
How to cite this article: Hilewit D, Matida EA, Fereidooni A, Abo el Ella H, Nitzsche F. Power coefficient measurements of a novel vertical axis wind turbine. Energy Sci Eng. 2019;7:2373‐2382. https ://doi. org/10.1002/ese3.412