Analysis of Human Coordination Patterns between a Younger and Older Age Group during the Timed Up and Go Test
by
Danielle Barillas
Submitted to the
Department of Mechanical Engineering
in Partial Fulfillment of the Requirements for the Degree of
Bachelor of Science in Mechanical Engineering
at the M ETITUTE
OFT.QHNQLOGY
Massachusetts Institute of Technology
JUL 25Z217
June 2017
LIBRARIES
ARCHIVES 0 2017 Danielle Barillas. All rights reserved.
The author hereby grants to MIT permission to reproduce and to distribute publicly paper and electronic copies of this thesis document
in whole or in part in any medium now known or hereafter created.
Signature redacted
Signature of Author:
Department of Mechanical Engineering May 19, 2017
Certified by:
Signature redacted
Leia Stirling Assistant Professor in Aeronautics and Astronautics
Signature redacted
ThesisSupervisorAccepted by:
Analysis of Human Coordination Patterns between a Younger and Older Age
Group during the Timed Up and Go Task
by
Danielle Barillas
Submitted to the Department of Mechanical Engineering On May 19, 2017 in Partial Fulfillment of the
Requirements for the Degree of
Bachelor of Science in Mechanical Engineering
ABSTRACT
An experimental study was performed to understand lower limb movement patterns between older and young adults, and to explore a new metric of coordination. Lower limb and torso movement in an older and younger population was captured using both IMU sensors and an optical tracking system. Only data from the optical method was processed and analyzed for this thesis. The participants executed several trials of a Timed-Up-and-Go test (TUGT), a 10 meter Walk Test (1OMWT), and a Standing Balance Test (SBT). This paper specifically analyzed data from seven of the participants when executing the TUG test. The Relative Coordination Metric (RCM) from Hip to Knee and from Knee to Ankle was briefly explored for one subject from each age group. Several qualitative differences in motion were seen between the younger subject and the older subject for the Hip-Knee RCM, while similarities were identified for the Knee-Ankle RCM. The TUG time for the younger age group (M = 11.48s, SD = 1.26s) and the older age group (M = 12.06s, SD = 0.69s) was also compared and it was found that they were significantly different (t =1.998, p = 0.017).
Thesis Advisor: Professor Leia Stirling
Acknowledgements
I would like to express my deepest thanks to all of those who made this research possible.
First, thank you to Professor Leia Stirling for your guidance and expertise. You have been an
unbelievably amazing thesis advisor throughout this study. Your patience and understanding
reduced much of my stress this semester and also inspired me to strive forward.
I would like to thank my graduate mentor, Richard Fineman. Thank you for agreeing to let me work alongside you. Thank you for your help with the camera setup (even at very late hours of the
day), for teaching me about different software programs, and for supplying me tools that alleviated
some of my workload. I wish I had met you and Leia sooner at MIT, but I'm glad I had at least my
last semester at MIT to work with both of you.
Lastly, I would like to thank Guillermo Bautista, Arlette Reyes, and Dayanna Espinoza. Since
freshman year, I have gotten to know all of you so well through all the fun and hard times here at
MIT. Thank you for helping me out with code, for giving me advice on this paper, and for checking
in on me once in a while to make sure I had a steady work-life balance.
The encouragement and support I received from these wonderful people is what pushed me
Table of Contents
A b stract ... 2
A cknow ledgem ents... 3
T able of C ontents... 4 L ist of F igures... . 5 L ist of T ables... . .. 6 1. In tro du ctio n ... 7 1.1. M o tiv ation ... 7 1.2. Coordination of Movement...8
1.3. Measurements of Fall Risk...9
1.4. Research Goals and Outline...11
2 . M eth o d s... . .. 12
2.1. E xperim ental D esign ... 12
2.2 . D ata Processing ... 13
2.3. Statistical A nalysis...15
3. R esults and D iscussion... 16
3.1. T otal T im e for T U G T ... 16
3.2. Relative Coordination Metric between Two Subjects...18
4. C onclusion ... 24
List of Figures
Figure 1: Marker and IMU Placement...13
Figure 2: Box Plot of Subject TUGT Times...17
Figure 3: Hip, Ankle, and Knee Joint Angles for Subject Y3 for Trial I...18
Figure 4: Hip, Ankle, and Knee Joint Angles for Subject 01 for Trial I...19
Figure 5: Hip-Knee RCM and Knee-Ankle RCM for Subject Y3... 20
Figure 6: Hip-Knee RCM and Knee-Ankle RCM for Subject 01... 20
List of Tables
Table 1: Collection of Average TUGT Times... 10
Table 2: Reports of Average Gait Speed...10
1. Introduction
1.1 Motivation
The study of human coordination has many applications, especially in healthcare. Within
healthcare, many studies have been dedicated towards assessing fall risk. Falls are the leading
cause of injury for those above 65 years of age in the US [1]. One out of five falls results in serious
injury, such as fractures or head injuries. The injuries negatively affect a person's independence
by limiting their ability to perform activities of daily living. Some of the factors that contribute to a high fall risk are difficulties walking or problems with balance.
Injured individuals may be referred to physical therapists to contribute to their recovery.
These professionals are qualified in assessing an individual's fall risk and can prescribe proper
exercises that both contribute to the patient's recovery and evaluate the patient's quality of
movement. There are several tests, like the Timed-Up-and-Go (TUGT), Sit-to-Stand (STS), and a
One-Legged-Stance, that help assess a person's balance, gait, or overall motion [2]. However, it is
difficult for the therapist to evaluate their patient's progress outside of the in-clinic therapy
sessions. Metrics that provide clinicians with patient progress and quality of movement between
therapy sessions will help clinicians overcome that obstacle.
This study focuses on observing lower limb biomechanics of healthy individuals to
understand the differences in gait motion profiles between younger and older adults using a novel
1.2 Coordination of Movement
Human coordination can be evaluated using a wide variety of methods that characterize
motion through its velocities, forces, and even muscle behavior.
Velocity is frequently collected, especially in tests like the 10 meter Walk Test and its
variations. Walking speed is used to measure functional mobility of clinical patients [3]. It can
determine rehabilitation needs, future mobility functionality, as well as fall risk. Speed of human
movement, overall, however, is also shown to affect the accuracy of movement. This phenomena
is called the speed-accuracy trade-off It describes how there may be a decrease in accuracy of a
motion as the speed of that motion increases. The physiological cause for this is likely the
variability of noise that exists in the neuro-mechanical system. The amount of noise in motor
commands tend to increase with commands of higher magnitude [4]. Although speed can describe
an individual's movement, additional metrics may applied to further understand coordination.
Time to complete a task can be one of the simplest ways of correlating human performance
to health. Time to completion from various tasks, such as TUGT, is often correlated with other
clinically relevant parameters, such as fall risk. Previous studies have used total time to complete
an exercise as a method for assessing differences in limb motion between young and healthy
elderly individuals [5].
One of the most common ways physical therapist or rehabilitation clinician receive
information about a patient's quality of movement is through direct interaction or visual
observation. During clinical visits, it is common for clinicians to evaluate the motion of particular
limbs or joints, or even overall movements. These professionals are crucial in identifying
This paper will focus on utilizing the time to execute a task along with joint orientations
and angular velocity of the hip, knee, and ankle to understand joint patterns between a younger
and older age group. The Relative Coordination Metric (RCM) will be calculated using the joint
angular velocities to quantify the coordination between two limb segments. This metric was
applied in this study for an initial qualitative assessment on how it quantifies joint movement
between younger and older adults.
1.3 Measurements for Fall Risk
There are several standard exercises that are used to characterize gait and fall risk. Two are
the Time-Up-and-Go test (TUGT) and a 10 meter Walk Test (1OMWT).
The TUGT involves beginning in a sitting position, walking 3 meters, and ending in a
seated position. The TUGT and its subtasks are well associated with fall risk. It also can assess
mobility, balance, and walking ability [6]. While the time to complete a TUGT is a well-established
measurement to aid in describing fall risk, the interpretation of risk is not consistent and time may
be affected by the instructions given. The average TUGT time varies across the literature; some
are shown in Table 1.
In the table, it's seen how the TUGT times vary from each study. Bergmann's experiment
specifically explored the how TUGT times vary depending on the instructions given. It was
discovered that for both a young and old age group, verbal instructions affected TUGT times [9].
Shumway-Cook's experiment, for example, instructed participants to walk as quickly and safely
Table 1: Collection ofAverage TUGT Times
Bischoff' 65-85 413 8.3s 1.9s
Shumway-Cook' 65-85 15 8.4s 1.7s
Bergmann9 60-76 14 8.75s Medley & Thompson10 65-74 20 10.7s 1.9s
Iluz et all" 78.65 4.35* 38 10.22s 2.53s
Daubney & Culham'0 65-91 39 11.ls 3.7s
Hughesl0 65-86 20 13.0s 2.6s
Iluz et all" 28.06 3.99* 30 7.66s 1.96s
Bergmann9 19-25 14 9s
*Mean Standard Deviation
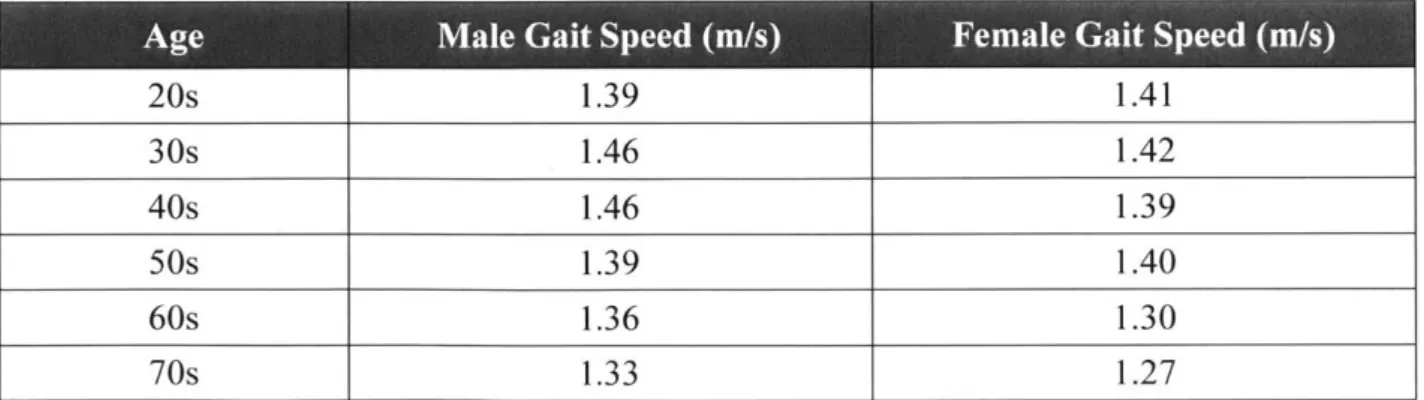
The 1 OMWT involves beginning in a standing position, walking 10 meters, and ending in a standing position. It's used to acquire gait speed, as well as time to complete the task. How fast or slow the individual travels can be used to predict any need of intervention to reduce probability of falling. Like the TUGT, thresholds between high and low fall risk vary. Harnish et al [6], for example, determined that a gait speed greater than 0.8m/s fell under a low fall risk. Normative gait speed for individuals between 20-79 years old are listed below:
Table 2: Reports ofAverage Gait Speed 1*
20s 1.39 1.41 30s 1.46 1.42 40s 1.46 1.39 50s 1.39 1.40 60s 1.36 1.30 70s 1.33 1.27
Poor balance or balance disorders are also common causes of falls in the elderly population
[13]. The SBT is usually applied in assessing an individual's balance. There are many versions of this test, such as standing with one leg off the ground for as long as possible without external
support. A time standing in this manner for more than 30 seconds corresponds to a low fall risk.
Another version is standing with both feet side by side, and then slightly staggered. From this
version, the change in pressure along each foot, or postural sway can be extracted to characterize
the balance of an individual [2].
1.4 Research Goals and Outline
The purpose of this study is to understand different joint movement patterns between younger
and older adults when performing common physical therapy tasks for assessing fall risk and
specifically whether a new metric for coordination (RCM) can be used to quantify performance
while completing these tasks. This metric may further help clinicians characterize how a patient
executes a task. To this end, the research questions of this study are:
1. Is there a statistically significant difference in the TUGT times between Older and Younger Adults with a total population of seven participants?
2. What can be inferred from the RCM between one young subject and one old subject that
can be applied for further investigation?
This thesis paper will describe the experimental setup and procedure carried out by the participants,
as well as explain the methods for data analysis. The results of the experiment will be presented
2. Methods
2.1 Experimental Design
Data was acquired from seven healthy individuals who participated in the experiment. Four
of the participants ranged from 18-30 years of age (M = 22.25, SD = 0.96) and three participants were above the age of 60 (M = 67, SD = 3.46). Exclusion criterion included any neurological,
blood, heart, or lung problems, surgeries done within six months of the experiment, and inability
to perform tasks of the experiment without an assistive device. Each participant supplied a written
informed consent and the protocol was approved by the MIT Committee of the Use of Human as
Experimental Subjects. Each subject received up to $25 compensation for participating.
Each participant executed three distinct activities: 1 OMWT, a Standing Balance (SBT), and
TUGT. The 1 OMWT involved walking along a path that was 10m long and the SBT involved standing straight with feet placed shoulder-width apart for 40 seconds. The TUGT initialized with
the participant sitting on a stool, standing up, walking towards and around a marker, and ending
with the participant seated on the stool. There were two 1OMWT trials, 6 SBT trials, and 15 TUGT
trials. One 1 OMWT and 3 SBT trials were performed before and after the 15 TUGT trials as a
measure of any fatigue effects in this study. The first five trials of the TUGT were used as practice
runs to reduce any test anxiety the participants may have experienced and were therefore not used
for analysis.
The participants' movements were recorded using a 14-camera motion capture system
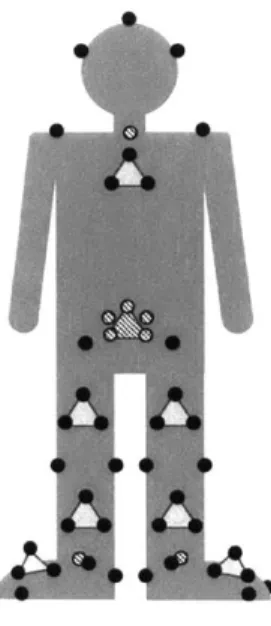
(Bonita, VICON Inc., USA) at 100 Hz. A total of 48 reflective markers were placed along the legs,
foot, torso, and head. Eight IMU sensors (APDM Opal) were strapped on the legs, waist, and chest.
0
* Located on front side of body
O Located on back side of body
Figure 1: Marker and IMU Placement. Circles represent individual markers
and white triangles represent IMU sensor.
For this study, the TUGT trials were analyzed using data acquired from the Vicon Camera system.
2.2 Data Processing
All marker trajectories were recorded using the Nexus Motion Capture Software 2.5. This data was later processed using OpenSim 3.3. Markers were placed using a modified Cleveland
Clinic and Plug-in-Gait marker set [14]. The velocity of a Sternum marker was used to calculate
the beginning and end of each trial. This marker was selected because it encapsulated different
starting motion strategies, such as the subject leaning forward initially or the subject immediately
beginning to stand in the vertical direction. The first frames of each trial when the subject was still
were used to determine measurement noise within the system. The standard deviation (a) of
was designated as the starting point. The same method was applied to determine the end time of
the TUGT trial.
For the TUGT, the joint angles were extracted after applyin the inverse kinematics feature
using OpenSim Model gait2354. The joint angles were used to calculate the angular velocity for
the knees, hips, and angles of each trial. A 6th-order Butterworth filter (cutoff frequency of 10Hz)
was applied to the joint angular velocities. The L2- norm angular velocity was then calculated for
the filtered joint angular velocities using the following equation:
Fn()2
>N ~t) In2[=
N * Jt
where N is degrees of freedom of the limb, ozn is the angular velocity of the joint axis n at some
time t,jN is a normalization parameter specific to the joint axis, and J is a normalization parameter
for all joint axes. There are several normalization methods that affect the value ofjN and Jt. In this
paper, the RCM was normalized by angular velocity, where jN is the maximum angular velocity
for the joint axis and J is 1. From this, the RCM (p12) is defined as:
p1 2(t) = 2 tan-1
)
900 [2]The resulting RCM ranges from -90' to +90', and is split into 4 zones. Zone 1 ranges from
-200 to +20', Zone 2 is from 120'1 to 140%l, Zone 3 is from 140'1 to 160, and Zone 4 is from 16001 to
19001. Zone 1 indicates the highest level of coordination. If p12 is more than 0', then segment 1
dominates motion between the two segments. If p12 is less than 00, then segment 2 dominates
The knee was defined to have 1 DoF, while the hip had 3 DoF and the ankle had 2 DoF.
The RCM was calculated for the Right Hip-Right Knee pairing and the Right Knee- Right Ankle
pairing for Subject 3 from the Young group and Subject 1 from the Older group.
2.3 Statistical Analysis
The TUGT total times were used for statistical analysis. The times from the Younger group
and the Older group were compared and analyzed using a Two-Sample T-Test for Unequal
Variance with an alpha of 0.05. The average total times for each subject were also compared
graphically (Figure 2). The RCM calculations were presented graphically and interpreted by which
3. Results & Discussion
The data collected from the TUGT for each subject was processed and analyzed. The time to complete each task was calculated for each trial. Figure 2 is a box plot that illustrates the data set for each subject.
3.1 Total Time for TUGT
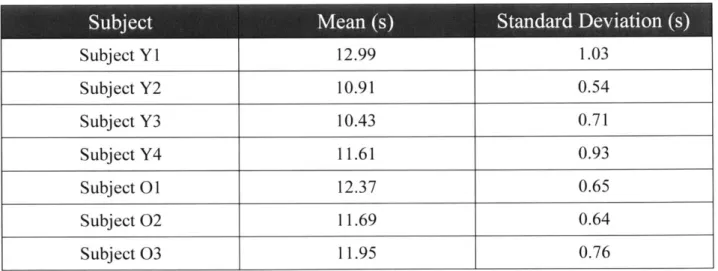
Using the information gathered from the trials, the mean and standard deviation for each
subject were calculated.
Table 3: Subject Average TUGT Times
Subject Y1 12.99 1.03 Subject Y2 10.91 0.54 Subject Y3 10.43 0.71 Subject Y4 11.61 0.93 Subject 01 12.37 0.65 Subject 02 11.69 0.64 Subject 03 11.95 0.76
The overall average TUGT time for the younger age group was 11.48s 0.40s. The older
group had a slightly higher average of 12.06s 0.26s. The average for the older group leans
towards the higher side of the TUGT times listed in Table 1 and is similar to results reported by
Hughes [8] and the Daubney & Culham [8]. The average for the younger age group is higher than
the norms listed in Table 1. This difference from published norms is driven by the high TUGT
By using the T-Test, it was found that the data support a difference in mean TUG between young and older groups (t = 1.998, p = 0.017). Here the older group had a significantly greater mean than the younger group, which is consistent with the literature.
As seen in Subject Yl's box in Figure 2, its overall median is the highest out of the
subjects'. This may have been due to the level of fatigue the subject was experiencing prior to the
experiment. For all subjects, it was instructed that they walk at a self-selected, comfortable pace,
which may explain why the total TUGT times from all subjects are in the higher end of TUGT
times reported in other studies (Table 1). This is also a small sample size, which means it may not
be the best representative sample of the population.
Subject TUGT Time
16 -15 -14 F 13 -E 12 -_ +K 11 10 -
-Subject Y Subject Y2 Subject Y3 Subject Y4 Subject 01 Subject 02 Subject 03 Subject
Figure 2: Box Plot of Subject TUGT Times. The red lines are the median values, the bottom and top blue lines are the lower to upper quartile range, encompassing 50% of the data. The black whiskers include data within 25%-75% of the data. Red crosses represent outliers.
It was previously noted that TUGT time fall risk vary. Here, all participants were below
the 14 second fall risk threshold defined by Howcroft. This is expected since all subjects that
3.2 Relative Coordination Metric between Two Subjects
As mentioned before, all participants walked at their own pace. Unlike time to complete
the task, a performance metric can further characterize a subject's gait throughout the task. The
RCM was calculated for one subject from each population, Subject Y3 and Subject 01. The right
Hip-Knee and Knee-Ankle RCM for five trials was calculated for both subjects.
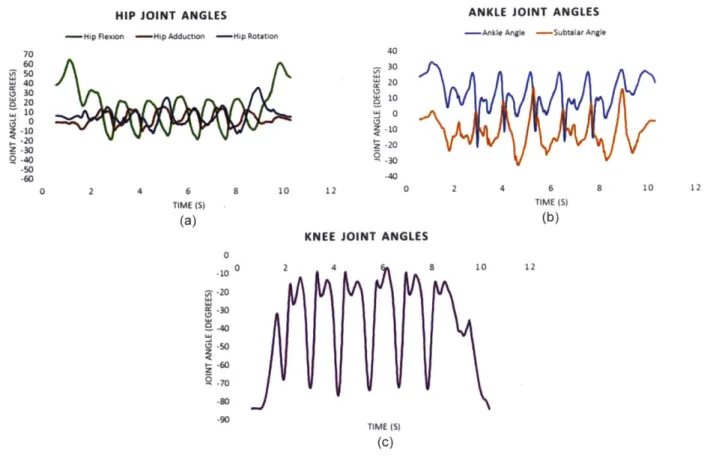
The joint angles were extracted from OpenSim for the time interval that encompassed the
start and end of the TUGT movement. Figure 3 and 4 illustrate the progression ofjoint angles over
time of a single trial for each subject.
HIP JOINT ANGLES
- Hip Rexion - Hip Adduction - Hip Rotation
70 60 A w40 W 30 20 -10 -40 -50 .60 0 2 4 6 a 10 12 TIME (S) (a)
ANKLE JOINT ANGLES
-Ankle Angle -Subtalar Angle 40 30 W 20 0 J- 10 ki -20 -- 30 -40 0 2 4 6 8 10 TIME (S) (b)
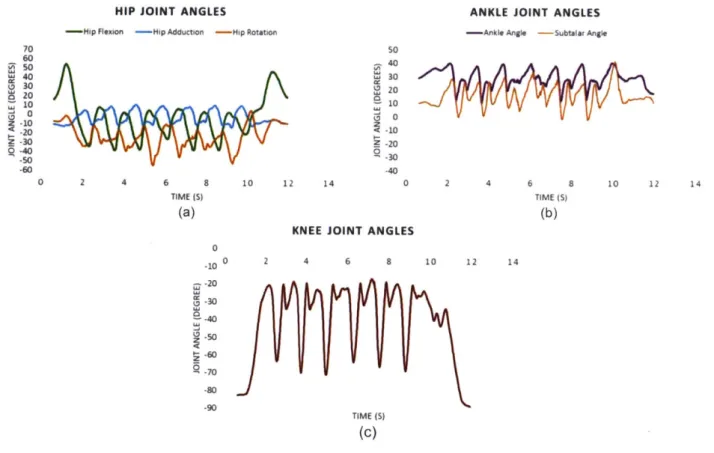
KNEE JOINT ANGLES 0 0 2 4 8 10 -20 -30 tz--60 .70 -80 -90 TIME (S) (c) 12
Figure 3: Hip, Ankle, and Knee Joint Angles for Subject Y3 for Trial 1. The hip has three
rotational axes and therefore 3 DoF. The ankle has two rotational axes and DoF. The knee can only bend in along one axis, where 00 is the fully extended position.
HIP JOINT ANGLES ANKLE JOINT ANGLES
- Hip Feuon -Hip Adduction - Hip Rotation - Ankle Angle - Subtaler Angle
70 s0 60 40 C 2 0 L 230 20 -10 10 210 - 20 -- s0 -60 -40 0 2 4 6 a 10 12 14 0 2 4 6 8 10 12 14
TIME IS) TIME ()
(a) (b)
KNEE JOINT ANGLES
0 -tr 0 2 4 6 8 10 12 14 -20 ItD -30 e 0 -- 4 0.-50 t_-60 5-70 _80 -go TIME (S) (c)
Figure 4: Hip, Ankle, and Knee Joint Angles for Subject 0 1 for Trial 1. The hip is split into
three axes: flexion, adduction, and rotation. The ankle has two DoF as shown by the two linies.
The knee's joint angle ranges from 900, which was the starting and ending position, to 00.
The two subjects show similar trends in joint angle movement over time, but there are some
distinctions between the two. For example, the peaks in joint angles for the knee remain just around
20* for Subject 01, whereas Subject Y3's knee angle consistently exceeds 200. Subject Y3 reached
a fuller extension of the leg than Subject 01.
The hip joint angles also vary in each subject. Subject 01 has a larger range of motion in
flexion and rotation of the hip, while Subject Y3 has a more constrained range. For hip flexion,
both subjects had similar peak values, but Subject 01's motion flexes farther, to a value of -40'.
The subject's larger motion about this axis may indicate that the toes were pointing away from the
sagittal plane of the participant.
The joint angle progression was differentiated to obtain angular velocity over time of each
joint's axes. Equation (1) was used to obtain normalized angular velocity. The use of equation (2)
output the RCM over time. These results of a single trial are illustrated in Figure 5 and Figure 6.
Y3 Hip-Knee RCM 0 01 U *0 0 0.1 0.2 0.3 0.4 0.5 0.6 0.7 0.8 0.9 1 Normalized Time (s) (a)
Figure 5: Hip-Knee RCM (a) and Knee-Ankle corresponds to Zone 1, green to Zone 2, orange
01 Hip-Knee RCM 100 80 60 40 20 0 -20 -40 40 -80 -100 0 0.1 0.2 0.3 0.4 0.5 0.6 0.7 0.8 0.9 1 Normalized Time (s) (a) 100- 80-60 40 20 0 -20 -40 -80 -10W Y3 Knee-Ankle RCM 0 0.1 0.2 0.3 0.4 0.5 0.6 0.7 Normalized Time (s) (b)
RCM (b) for Subject Y3. Yellow to Zone 3, and blue to Zone 4.
01 Knee-Ankle RCM e a 01 e 0 U 80 60 40 20 0 -20 -40 -60 -80 0 0.1 0.2 0.3 0.4 0.5 0.6 0.7 0.8 0.9 1 Normalized Time (s) (b) 100 80 60 40 20 0 0 -20 -40--60 -80 -100 0 0.8 0.9 1 - - -.10 n
The graphs above are normalized over time so that it ranges from 0 to 1. Due to the DoF
normalization used in Equation (1), the RCM results may be skewed away from the hip or ankle
which have more DoF than the knee. Normalizing by degrees of freedom for joint axes that have
smaller ranges of motion could be overcorrections, therefore skewing this RCM data slightly.
These data are interpreted considering this potential limitation. A statistical analysis was not
performed for the RCM results, and were instead interpreted qualitatively.
For Hip-Knee, it appears that Subject Y3 enters +Zone 4 more than in Subject 01. This
indicates a more dominant use of the hip in this motion for Subject Y3 for this trial. For
Knee-Ankle, it appears that both subjects have very similar behavior, both favoring +Zone 4,
corresponding to more knee usage.
Five trials from each subject were used to calculate the RCM zones for Hip-Knee and
Knee-Ankle pairings. Figure 7 illustrates the how often a subject remained in each zone across all
five trials.
The zone frequency for Hip-Knee RCM differs quite noticeably between the younger and
older subject. The hip dominates motion for Subject Y3. Each trial reported a frequency between
64% and 69% for an RCM between +Z2 and +Z4. There was a very low overall frequency for the
negative zones. There are hardly any points in time that reach -Z4, which would have indicated
any instances of significant knee dominated motion. It also reports a moderate median frequency
r
Y3 Frequency in Zone for Hip-Knee RCM 45 Knee 4 W Hip 40 -35 30 - 25-20 -15 10 -5 - E===9 0 -Z4 -Z3 -Z2 Zi +Z2 +Z3 +Z4 Zone (a)
01 Frequency In Zone for Hip-Knee RCM 45 Knee - Hip 40 35 30 25 20 --15 -10 =-1 + 5 A
Y3 Frequency In Zone for Knee-Ankle RCM
41 44 3 2 U-2 1 4 4 3 2 2 1 1. -Z4 -Z3 -Z2 Zi +Z2 +Z3 +Z4 -Z4 -Z3 -Z2 Zi +Z2 +Z3 +Z4 Zone Zone (c) (d)
Figure 7: RCM Zone Boxplot. Each box represent the percentage of time the RCM was in a
specific zone over five trials. The dotted line divides the plots into whichever joint dominates motion in that half. Plot (a) describes the RCM Hip-Knee for Subject Y3, Plot (b) describes the RCM Knee-Ankle for Subject Y3, Plot(c) describes the RCM Hip-Knee for Subject 01, and Plot (d) describes the RCM Knee-Ankle for Subject 01.
The plot for Subject 01 contrasts these outcomes. Rather than being dominated towards
the hip, coordinated motion is more dominated towards the knee. It also has more instances that
reach -Z4 compared to +Z4. The amount of time spent in the negative zones ranges from 49% to
56%. Ankle 4 1P Knee 0 - 5-Z-(b)l 5 -0 5 0 -Z4 -Z3 -Z2 21 +Z2 +Z3 +Z4 Zone (b)
S01 Frequency in Zone Ifor Knee-Ankle RCM
5 Ankle 1P Knee 0 - 5-5- + C eL
Both subjects seemed equally coordinated for the Knee-Ankle RCM. Subject Y3 had a
median of 23% in ZI, while Subject 01 had a slightly lower value of 21%. Overall, both appear
to have a knee-dominated motion. Both subjects' RCM were between +Z2 and +Z4 for about twice
the amount of time than in the negative zones. Future work will more closely evaluate the
progression of RCM over time for more subjects and RCM pairings, as well as understand the
4. Conclusion
This paper focused on observing joint patterns and coordination differences between older
and younger adults when doing a TUGT. The TUGT incorporates aspects of balance, gait speed,
and lower limb coordination. It is also fitting in determining an individual's fall risk. The TUGT
times were extracted from each subject and were found to be consistent with other TUGT studies
(Table 1). The TUGT times each subject were used to determine a significant statistical difference
between the two age groups. The RCM for two subjects from each age group was also calculated
and observed over the time it took to complete a TUGT. Several differences in RCM values
between an older subject and a younger subject were seen. Future work will explore RCM
References
[1] "Important Facts about Falls". Centers for Disease Control and Prevention. Accessed
May 6, 2017. https://www.cdc.gov/homeandrecreationalsafety/falls/adultfalls.html [2] Howcroft, J., Kofman, J., Lemaire, E. "Review of fall risk assessment in geriatric
populations using inertial sensors", Journal of NeuroEngineering and Rehabilitation, August 2013.
[3] Peters, D., Fritz, S., Krotish, D. "Assessing the Reliability and Variability of a Shorter Walk Test Compared With the 10-Meter Walk Test for Measurements of Gait Speed in Healthy, Older Adults", Journal of Geriatric Physical Therapy, Vol. 36, 24-30, 2013.
[4] Principle ofNeural Science (5 th Edition), Edited by Eric Kandel et all. (New York:McGraw-Hill, Health Provisions Division, 2013), 748.
[5] Vander Linden, D., Brunt, D., McCulloch, M. "Variant and Invariant Characteristics of the Sit-to-Stand Task in Healthy Elderly Adults", Arch Phys Med Rehabil, Vol. 75, June 1994.
[6] Harnish, A. et all. "Effects of Evidence-Based Fall Reduction Programming on the Functional Wellness of Older Adults in a Senior Living Community: A Clinical Case Study", Frontiers in Public Health, Vol. 5, Dec. 2016.
[7] Bischoff H.A. et all. "Identifying a cut-off point for normal mobility: a comparison of the timed 'up and go' test in community-dwelling and institutionalized elderly women", Age Ageing, Vol. 32, No. 3, 315-320, May 2003.
[8] Shumway-Cook, A., Brauer, S., Woollacott, M. "Predicting the Probability for Falls in Community-Dwelling Older Adults Using the Timed Up & Go Test", Physical Therapy, Vol. 80, No. 9, 896-903, Sept. 2000.
[9] Bergmann J.H , Alexiou C, Smith I.C. "Procedural differences directly affect timed up and go times," Journal of the American Geriatrics Society, Vol. 57, No. 2, 2168-2169, Nov. 2009.
[10] Bohannon, R.W. "Reference Values for the Timed Up and Go Test: A Descriptive Meta-Analysis", Journal of Geriatric Physical Therapy, Vol. 29, No. 2, 64-68, 2006.
[11] Iluz T. et all. "Can a Body-Fixed Sensor Reduce Hiesenberg's Uncertainty When It Comes to the Evaluation of Mobility? Effects of Aging and Fall Risk on Transitions in Daily Living", J Gerontol A Biol Sci Med Sci, Vol. 71, No. 11, 1459-1465, 2016. [12] Bohannon, R. W. (1997). "Comfortable and maximum walking speed of adults aged
20-79 years: reference values and determinants." Age Ageing 26(1): 15-19.
[13] Salzman, B. "Gait and Balance Disorders in Older Adults", American Family Physician, Vol. 82, No. 1, 61-68, July 2010.
[14] Hamner, S. et all. "Collecting Experimental Data", OpenSim Documentation. Last modified 2017.
[15] Fineman, R. and Leia Stirling. "Quantification and Visualization of Coordination During