The Outlook for Agriculture and
Rural Development in the Americas:
A Perspective on Latin America and the Caribbean
Global and regional
context
LAC countries face a complex global scenario, with lower
economic growth, greater volatility, trade restrictions and the
need to act against climate change.
CHAPTER 2. Global and regional context
The latest International Monetary Fund report (IMF 2019) estimates that 2019 growth rates will decrease in almost three quarters of countries. Global growth, which reached a maximum of 4 % in 2017, softened to 3.6 % in 2018, and is projected to decline to 3.2 % in 2019 and return to 3.5 % in 2020 (IMF 2019). The institution acknowledges, however, that the expected rebound in global growth, backed by lower interest rates and fiscal and monetary stimuli in some of the major global economies, depends on the stabilization of emerging markets and resolution of trade disputes., which, at the close of the preparation of this report, would not seem to be fulfilled in the coming months.
Growth in the euro area is estimated to decrease to 1.3 % in 2019 and 1.6 % in 2020, down from 1.9 % in 2018. The latest growth data for the second quarter of 2019 show, however, that the slowdown could be even greater and that the risk of recession in Europe is real: Germany and the United Kingdom showed a contraction in growth of 0.1 % and 0.2 %, respectively, while the Gross Domestic Product (GDP) stabilized in Italy. In the United States, growth is expected to decrease from 2.9 % to 2.6 % in 2019 and even more so in 2020, reaching 1.9 %, due to the reduction of the fiscal stimulus (IMF 2019).
In 2019, global growth will also be affected by the performance of emerging
and developing economies. Economic growth in China, despite the fiscal stimulus, is projected to slow down in 2019 and 2020, from 6.6 % in 2018 to 6.2 % and 6.0 % in subsequent years. The forecast incorporates the increase in US tariffs, from 10 % to 25 %, on USD 200 billion of exports from China, which occurred in May 2019. In India, growth is projected to increase slightly, from 6.8 % in 2018 to 7.0 % in 2019 and to 7.2 % in 2020, backed by the continued recovery of investment and consumption.
Trade disputes between China and the United States intensified in August, following the announcement that the United States will impose tariffs on other Chinese imports valued at USD 300 billion. In retaliation, China introduced additional tariffs on imports of USD 75 billion from the United States. The weighted average of Chinese tariffs on US imports will increase from 20.7 % to 21.8 % on September 1 and to 25.9 % on December 15, at which time 69 % of US exports to China will be affected. These developments triggered strong stock market fluctuation, a decrease in oil prices and increased capital outflows from emerging economies. Given the inconclusive state of trade negotiations, there is a growing risk that trade tensions will intensify further in the future. As trade disputes become widespread, the global growth outlook has deteriorated (UN 2019).
LAC countries face a complex global scenario, with lower economic growth,
greater volatility, trade restrictions and the need to act against climate change.
2.1.
Economic growth prospects
More than
two thirds of the
expected deceleration in global
economic growth is explained by
a decrease advanced economy
growth (IMF 2019).
Global economic growth of
3.5 %
is projected in 2020
(IMF 2019).
In LAC, a GDP growth slowdown is expected in 2019, to 0.5 %, compared to 1.1 % in 2017 and 0.9 % in 2018 (CEPAL 2019). The expected slowdown for China and for emerging countries, coupled with a lower growth rate in the United States, the eurozone and, in general, in developed economies, has impacted the recovery in LAC.
Recently disclosed data show that, as in the case of the euro zone, the LAC slowdown could be even worse than expected: the two largest regional economies, Mexico and Brazil, have only just avoided official entry into recession (the first with zero growth and the second with a positive rate of 0.4 %), defined as two consecutive quarters of contraction. These economies
are also expected to remain weak for the remainder of the year.
The weak economic performance in LAC has resulted in an increase of informal employment and unemployment, which in the case of urban areas reached a regional average of 9.3 % (ECLAC 2019). Also, lower growth rates translate into direct impacts on several SDGs, particularly SDGs 1 (end of poverty) and 2 (zero hunger). It is estimated that between 2014 and 2016, when the region presented slightly negative growth rates, poverty, extreme poverty (especially in rural areas) and undernourishment levels increased, reversing the trend from years of greater economic growth (FAO et al. 2018).
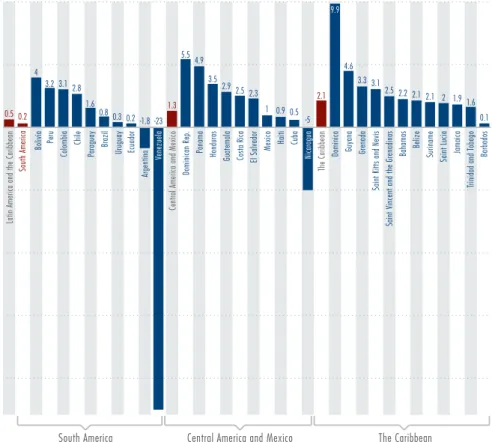
The dynamics of economic growth
in LAC tend to differ between
countries and subregions but, this
year,
the slowdown should be
more widespread, affecting 21
of the 33 countries in the region
(Figure 2.1).
Figure 2.1: GDP growth projections for 2019 (%)
South America Central America and Mexico The Caribbean
Latin America and the Caribbean
South America
Bolivia Per
u
Colombia
Chile
Paraguay Brazil Uruguay Ecuador
Argentina
Venezuela
Central America and Mexico
Dominican Rep.
Panama Honduras
Guatemala Costa Rica El Salvador Mexico Haiti Cuba
The Caribbean
Dominica Guyana Grenada
Saint Kitts and Nevis
Saint V
incent and the Grenadinas
Bahamas Belize Suriname Saint Lucia Jamaica
Trinidad and T obago Barbados 0.5 0.2 4 3.2 3.1 2.8 1.6 1.3 5.5 4.9 3.5 2.9 2.5 2.3 1 0.9 0.5 -5 2.1 9.9 4.6 3.3 3.1 2.5 2.2 2.1 2.1 2 1.91.6 0.1 0.8 0.3 0.2-1.8 -23 Nicaragua
Source: Prepared based on data from (ECLAC 2019).
ANÁLISIS SECTORIAL
2.2.
Risks of an even more
intense slowdown
Some of the main international agencies (IMF 2019, World Bank 2019, CEPAL 2019) enumerate several risks that could lead to an even greater deceleration of global economic performance in the remainder of 2019 and in coming years. These risk factors, which are detailed below, are also valid, to a greater or lesser extent, for the growth of LAC economies. Global growth projections assume a low probability of recession in the United States, the recovery of growth in the euro area economies as, among other factors, a no-deal Brexit is avoided, and the gradual reduction of growth in China, thanks mainly to the maintenance of a robust internal consumption. An eventual adverse change in these assumptions, given the importance of the economies mentioned, would reduce global growth directly and through real and financial linkages. Stimuli measures continue to strengthen the short-term
outlook in these countries but could contribute to a more abrupt slowdown in the future, insofar as structural weaknesses are not addressed. On the other hand, in the United States and China, despite the stimuli, the activity may not meet expectations if trade disputes are not eased.
In the financial domain, a harder-than-expected global market adjustment, including a rapid revaluation of the US dollar, would mainly impact emerging economies and could lead to a lower global growth rate. In 2018, as a result of trade disputes and the normalization of interest rates in the United States, there was an increase in risk, financial volatility and capital outflow from emerging markets, including LAC, while the dollar appreciated in a sustained manner versus most currencies. Regionally, double-digit depreciations in Argentina, Brazil and Jamaica stand out (CEPAL 2018).
Projections indicate that the
dollar will probably remain
strong in the coming years
compared to the values reached
at the beginning of this decade,
which could boost
inflation in
several countries, especially those
that are food importers.
The lethargy of world trade has been at the center of economic analysis in recent years because of its impact on economic growth. In April, the World Trade Organization (WTO) reduced its forecast for 2019 world trade (volume) growth to 2.6 %, which is about one third of the annual growth achieved between 2003 and 2007. However, given the escalation of the trade conflict between the United States and China since May, to which other countries have been added, this forecast now seems overly optimistic1.
Indeed, the outset of 2019 showed negative year on year growth in world trade volumes, something not observed since the global crisis of 2008-2009 (CEPAL 2019).
At the regional level, the threat of a progressive tariff increase on Mexican exports by the United States as a possible retaliation for the illegal migration flowremains ongoing and could also impact the evolution of LAC exports and growth. While some countries may benefit from short-term trade diversion, the increase in trade protectionism can have a negative impact on investment and productivity, with higher price levels and greater trade policy uncertainty.
Finally, the prospect of lower corporate profitability could reduce financial market confidence and further drag growth (IMF 2019, World Bank 2019). In summary, the trade conflict between the United States and China affects the economic outlook for LAC, even as some countries have seen short-term gains due to a trade flow deviation. There are several channels through which economic activity in LAC could be affected. First, 55 % of the region’s exports are destined for either China and the United States,. Slower demand growth in the two countries would have a notable impact throughout the region. Secondly, the trade conflict puts downward pressure on commodity prices, including oil and metals. In early August, copper prices fell to the lowest level in two years, causing export revenues in Chile and Peru to decrease significantly. Third, the trade conflict adds to economic instability, which is already high in several countries, including Argentina, Brazil and Mexico, due to internal policy issues. High levels of instability hampers investment and capital flows to the region, reducing the prospects for recovery (UN 2019).
2.3.
International trade
slowdown
1The escalation of the trade conflict began when the United States raised tariffs applied to Chinese products valued at USD 200 billion
from 10 % to 25 %, to which China responded with a similar increase applicable to US products worth of USD 60 billion. The United States also excluded India from the Generalized System of Trade Preferences, to which the country acted in retaliation by raising tariffs on 28 US products (CEPAL 2019). According to (World Bank 2019), in 2018 the administration of the United States had already raised tariffs on imports valued at about USD 300 billion, mainly from China. In response, other countries had retaliated with tariffs worth approximately USD 150 billion in US exports. In total, new tariffs had been imposed on approximately 12 % of US imports last year.
Commodity prices are
expected to drop around 5 %
in 2019 as a result of reduced
economic activity and trade
(CEPAL 2019).
The intensification of
trade
protectionism could have a
negative impact on investment
and productivity in the medium
term.
World economic growth trends and projections discussed in the previous section have several implications for the agriculture sector. Economic growth in emerging economies is and will continue to represent more than double the projected growth rate for developed countries in the coming years. Consequently, the share of emerging and developing economies in world GDP will continue to increase. China, India and Southeast Asian countries should account for most of this increase.
In parallel, although world population growth is slowing (expansion of just under 1 % per year over the next decade, compared to an annual rate of 1.4 % in the 1990s and 1.2 % in the 2000s), in some regions the population will continue to expand at higher rates, especially in low-income countries. In addition, more people now live in cities (54 %) than in rural
areas, and the urbanization process is expected to accelerate as the population grows. Population growth and urbanization generate changes in food patterns and in the dynamics of the agri-food system (FAO 2018).
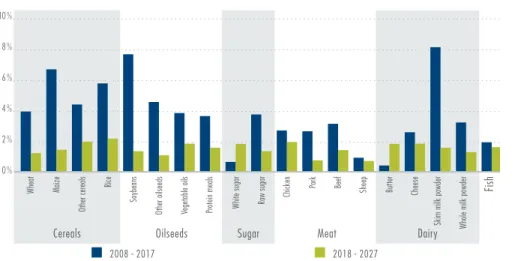
Global per capita consumption of various agricultural products is expected to remain relatively flat in the coming years (Figure 2.2). This is the case for some basic foods such as cereals, roots and tubers, but also for other products such as meat. According to the data in Figure 2.2, global demand among the large food groups will grow over the next decade, but with the exception of dairy products, growth will decelerate versus the previous decade. While the average growth rates observed between 2008 and 2017 for these large food groups has been 2.4 % per year, an average increase of 1.4 % is forecast for the next ten years.
A slowdown in global agricultural demand and international prices is expected with respect to the last decade.
2.4.
Growth prospects in agricultural demand and
production
Figure 2.2: Annual growth in global demand for groups of agricultural products, 2008-17 and 2018-27
Cereals Meat Fish Dairy Sugar Vegetable oils
2008 - 2017 2018 - 2027 2008 - 2017 2018 - 2027 2008 - 2017 2018 - 2027 2008 - 2017 2018 - 2027 2008 - 2017 2018 - 2027 2008 - 2017 2018 - 2027
Increase in per capita food consumption Population growth
5.0 % 4.5 % 4.0 % 3.5 % 3.0 % 2.5 % 2.0 % 1.5 % 1.0 % 0.5 % 0.0 %
Source: The authors, based on data from (FAO and OECD 2018).
Situación y Perspectivas de la Agricultura y la Vida Rural: Una mirada a América Latina y el Caribe 2019-2020 | CEPAL FAO IICA
This increase in global demand for agricultural products will lead to a rise in production of about 1.3 % per year over the next decade, achieved mainly from intensification and enhanced efficiency (see section 3.2.1), while the expansion of agricultural area will be minimal (OECD and FAO 2019). Crop reallocations are expected in response to changes in demand and relative prices. For some crops, soybeans in particular, land will play a more important role, since both an expansion of the cultivated area and the intensification of production are expected in Brazil and Argentina. The availability of improved seeds, fertilizers and digital technologies (see section 3.2.2) will favor the rise in production, but concerns about sustainability, such as those reflected
in SDG 12 (sustainable production and consumption) and climate change can impose restrictions (see section 3.2.1). One of the consequences of the stabilization of per capita consumption is that population growth will be the main determinant of the increase in food demand in the next decade. Thus, most additional food consumption will originate in regions with high population growth, such as sub-Saharan Africa, India and the Middle East and North Africa. As several of these countries are food importers, trade in agricultural products is expected to continue increasing in the next decade, although at a slightly slower pace than in the previous decade (OECD and FAO 2019).
The projections indicate a need of
less than
100
million additional
hectares for agricultural use in
2050 (FAO and OECD 2018),
that is, an increase of about 2 %
compared to 2012 levels.
Emerging and developing
economies should account for
more than four fifths of
the projected increase in global
demand for meat, cereals and
oilseeds over the next decade
(USDA 2018).
The share of emerging and
developing economies in world
GDP is expected to increase from
38 %
in 2018 to
45 %
in
2027 (USDA 2018).
ANÁLISIS SECTORIAL
Trade expansion is forecasted for all major agricultural products, but especially for rice, other cereals, chicken, vegetable oils, butter and white sugar (Figure 2.3). Only white sugar and butter are expected to show trade acceleration versus growth from the last decade. The expected deceleration is evident: while between 2008 and 2017 world trade of the main agricultural products grew at an average rate of 3.7 % per year, between 2018 and 2027 it is estimated that its growth will be limited to 1.5 % per year. (OECD and FAO 2019) still stresses that net exports will tend to increase from regions and countries with abundant land, especially in the Americas, while countries with a high population density or high population growth should experience an increase in net imports (FAO and OECD 2018). The expansion of agricultural production over
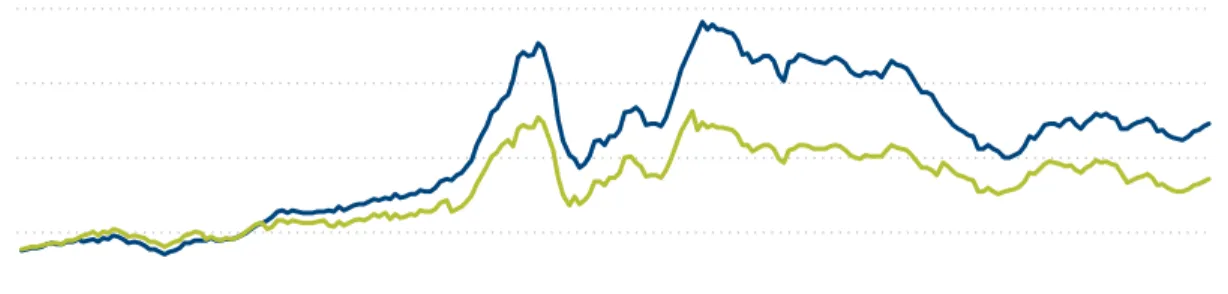
the next decade should be sufficient to meet the increase in world demand and keep real price growth null or negative. Since mid-2016, the FAO food price index has shown some stability, but at a higher level than in the early 2000s, both in nominal and real terms (figure 2.4). This behavior has been observed for all groups of agricultural products whose price indexes are calculated by FAO (cereals, meats, dairy products, oils and sugar) (FAO 2019).
Compared to other commodities, the prices of agricultural products and especially metals rose in the last year, while the price of energy fell sharply, driving a reduction of 6.9 % in the IMF primary commodity price index since the second half of 2018. It is possible that commodity prices will fall again in 2019 (CEPAL 2019).
2.5.
Evolution of agricultural
trade and prices
The origin of
agricultural
exports will be increasingly
concentrated in some countries.
This might increase the
vulnerability of agricultural
markets to supply shocks derived
from natural and political factors.
Lower
energy prices treduce
agricultural production costs while,
in contrast, higher
interest
rates and a greater volatility
of financial flows can increase
borrowing costs and limit farmers
access to credit (see section on
agricultural financing 3.3.2).
FAO and OECD (2018) estimate
that the FAO food price index
will increase
0.7 %
per year
over the next decade, in nominal
terms, and will decrease on
average
1.5 %
per year in real
terms.
Figure 2.3: Trade growth for major agricultural products, in volume.
Cereals Oilseeds Sugar Meat Dairy
Fish
Wheat Maize
Other cereals
Rice
Soybeans
Other oilseeds Vegetable oils Protein meals White sugar Raw sugar
Chicken Pork Beef Sheep Butter Cheese Skim milk powder Whole milk powder
2008 - 2017 2018 - 2027 10 % 8 % 6 % 4 % 2 % 0 %
Source: The authors, based on data from (FAO and OECD 2018).
Situación y Perspectivas de la Agricultura y la Vida Rural: Una mirada a América Latina y el Caribe 2019-2020 | CEPAL FAO IICA
Over the next few years, international prices should continue to adjust downwards for most agricultural products. Both nominal and real prices are expected to remain below the maximum levels reached between 2008 and 2014, but above the levels observed in the early 2000s. This behavior is a consequence of downward price pressure expected to prevail over the next decade on an increase of productivity. Since the prices of different agricultural products (cereals, oilseeds, dairy products and meat, for example) are highly correlated, similar behavior is projected across the board: falling in real terms, but with levels that will remain above the low prices of the early 2000s. Some dairy products are an exception, whose prices are projected to move upwards.
Despite the general downward trend in agricultural prices in real terms, the risk of sudden price increases, as a consequence of crop failures and other supply shocks, remains valid. It is important to stress that demand, production and price projections made by FAO and OECD (2018) reflect structural trends and average climatic conditions that do not take into account possible unforeseen events that could increase volatility, including extreme weather events. In that sense, a recent study (Chatzopoulos et al. 2019) relaxed the assumption of average weather conditions and modeled the implications of extreme weather events for agricultural markets. The study reveals important production effects from extreme weather events, such as heat waves, droughts and heavy rains, which are expected to occur more frequently and to last longer in many areas in the next decades (IPCC 2019)2.
Figure 2.4: FAO Food Price Index, in nominal and real terms
1/2000 4/2000 7/2000 10/2000 1/2001 4/2001 7/2001 10/2001 1/2002 4/2002 7/2002 10/2002 1/2003 4/2003 7/2003 10/2003 1/2004 4/2004 7/2004 10/2004 1/2005 4/2005 7/2005 10/2005 1/2006 4/2006 7/2006 10/2006 1/2007 4/2007 7/2007 10/2007 1/2008 4/2008 7/2008 10/2008 1/2009 4/2009 7/2009 10/2009 1/2010 4/2010 7/2010 10/2010 1/2011 4/2011 7/2011 10/2011 1/2012 4/2012 7/2012 10/2012 1/2013 4/2013 7/2013 10/2013 1/2014 4/2014 7/2014 10/2014 1/2015 4/2015 7/2015 10/2015 1/2016 4/2016 7/2016 10/2016 1/2017 4/2017 7/2017 10/2017 1/2018 5/2018 7/2018 10/2018 1/2019 4/2019
Nominal Real
Source: The authors, based on data from (FAO 2019).
2Depending on the duration and intensity of extreme events, the estimated impacts on national production range from -28 % (Australia) to +41 % (Kazakhstan) for wheat, from -49 % to +68 %
(South Africa) for corn, and from -12 % to +13 % (United States) for soy. These impacts lead, in turn, to significant differences in national and international crop prices compared to a situation with average conditions. In general, domestic prices could vary from -10 % (Kazakhstan) to +125 % (Pakistan) for wheat, from -21 % to +310 % (South Africa) for corn, and from -24 % to +58 % (India) for soy. In general, the extreme events analyzed would lead to lower competitiveness of exports, a greater dependence on imports, a lower self-sufficiency and, occasionally, a temporary price volatility compared to an average scenario FAO-OECD (2019).
ANÁLISIS SECTORIAL
Food production in 2050 will have to increase by 50 % versus 2012 levels to meet the growing global demand for food that results frompopulation growth and changes in consumption patterns (FAO 2018). One implication of this will be greater pressure on natural resources and the environment. The growing demand for food and other agricultural products raises the question of how the sector will be able to expand production and, above all, if it can do so sustainably. More than a third of the world’s agricultural land is moderate to highly degraded, according to FAO data, and there are few areas where agricultural land could still be expanded. In addition, agriculture is estimated to be the main driver of around 80 % of deforestation worldwide. Furthermore, water withdrawals for use in agriculture represent about 70 % of total water withdrawals (IPCC 2019), with significant differences between countries and regions. With urbanization and climate change, the availability of water is increasingly concentrated, and supply and demand of water do not necessarily coincide in time and space (FAO 2018). Finally, in the case of energy, the agrifood sector, including agriculture and the food industry, consumes about one third of the energy generated globally.
Agriculture and its impact on land use, such as deforestation, are the second
main source of Greenhouse Gas (GHG) emissions, with a share of about 23 % worldwide, reaching up to 37 % when considering the whole agrifood sector, that is, including pre- and post-harvest activities (IPCC 2019). In the case of LAC, the sector’s participation in GHG emissions is even higher, especially in South American countries, given the importance of livestock as a source of methane emissions (see Figure 2.5). Despite estimates that world agriculture will boost production to meet the projected food demand for the coming decades through the incorporation of technology and increasing yields, there are risks that this will not occur due to, among other factors, an intensification or acceleration in the impacts of climate change (see box 2.1). The sector cannot, therefore, be excluded from practices for climate change mitigation, and must also actively participate in adaptation practices. The adaptation of the agricultural sector to climate variability and extreme events should serve as a basis to reduce its long-term vulnerability. The necessary change should be towards decoupling, that is, an agricultural production that releases less GHG emissions per unit of food. Adaptation will require new investments in infrastructure, risk management, and varietal adaptation (See technology practices and options in section 3.2.1).
2.6.
Demand for natural
resources and climate
change
Si se tiene en cuenta que casi
un tercio de los alimentos
producidos se pierde o se
desperdicia, hay un gran margen
para reducir la presión sobre los
recursos naturales simplemente
disminuyendo las pérdidas y
los desperdicios a lo largo de la
cadena.
The projections for 2050 suggest
an additional shortage of
natural resources for agriculture,
either through degradation or
increased competition from other
uses. These effects, on top of
stricter regulations, could limit
food production and increase
agricultural costs.
Since that almost a third of
produced food is lost or wasted,
there is a great margin to reduce
the demand for natural resources
simply by reducing losses and
waste along the food chain.
Perspectivas de la agricultura y del desarrollo rural en las Américas | CEPAL FAO IICA
Figure 2.5: Participation of different sources in GHG emissions, at global and regional levels, in percentages
Global South America Central America The Caribbean 47% 17% 38% 53% 11% 10% 13% 1% 12% 7% 20% 9% 13% 13% 3% 9% 9% 44% 20% 7% 11% 11% 11% 11%
Energy Industries International bunkers Transport Others Land use Agriculture
Source: The authors, based on data from FAOSTAT.
Box 2.1: Differentiated impacts of climate change
Climate is an essential input in agricultural production. Compared with the pre-industrial period, the 2006-2015 observed land surface air temperature has increased 1.53oC, almost double the increase registered over the same period for the global average temperature (0.87oC). Warming has resulted in increased frequency, intensity and duration of heat waves, while the frequency and intensity of droughts have also augmented in some regions (including South America). There has also been a rise in rainfall intensity on a global scale. Climate change has already negatively affected food security and terrestrial ecosystems while also adding to desertification and land degradation in many regions (IPCC 2019).
Most studies agree on the unequal impact of climate change. Adverse impacts are expected to be more intense in low- and middle-income countries, where agriculture is very important. In these countries, climate change may have a substantial negative impact on the availability of calories per capita, with consequences for food security and public health (FAO 2018).
Reallocations in the agricultural aptitude of different areas are expected, especially in low-latitude regions, which will imply the need for new investments in fixed assets and infrastructure for productive reconversion. In addition, greater concentration of production is projected in some countries and regions, which will increase global vulnerability to supply shocks and make international trade an even more important tool for food security.
ANÁLISIS SECTORIAL
Accelerated urbanization of emerging and developing economies and increasing internal and international migratory flows, especially among young people and men, are examples of demographic trends that are characteristic of LAC countries which help understand regional rurality in the XXI century. On the one hand, the share of the rural population in the total population is decreasing while, on the other hand, the rural population is increasingly older. In 1950 the rural Latin American population reached 94 million people, representing 58 % of the total population; by 2015 it was 122 million, which constituted about 20 % of the total population. In parallel, the proportion of the rural population over 65 moved from 3.2 % to 7.4 %, while the proportion of young people (age 15 to 29) has remained relatively stable at around 25-26 % of the rural population.
In LAC, the greatest portion of income is derived from work (CEPAL 2019) and, in the rural areas, despite the
growing importance of remittances and public transfers, wages and other remuneration from work remain the main source of income. Therefore, the development and well-being of rural areas depends largely on the dynamics of agricultural production and the labor market. The participation of agriculture in rural employment fell more than eight percentage points between 2000 and 2017, while the share of industry and especially, services, increased (see table 5.3 in annex).
In Latin American rural areas, sources of income have been diversified to include not only rural non-agricultural employment (RNAE), but also external sources of income, such as remittances and state programs. The available information reveals that, in half of the rural households, the RNAE has increased at a higher growth rate than the agricultural employment and that the income derived from the RNAE is on average higher than the agricultural wage (Escobar 2016).
2.7.
A new rurality
It is estimated that the
economically active population
in the rural areas of LAC is
about
50
million people, the
majority of whom are engaged in
agriculture.
Towards the end of this century
it is projected that the rural
population will represent only
10 %
of the total population
of the region, although much of
the natural resources on which
LAC depends for its growth will
continue to be concentrated in
rural areas (see section 3.1.1).
Situación y Perspectivas de la Agricultura y la Vida Rural: Una mirada a América Latina y el Caribe 2019-2020 | CEPAL FAO IICA
Despite the socioeconomic progress achieved in LAC in the last decade, the region remains the most unequal in the world. One facet of this inequality is the development gap between urban and rural areas. The lags in rural labor markets, for instance, with respect to urban areas result in a much higher level of rural poverty compared to urban poverty.
The incidence of poverty is higher among people living in rural areas; children, adolescents and youth; indigenous people; women of working age; people with lower educational levels; and those whose basic needs are not met. While some of these gaps have narrowed since 2012, others have widened (CEPAL 2019).
Although the number of small farmers with low productivity represents more than 90 % of total agricultural holdings in the region, they are in possession of only 23 % of the agricultural land, according to FAO estimates. The average size of family farms in the region is 13 hectares, but, if the Southern Cone is excluded, the average is reduced to 2.5 hectares. Self-employed agricultural workers and their unpaid family members, the majority of whom are family farmers (although definitions vary from country to country), have the lowest level of income among the different categories of labor insertion in rural areas.
Rural poverty is closely linked to the serious deficits of decent work in agriculture, and exacerbated by the weak presence of labor institutions in rural areas (Reinecke and Faiguenbaum 2016). OIT (2016) emphasizes that, despite the increase in agricultural productivity, there are still profound differences between the employment status of rural and urban workers (see section 3.1). To overcome poverty, labor policies must reach rural areas and must consider the specificities of their labor markets: a high contingent of family farmers, seasonal workers, high levels of informality, low female participation in paid positions and a higher incidence of child labor and forced labor. The seasonality and temporary work that is characteristic of agriculture pose limitations for the broadening of social security and demands innovations in the design of coverage systems, their administration and financing.
Stronger wage growth in the agriculture sector alone cannot contribute to reducing poverty and inequality in rural areas without extensions to the coverage of social security and labour benefits to agricultural workers. Additionally, the environmental dimension and sustainable use of natural resources, themselves contributors to competitiveness, should not operate as barriers to the entry of family farmers and less
2.8.
Poverty and inequality
Despite the significant progress
observed over the past 15 years,
poverty and extreme poverty
rates in rural LAC areas represent
about
1.8
times and
2.6
times, respectively, the rates of
urban areas.
ANÁLISIS SECTORIAL
qualified workers in agricultural markets. Instead, family farmers should be encouraged to take advantage of some of their assets in this area compared to industrial agriculture, such as the sustainability of their production practices and their pluriactive nature (Escobar 2016).
Generally speaking, rural poverty is associated with the existence of a large contingent (about
16.5
million
farms in LAC) of small agricultural producers with low productivity and with restricted access to land and public
goods.
Faced with the challenge of reducing poverty in the context of the SDGs, agriculture, by employing less-skilled
workers with the lowest incomes among all economic activities, can play a fundamental role (FAO 2018)
(see section 3.2).
Visit the website at www.agrirural.org to access the full report and other information resources that may be of interest to users: historic reports, technical bulletins, executive summaries, infographics, videos,
Economic Commission for Latin America and the Caribbean Headquartes: Av. Dag Hammarskjöld 3477, Vitacura, Santiago de Chile Telephone: (56-2) 2271-2000 • 2210-2000
Fax: (56-2) 2208-0252
PO Box: Casilla 179-D, Santiago de Chile Postcode: 7630412
E-mail: [email protected] Website: www.cepal.org
Food and Agriculture Organization of the United Nations Regional Office for Latin America and the Caribbean Av. Dag Hammarskjöld 3441, Vitacura Santiago, Chile
Telephone: (56-2) 2923-2100 E-mail: [email protected] Website: www.fao.org/americas
Inter-American Institute for Cooperation on Agriculture Headquarters
PO Box: 55-2200 San José, Vázquez de Coronado Telephone: (506) 2216-0222
Fax: (506) 2216-0233 E-mail:[email protected] Website: www.iica.int