HAL Id: hal-00311411
https://hal.archives-ouvertes.fr/hal-00311411
Submitted on 29 Jul 2015
HAL is a multi-disciplinary open access
archive for the deposit and dissemination of
sci-entific research documents, whether they are
pub-lished or not. The documents may come from
teaching and research institutions in France or
abroad, or from public or private research centers.
L’archive ouverte pluridisciplinaire HAL, est
destinée au dépôt et à la diffusion de documents
scientifiques de niveau recherche, publiés ou non,
émanant des établissements d’enseignement et de
recherche français ou étrangers, des laboratoires
publics ou privés.
during the Hibiscus campaign
F. Fierli, G. Di Donfrancesco, F. Cairo, Virginie Marecal, M. Zampieri, E.
Orlandi, Georges Durry
To cite this version:
F. Fierli, G. Di Donfrancesco, F. Cairo, Virginie Marecal, M. Zampieri, et al.. Variability of cirrus
clouds in a convective outflow during the Hibiscus campaign. Atmospheric Chemistry and Physics,
European Geosciences Union, 2008, 8 (16), pp.4547-4558. �hal-00311411�
Atmos. Chem. Phys., 8, 4547–4558, 2008 www.atmos-chem-phys.net/8/4547/2008/ © Author(s) 2008. This work is distributed under the Creative Commons Attribution 3.0 License.
Atmospheric
Chemistry
and Physics
Variability of cirrus clouds in a convective outflow during the
Hibiscus campaign
F. Fierli1, G. Di Donfrancesco2, F. Cairo1, V. Mar´ecal3, M. Zampieri1, E. Orlandi1, and G. Durry4,5
1Istituto di Scienze dell’Atmosfera e del Clima, CNR, Italy 2Ente Nazionale Energia e Ambiente, Dipartimento Clima, Italy
3Laboratoire de Physique et Chimie de l’Environnement, CNRS and Universit´e d’Orl´eans, France 4Groupe de Spectroscopie Mol´eculaire et Atmosph´erique, CNRS and Universit´e de Reims, France 5Service d’A´eronomie, CNRS and Institut Pierre et Simon Laplace, France
Abstract. Light-weight microlidar and water vapour
mea-surements were taken on-board a stratospheric balloon dur-ing the HIBISCUS 2004 campaign, held in Bauru, Brazil (49◦W, 22◦S). Cirrus clouds were observed throughout the flight between 12 and 15 km height with a high mesoscale variability in optical and microphysical properties. It was found that the cirrus clouds were composed of different lay-ers characterized by marked differences in height, thickness and optical properties. Simultaneous water vapour obser-vations show that the different layers are characterized by different values of the saturation with respect to ice. A mesoscale simulation and a trajectory analysis clearly re-vealed that the clouds had formed in the outflow of a large and persistent convective region and that the observed vari-ability of the optical properties and of the cloud struc-ture is likely linked to the different residence times of the convectively-processed air in the upper troposphere.
1 Introduction
Upper tropospheric ice clouds in the tropics (tropical cirrus) have a major effect on the terrestrial climate. Cirrus cover up to 20% of the whole Earth surface and up to 50% in the trop-ical region (Liou, 1986; Wang et al., 1996) and significantly impact on the Earth’s radiative balance. They reduce the in-coming solar radiation by reflection and absorb the upward infrared radiation emitted in the lower atmosphere.
The result may be a reduction in the net outgoing long-wave radiation, causing a heating of the atmosphere (Hart-mann, 1993). Such heating should be more efficient in the
Correspondence to: F. Fierli
stratosphere if the impact of the tropopause level tropical cir-rus is included (Ackerman et al., 1988; Folkins and Martin, 2005). However, the effective impact of cirrus on the radia-tive balance depends also on several parameters such as un-derlying surface conditions, cloud height and thickness, and ice crystal size distribution.
Deep convection transports moist air from the ground to the upper troposphere and cirrus can form in hydrated air. In turn, the cirrus remove humidity through crystal formation and sedimentation thus influencing the water vapour budget in the tropical tropopause layer (TTL). Although it is well known that the air enters the stratosphere overworld after up-welling in the tropics (Holton et al., 1995), the mechanism of upward transport in the TTL is still uncertain. The main outflow of tropical deep convection is found around 13 km height (350 K potential temperature). Although (Gettelman et al., 2002) showed that convective overshooting episodes are too rare to transport enough mass to supply the Brewer Dobson circulation, the water budget of the TTL is still cur-rently under discussion.
Additional vertical transport in the TTL is provided by di-abatic air mass lifting or descent induced by the radiative im-pact of cirrus. Nevertheless, a definitive picture of the dy-namics related to radiation-cloud interaction is still unclear. Fueglistaler and Fu (2006), using Atmospheric Radiation Measurement (ARM) cloud measurements in the tropics, es-timate that the increased short-wave radiation reflected by high altitude clouds is compensated by the reduced infrared radiation resulting in a cooling effect in the lower strato-sphere. The modelling experiments by Corti et al. (2006) indicate that the cirrus cloud-radiation interaction can offer a pathway for upward mass transport in the tropical tropopause region.
All these processes are dependent on the cloud persis-tence, the cloud spatial and vertical extension, and its par-ticle size distribution. Therefore, it is important to char-acterize the microphysical properties of the upper tropo-spheric ice clouds, and to clarify the mechanisms leading to their formation. The processes involved in the forma-tion and maintenance of tropical cirrus are not completely understood because few detailed measurements of their mi-crophysical properties are available. The Center Equato-rial Pacific Experiment (CEPEX) analysis (McFarquhar and Heymsfield, 1996) showed that the cirrus ice crystal dimen-sion is related to the convective age and that particles with larger radar cross-sections are found nearer to the convective core. Pfister et al. (2001) identified two classes of cirrus from a comprehensive analysis of data from the Tropical Ozone Transport Experiment/Vortex Ozone Transport Measurement (TOTE/VOTE) experiment. The first class comes from par-ticle and water vapour detrainment from convection. The second class of clouds is related to deep convection moist-ening but its formation is not directly linked to convective outflows. Once formed, the cirrus layers are maintained by dynamical or radiative processes. Massie et al. (2002) com-bined extinction data obtained by the Halogen Occultation Experiment (HALOE) and trajectories from the European Center for Medium-range Weather Forecasting (ECMWF). They found that half of the HALOE cirrus observations in the maritime continent originates from deep convection de-trainment while the remaining part is likely to be formed by in-situ processes.
Microlidar optical observations of cirrus clouds were ac-quired on a stratospheric balloon on 24 February 2004 from 22:00 UTC (Short-duration Flight 4, SF4) in the framework of the 2004 HIBISCUS campaign (Pommereau et al., 2007). The HIBISCUS balloon experiment took place during the 2004 wet season in Bauru, Brazil (49◦W, 22◦S). Bauru is located in a continental region where deep convection is very frequent (Liu and Zipser, 2005). The aim of the present pa-per is to identify convection as the formation mechanism of the tropical cirrus clouds observed by the ballonborne lidar and to correlate the differences in the cirrus microphysical characteristics with the variability of the convective process-ing of airmasses. A mesoscale meteorological model simu-lation and a trajectory analysis are used to link the observed clouds to previous convection activity, to estimate the con-vective age of the observed cirrus clouds (defined as the time elapsed between the convective uplift and the observation) and to correlate it with the observed optical properties.
Section 2 presents a description of the synoptic situation based on satellite measurements, the Microlidar observations and the comparison with simultaneous water vapour observa-tions. Section 3 describes the mesoscale model simulations performed to estimate the convective age of the cirrus layers and its correlation with the observed properties. The main findings of the paper are outlined in the conclusions (Sect. 4).
2 Observations
2.1 Satellite observations
A persistent convective activity was recorded in central Brazil during the three days prior to the SF4 balloon flight. The South-America continental region was characterized by a positive precipitation anomaly during February 2004. In particular, from 20 to 24 February, the region of Bauru was under the influence of the South Atlantic Convergence Zone (SACZ). The SACZ gives rise to a large region of intense convection originating from the Amazon basin and extend-ing south-eastward.
The first row in Fig. 1 reports the GOES-12 (Geosta-tionary Operational Environment Satellite) infrared radiative temperature measurements from the 10.7 µm channel ev-ery 12 h from 22 February at 15:00 UTC to 24 February at 15:00 UTC. The large scale convection structure and the wet air outflow associated to the SACZ can easily be seen. Convection develops during the days prior to the SF4 flight preferentially in the nighttime in a vast region north-east of Bauru. The convective systems are triggered at the location of a well marked frontal interface directed NW-SE which ap-proximately extends from the center of the analyzed domain to its S-SE boundary. The convective activity has a clear di-urnal cycle on 22 and 23 February. The GOES measurements from 14:45 UTC on 24 February show that convection devel-ops earlier than on the previous two days.
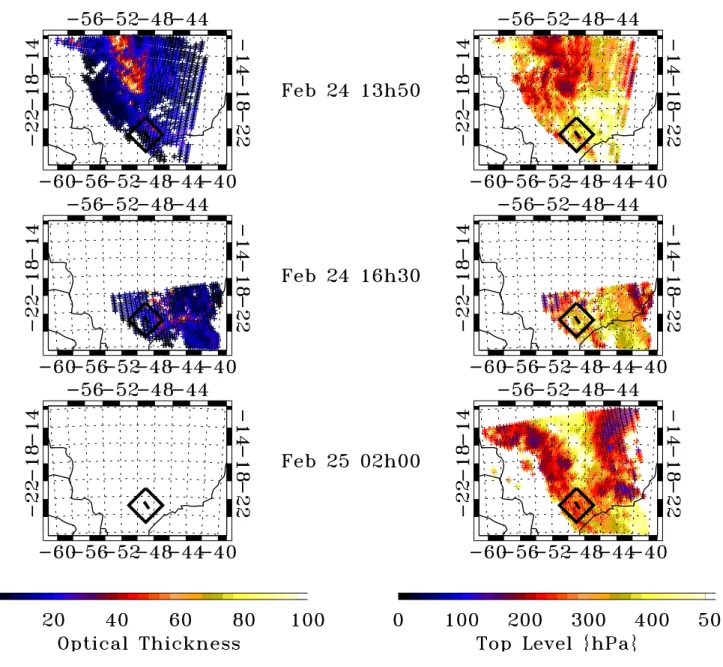
Additional information on the cloud type and on the out-flow structure comes from the observations of the Moder-ate Infrared Spectrometer (MODIS) onboard the TERRA and AQUA satellites. MODIS provides an estimate of Cloud Top Pressure (CTP) and optical thickness at nadir (for details see King et al., 1997). The closest overpasses were at 13:50 UTC on 24 February (11 h before SF4), at 16:30 UTC on 24 Febru-ary (6 h before SF4) and at 02:50 UTC on 25 FebruFebru-ary (4 h after SF4). These observations are displayed in Fig. 2 where only clouds with top pressures above the 500 hPa pressure level are plotted. From a comparison with ground-based radar observations, MODIS data show a positive bias in optical thickness and underestimate the cloud top height (Mace et al., 2005). Dessler and Yang (2003) discussed the cloud parameter uncertainties and estimated the thin tropical cirrus distribution based on optical thickness measurements from MODIS Terra 1.375 µm channel. Since MODIS ob-servations were not simultaneous with SF4, it is not possi-ble to correlate them directly with the lidar observations to infer additional information on the observed clouds. Nev-ertheless the detection and the extension of optically thin clouds in the convective outflow complement the informa-tion obtained from the GOES data analysis. On 24 Febru-ary (Fig. 2 top panels) a large convective region is located North of the balloon measurement site with several convec-tive towers reaching a cloud top pressure lower than 150 hPa. The overall structure of the convective systems agrees well
F. Fierli et al.: Cirrus in a convective outflow 4549
Fig. 1. Above: from left to right, infrared radiance temperature from GOES-12 10.7 µm channel from 22 February 15:00 UTC, to 23 February 15:00 UTC. The position of SF4 flight is indicated with the black cross. Below: as above, but for infrared radiance temperature retrieved from BOLAM mesoscale model with RTTOV radiative transfer model.
with the GOES observations at 14:45 UTC (Fig. 1, top right panel). The optical thickness (Fig. 2, left panel) also shows that convective clouds are optically thick (up to 100) while the western part of the convective region (55◦W, 15◦S to
44◦W, 28◦S) is characterized by a large and elongated cloud with optical thicknesses lower than 20 and top heights be-tween 250 and 150 hPa. This is a signature of cirrus gener-ated from the outflow of convective systems and transported south-eastward by the upper tropospheric jet located at the west side of the SACZ. Despite the partial spatial coverage, data at 16:30 UTC (middle panels) do not show the pres-ence of high clouds in the SF4 measurement region (black box in Fig. 2). Data from the following day (Fig. 2, bot-tom panels) show the presence of large convective systems at 18◦S latitude and smaller cloud systems east of Bauru. The SF4 region is characterized by optically thick clouds with variable heights. It is not possible to discriminate the pres-ence of cirrus clouds since they could be masked by thicker clouds located at a lower altitude. The combination of GOES and MODIS images suggests that during the SF4 flight the upper troposphere was clearly perturbed by ubiquitous and persistent convection from which large cirrus clouds formed. Therefore it is likely that the region sampled by the
microl-idar was influenced by both recent (up to 1 day) and aged (up to 3 days) convective outflows. Due to the MODIS time coverage, it cannot be demonstrated that cloud particles were present until the SF4 observation time. Additional details on the synoptic situation from TRMM (Tropical Rainfall Mea-surements Mission) for the 20–24 February period are given in Mar´ecal et al. (2007).
2.2 Balloon-borne Microlidar and Micro-SDLA hygrome-ter
The lightweight microlidar made continuous observations during the SF4 flight starting at 23:00 UTC on 24 Febru-ary 2004 and ending at 02:00 UTC on the following day. The microlidar observations shown in Fig. 3 were taken at the balloon floating altitude and during the first part of the descent, crossing the cirrus cloud between 00:00 UTC and 00:40 UTC on 25 February (corresponding to the abrupt stop in the measurements in Fig. 3). The microlidar acquires a vertical profile every 20 s. The horizontal resolution is 2 km given a constant drift speed of the balloon and the vertical resolution is 15 m. Details on the instrumental set-up are given in Di donfrancesco et al. (2006).
Fig. 2. Left: optical thickness estimated by MODIS imager onboard the TERRA satellite on 24 January 13:00 UT (above), on 24 January 16:30 UT (middle) and on 25 January 01:00 UT (below). The balloon position lies within the black box. Right: as left but for cloud top height.
The microlidar measures backscatter at parallel and per-pendicular polarizations at 532 nm wavelength. The backscatter ratio is defined as the ratio between the total backscattered radiation and the molecular backscatter: BSR = βm+βa
βm
(1)
βm is the molecular backscatter and βa is the aerosol
backscatter. βm+βais proportional to the lidar signal while
βmis calculated from density profile measured by the Bauru
radiosounding. The aerosol backscattered light is split in a parallel (βak) polarization and a perpendicular (βa⊥)
polariza-tion. The aerosol depolarization is defined as the ratio be-tween the two components:
D =100β
⊥ a
βak
(2)
Typical values of D in the presence of solid and aspheri-cal particles range from 10% to 70% and the different values of D are related to different scatterer dimensions and shapes. Dis thus used to identify the presence of particles in the ice phase, and, coupled with BSR, to classify the clouds in a qualitative way. The time evolution of BSR and D vs. height from SF4 flight is plotted in Fig. 3 (upper panel for BSR
F. Fierli et al.: Cirrus in a convective outflow 4551
Fig. 3. Above: aerosol backscatter ratio at 532 nm (BSR) func-tion of the flight time and height. The cirrus layers are enclosed in colored boxes as described in the text. Middle: same as above but for aerosol depolarization.Below: Aerosol backscatter ratio versus depolarization. Colors identify cirrus layers 1–3 (see text); dashed lines are the average D values, and solid lines the standard devia-tion.
and lower panel for D). Three distinct layers can be identi-fied: (1) a thin cirrus with low BSR (<10) and high D values (D>30%) cirrus layers between 13 and 15 km height during the second part of the flight (in the orange box in Fig. 3, top panel), (2) a thick cirrus characterized by high BSR values (up to 45) and low aerosol depolarization values (D<30%) around 13 km height during the first half of the flight (blue box) and (3) a thick cirrus with similar BSR and D values to layer (2) in the second part of the flight around 12 km height (red box). The different layers can be identified in Fig. 3 (lower panel) displaying the mean and the standard deviation of D as a function of BSR. The colors correspond to the lay-ers 1 to 3 in Fig. 3, top panel. Fig. 3 bottom panel shows that the optical properties of the layers 2 and 3 (blue and red lines)
Fig. 4. Left: Ice Relative Humidity measured by Micro-SDLA. Crosses indicates the presence of solid particles (BSR>1.4 and
D>10%). Data are averaged on the lidar time resolution. Middle: BSR (solid line) and D (dashed line). Right: Aerosol backscatter ratio versus depolarization. Colors identify RHI.
are similar with a large range of BSR values (1 to 60) and a quasi-constant value for D for BSR values greater than 20. Layer 1 (orange line) is characterized by BSR values ranging between 1 to 10 and higher values of D than in layers 2 and 3. The Micro-SDLA (balloon-borne diode laser spectrome-ter) hygrometer measured the water vapour in the gas phase on-board the SF4 simultaneously to the microlidar. The un-certainty of the Micro-SDLA water vapour measurements ranges from 5% to 10% (Durry et al., 2006). The Microlidar aerosol depolarization and the Micro-SDLA water vapour measurements are not fully coincident since the Microlidar data are screened for the layers nearest to the balloon lead-ing to a 500 m distance in the horizontal. Nevertheless the optical parameters are sufficiently uniform on the horizontal scale to assume that the 500 m shift has a negligible impact on the comparison and we can consider that the Microlidar and Micro-SDLA sampled the same airmasses. Figure 4 dis-plays the vertical profiles of the Microlidar backscatter ratio and depolarization together with the quasi-simultaneous wa-ter vapour profile measured by Micro-SDLA during the SF4 descent (25 February, 01:00 UT). For the comparison the Micro-SDLA water vapour data are averaged to match the Microlidar vertical resolution. The relative humidity with re-spect to ice (RHI) derived from Micro-SDLA measurements is also plotted in Fig. 4 and was calculated using the formula prescribed by the World Meteorological Organization for sat-uration pressure and the Marti and Mauersberger (1993) for-mula for saturation pressure over ice. The whole 11–15 km layer is supersaturated and RHI reach high values (135% to 140%) in three sub-layers. These sub-layers are located in cloud-free regions at 14.8 km, 13.4 km and at 12.4 km height while lower supersaturation values are measured inside the
cirrus clouds. This indicates that the water content in gas phase is reduced inside the cirrus clouds due to its conversion into ice. In the cirrus layers the supersaturation is higher and more variable (ranging between 125% and 130%) in the low-est cirrus cloud. Therefore the ice nucleation and subsequent growth by water vapour diffusion seem to be more efficient or lasted longer in the cloud layer above 12.4 km height. The right panel in Fig. 4 displays RHI and D as a function of BSR for the vertical profile. In the two distinct cirrus layers corresponding to the layers (3) and (1) identified in Fig. 3 dif-ferent RHI values and optical properties are measured. Layer (3) is characterized by high BSR values and high values of supersaturation while layer (1) shows lower BSR values and lower values of supersaturation. This can interpreted as fol-lows. Low BSR values reflect the presence of large ice parti-cles that reduce the gas phase water content through efficient vapour deposition while higher BSR values can be associated to a larger number of smaller ice particles corresponding to a lower ice water content and a lower rate of water vapour deposition. On the basis of the satellite observations, it can also be assumed that the cloud particle variability is linked to the time when nucleation started in the outflows of the differ-ent convective systems developing during the days preeced-ing SF4 flight. A recent work from Shibata (2007), based on joint ground-based lidar and balloon-borne water vapour measurements, shows a similar behaviour with BSR and RHI peaks inside high altitude tropical cirrus. Shibata (2007) at-tempts to calculate the particle size from the estimated ice water content and suggests that high values of BSR are as-sociated to small particles and a low ice water content. Sev-eral studies have tried to define a relationship between the lidar observed parameters (for instance D) and the scatterer microphysical properties. The modelling approach used in Liu and Mishchenko (2001) shows that the lidar depolariza-tion values are related to the shape of the cloud particles but are not representative of the particle size in the micromet-ric range. Sassen and Benson (2001) demonstrate that the depolarization can be linked to the local temperature to in-fer the transition in cirrus ice crystal shape and the internal crystallographic features. Combining simultaneous lidar and in-situ observations Noel et al. (2004) propose a correlation between the depolarization and the particle shape. Whiteway et al. (2004) identify the crystal families forming in different locations with respect to the convective core, using the in-situ observations from the EMERALD campaign (Egrett Micro-physics Experiment with RAdiation, Lidar, and Dynamics). Nevertheless the uncertainty remains too high to characterize quantitatively the microphysical processes occuring in con-vective outflows based solely on lidar observations. There-fore, the present work will focus on the correlation between the observed cirrus, the saturation variability at mesoscale and the macrophysical properties such as the cloud thermal history and the airmass convective age.
3 Mesoscale modelling
3.1 Model description
The convective transport properties for SF4 flight are an-alyzed with the BOLAM (BOlogna Limited Area Model) mesoscale model. BOLAM is a meteorological model based on the primitive equations in the hydrostatic approximation. The model variables are the horizontal wind components u and v, the potential temperature θ , the specific humidity q and the surface pressure ps. The 3-D variables are defined
in the vertical on hybrid coordinates and are distributed on a non-uniformly spaced Lorenz grid. The horizontal dis-cretization is based on geographical coordinates with lati-tudinal rotation on an Arakawa C-grid. A Weighted Aver-age Flux (WAF) scheme is used for the three-dimensional advection. The lateral boundary conditions are imposed by means of a relaxation scheme that minimizes the wave en-ergy reflection (Davies, 1976; Lehman, 1993). Deep convec-tion is parameterized with the scheme of Kain-Fritsch (Kain and Fritsch, 1990; Kain, 2004). The boundary layer scheme is based on the mixing length assumption and on the explicit prediction of turbulent kinetic energy (Zampieri et al., 2005). The surface turbulent fluxes are computed according to the Monin-Obukhov similarity theory. The parameterization of the effects of vegetation and soil processes (Pressman, 1994) is based on the water and energy balance in a four layer soil model. It includes the diagnostic computation of the skin temperature and of the humidity seasonally from the vege-tation effects, the evapo-transpiration and the precipivege-tation. The radiation is computed with a combined application of the scheme from Ritter and Geleyn (1992) and of the ECMWF operational scheme (Morcrette et al., 1998). Further details on the model are given in Buzzi and Foschini (2000). In order to analyse convection and transport processes influencing the region where SF4 flight was performed, the simulation starts 72 h before the observations (at 00:00 UTC on 22 February). The model has 60 vertical hybrid levels extending from the ground level to the top of the atmosphere defined at 0.1 hPa with denser levels near the ground. This leads to a vertical resolution of 500 m in the upper troposphere. The tal domain has 240×140 grid points with a 20 km horizon-tal resolution. BOLAM uses the microphysical scheme from Schultz (1995) that treats five categories of condensate: liq-uid cloud, pristine ice (cloud ice), rain, snow and graupel. The amount of pristine ice and the crystal growth by water vapour diffusion are both dependent on the supersaturation level and are parameterized via the average mass of a single nucleated pristine crystal and a conversion rate control pa-rameter. Ice removal is done through ice sedimentation, con-version to graupel, melting and evaporation. More details on the microphysical parameterization can be found in Schultz (1995).
F. Fierli et al.: Cirrus in a convective outflow 4553 3.2 Comparison with GOES data
The analysis of the convective outflow transport requires ac-curate simulations of the life cycle, location and height of the convective clouds. To evaluate the accuracy of the BO-LAM simulation a comparison is done between the GOES-12 data and the cloud radiance temperature at 10.8 µm esti-mated from the model thermodynamical and cloud variables with the RTTOV8.5 radiative forward model (Saunders and Brunel, 2004).
The simulated cloud radiance temperature fields simulta-neous to the satellite observations are shown in the bottom row in Fig. 1. The model convective activity is in good agree-ment with the GOES-12 observations. The BOLAM model reproduces well the large scale dynamics and the location of the convergence region where most of the convection occurs. It is also worth noting that the comparison is still good at the scale of individual convective systems. This is illustrated by the BOLAM outputs that reproduce the high clouds observed on the western side of the convergence zone on 23 February at 03:00 UTC, 24 February at 03:00 UTC and 15:00 UTC. Figure 5 displays the high cloud fraction as seen by GOES and by BOLAM in the geographical domain of Fig. 1. A threshold of 240 K for the radiance temperature maximum is used to select the high clouds. The BOLAM model repro-duces remarkably well the cloud cycle seen by GOES with a maximun of cloudiness at nighttime. It also underestimates the area covered by high clouds during the first part of the simulation while values quantitatively similar with the GOES data are obtained for the last 30 h of the simulation.
There is a general agreement between the BOLAM model and the GOES observations on the location and the lifetime of the main convective systems. This ensures that the dy-namics of the convection and the large scale flows simulated by the model are realistic except in areas where the BO-LAM model exhibits a positive bias the in cloud top temper-ature leading to an underestimation of the convective outflow height.
3.3 Water vapour
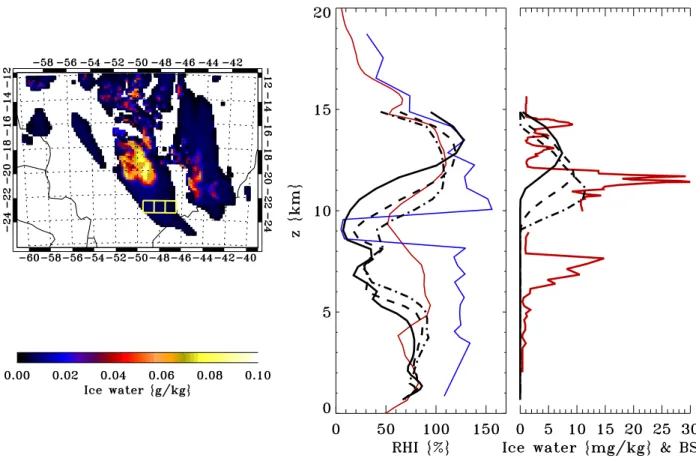
Figure 6, left panel, shows the BOLAM ice water content at 12 km height at 00:00 UTC on 25 February. Areas with enhanced ice water concentration (>0.05 g/kg) indicate the presence of active convection. The comparison with the MODIS cloud top heights in Fig. 2 at 02:00 UTC gives a good agreement in the overall position of the two main cloud systems. The SF4 region (western yellow box) is located on the border of the outflow simulated by the model while it appears to be closer to the outflow core in the MODIS ob-servations (Fig. 2 bottom right panel). Moreover MODIS shows that the SF4 region at 02:00 UTC is characterized by a variability of the cloud top pressure indicating the vicin-ity of the convective outflow. Since it is a nighttime mea-surement, it is not possible to couple this information with
Fig. 5. High cloud area fraction from GOES observations (red line) and BOLAM simulations (black line). The time of the images of Fig. 1 are reported on the x-axis as diamonds.
the optical thickness. The comparison with GOES obser-vations at 15:00 UTC on 24 February (Fig. 1 right panels) shows, similarly as the comparison with MODIS data, that the main convective region simulated by BOLAM is slightly shifted eastward with respect to the observations. In order to compare the model with the SF4 observations that sam-pled layers that are potentially influenced by the variability of the outflow, the BOLAM vertical profiles were averaged in boxes chosen at several longitudes to account for the possi-ble model shift in the location of the outflow. The horizontal size for the boxes is 1◦ latitude by 1◦ longitude. They are centered at (49.5◦W, 23◦S), (48.5◦W, 23◦S) and (47.5◦W, 23◦S) and are indicated as yellow boxes in Fig. 6 left panel. The SF4 descent is located around the center of the west-ern box. The RHI profiles derived from BOLAM (middle panel) show that the depth of the saturated layer increases with decreasing longitude while the supersaturation in this layer slightly decreases. Similarly to RHI, the ice water con-tent (right panel in Fig. 6) shows a longitudinal variation. The BOLAM model predicts the peak in ice water content in the supersaturated layer at a lower altitude for the eastern box (around 11km). The Microlidar observations exhibit an ice layer in the 12.5–14.8 km range which is in closer (quali-tative) agreement with the western part of the outflow and an ice layer in the 10.5–12 km altitude range which is in closer agreement with the eastern part of the outflow. The Micro-SDLA data interpolated at the BOLAM vertical resolution indicate that the modelled RHI at 49.5◦W is in good agree-ment with the observations in the highest cirrus layer while RHI at 48.5◦W and 47.5◦W agrees with the 10.5–12 km cir-rus layer but underestimates the supersaturation. It should be mentioned that the horizontally averaged BOLAM RHI
Fig. 6. Left: Ice water content from BOLAM at 12 km height on 24 January 23:00 UTC. Middle: Ice relative humidity from BOLAM averaged at (49 W, 23 S) (black), at (48 W, 23 S) (black dashed), and at (47 W, 23 S) (black dot-dashed), BRAMS (red) and Micro-SDLA, interpolated on the BOLAM vertical resolution (blue). Right: BOLAM ice water and Micro-lidar backscatter ratio (red).
values reach 110% and exceed 130% in several grid points from individual profiles and that the microphysical scheme allows higher supersaturation values during the ice formation since the equilibrium requires several model timesteps to be reached. Figure 6 also shows the BRAMS (Brazilian Re-gional Atmospheric Modeling System Mar´ecal et al., 2007) RHI for the SF4 flight interpolated at 48.5◦W that can be compared with the corresponding BOLAM profile (dashed line, middle panel in Fig. 6). BRAMS and BOLAM verti-cal resolutions are comparable. The agreement is satisfac-tory with both models reproducing the supersaturated layer between 10 and 15 km height and giving the same RHI val-ues. As mentioned above, the differences in the water vapour profile inside the outflow between the BRAMS and the BO-LAM models can be attributed to the variability of the ob-served and modelled outflow in the SF4 measurement area. It is also interesting to briefly discuss the stratospheric intru-sion at 9 km height. On one hand BOLAM shows extremely low water vapour contents leading to low RHI values (down to 10%) in good agreement with Micro-SDLA. On the other hand BOLAM simulates a twofold and thicker intrusion, ex-tending down to 5km altitude. BRAMS reproduces the intru-sion at the correct height but overestimates its water vapour
content. Below the intrusion, RHI from BOLAM agrees with BRAMS and both models are drier than Micro-SDLA mea-surements.
3.4 Trajectories
Since the location, the temperature and the humidity condi-tions experienced by air parcels are key parameters for cirrus formation, Lagrangian trajectories on the global and regional scale based on meteorological analysis have been used in the literature to analyse the water vapour transport and the freezing in the TTL (e.g. Fueglistaler et al., 2005) and to identify the different types of tropical cirrus (Pfister et al., 2001). Clusters of backtrajectories are used here to iden-tify the mechanisms leading to the formation of the observed cirrus during the SF4 flight. Trajectories are calculated from BOLAM using the on-line approach proposed by Gheusi and Stein (2002). The air parcel position is advected as a pas-sive tracer. In addition to the 3-D transport with explicitly resolved winds, the location fields are also modified by the parametrized diffusion and the convective transport using a mass-flux method to re-adjust the vertical position inside the convective cloud. Despite the uncertainties related to this
F. Fierli et al.: Cirrus in a convective outflow 4555
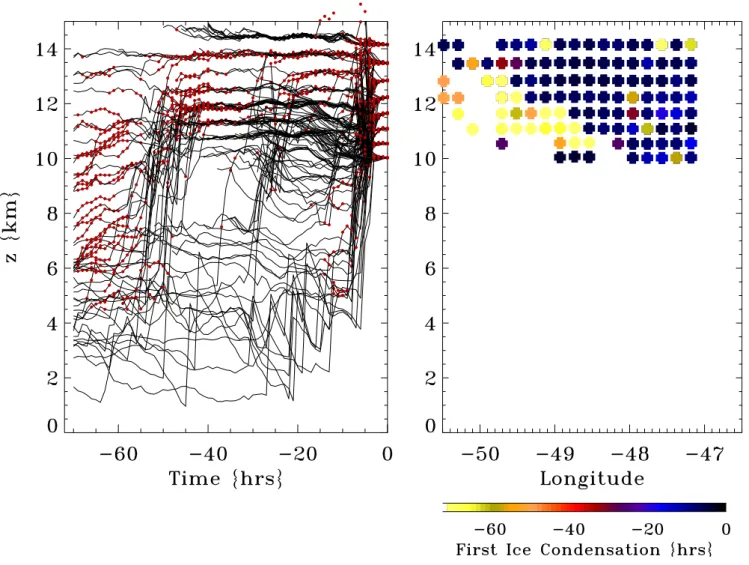
Fig. 7. Left: Cirrus airmass backtrajectory time evolution as a function of height. Small dots indicate the time and height where the ice saturation condition is satisfied for the first time. Right: Time tcinferred from the trajectories. tcis defined for each parcel as the earliset
time when ice water forms.
approach, Gheusi and Stein (2002) have demonstrated that the lagrangian evolution can be studied on a qualitative basis for relatively large trajectory clusters. In the present paper, this method was used off-line and a time interval of 3 h is used to calculate the trajectories. The trajectories are calcu-lated backward in time from 23:00 UTC, 24 February. They originate from the model grid points included in the region identified by the yellow boxes in Fig. 6 and range between 8 and 16 km height leading to about 3000 parcels. The water vapour, temperature, pressure and ice water fields are inter-polated from BOLAM outputs at each trajectory point. The left panel in Fig. 7 shows the altitude of the trajectories end-ing inside the BOLAM cirrus layer as a function of time to-gether with the time (height) when (where) the ice saturation condition is satisfied along the trajectories. A large fraction of the air masses is subject to a rapid uplift confirming that the main formation mechanism of the cirrus layers is the
hy-dration due to convective outflows. Three distinct periods of uplift can be identified 60, 30 and 6 h before the balloon measurements. They are well correlated with the maximum of convective activity shown in Fig. 5. The formation of ice occurs during the uplift and the ice phase water persists for the following 30 h in the airmasses that experienced the old-est convective ascents. It should be noted that the airmass at 13.8 km height shows the presence of cirrus for the whole set of trajectories. A few hours before the observation time, ice clouds form in air parcels experiencing the most recent uplift. The water vapour content along the trajectories (not shown) is higher for the parcels having experienced a recent uplift. The parcels processed by convection 60 h before the observa-tion are firstly dehydrated in the upper troposphere and then re-hydrated during the last 10 h presumably by mixing with moist air coming from the recent outflow. Ren et al. (2007) shown that the inclusion of the rehydration in a Lagrangian
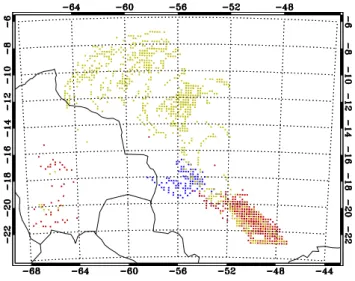
Fig. 8. Position of air parcels at time tcfor cluster (a) (yellow dots)
and cluster (b) (red dots). Blue dots indicate the position of air parcels at 13:30 UTC, 24 Febraury. See the text for the definition of clusters and the identification of the air parcels.
cirrus model provides more realistic results compared to in-situ observations. The question arises of whether different uplift times and the presence of ice water can be correlated to the observed optical differences in the cirrus layers. In order to establish such a link the ice formation age (tc) is estimated
for each observation point; tcis defined for each parcel as the
earliest time when ice water forms. The plot of tcas a
func-tion of height and longitude is displayed in the right panel in Fig. 7. Most of the layer is composed of ice formed in the re-cent outflow (tc<20 h) and older uplift (tc>45 h) is found in
the lower and western part of the layer. This means that the composition of the cirrus layer is determined by two different types of airmasses. This implies that the BOLAM cirrus at different longitudes (shown in Fig. 6, middle panel) form un-der different thermal and humidity conditions although they show similar ice water concentrations. In order to check the consistency of the thermal histories, trajectories are grouped in two clusters: (a) includes air parcels with tc>45 h and
cluster (b) tc<20 h. Figure 8 shows the geographical location
of tcfor cluster (a) (yellow points) and (b) (red points). Inside
cluster (a) the ice forms in a vast region north of 13◦S and in a well defined region centered around 53◦W, 12◦S. This is roughly consistent with the scattered convection structure ob-served on 22 February and the organized system obob-served on 23 February at 03:00 UTC shown in Fig. 1. The parcels com-posing cluster (a) are then advected in the upper troposphere on the south western part of the convective region located north of Bauru. The ice clouds within cluster (b) form pre-dominantly in the vicinity of the observation region during the convective uplifts on February 24. The trajectory analysis gives additional evidence of the large outflow variability with a transition between different tc during the SF4 flight. This
evidence is certainly qualitative, since the model uncertainty in positioning the convective outflow could affect the longi-tude where such transitions occur in Fig. 7 but is consistent with the observations. Blue points in Fig. 8 shows the posi-tion of the parcels composing cluster (b) on 23 February at 13:50 UTC simultaneous to the MODIS observations shown in Fig. 2 top panels. The satellite data confirm that cluster (b) lies in a region where cirrus are observed. The BOLAM tra-jectory analysis strengthens the picture of hydrated air com-ing from recent outflows and also shows a region with older convective age related to an identified transport from a large scale structure of convection. Moreover the two layers are characterized by a different time of occurrence of cloud ice and a different water vapour content along the trajectories.
Therefore the BOLAM simulation provides the elements to interpret the humidity and aerosol observations: the cirrus in the lowest layers (2 and 3 in Fig. 3) are composed by a larger number of crystals, as shown by higher BSR values, and can be linked to the airmasses with lower tc. A recent
crystal formation could also explain the higher RHI mea-sured by Micro-SDLA and the larger variability of aerosol backscatter ratio and humidity as seen in the observed ver-tical profile (Fig. 4). The higher cirrus layer (1) which is characterized by lower BSR and lower RHI values forms up to 60 h before the SF4. Despite the uncertainties due to the parametrized model microphysics the presence of ice water along the trajectories indicates that prolonged particle growth could form different types of crystals leading to lower BSR values, higher D and reduced RHI. Mixing processes between older and recent outflows should also be consid-ered. BOLAM trajectories indicate that clusters (a) and (b) end in adjacent regions. Finally it should be mentioned that the height of the aged convection outflow could be under-estimated by the BOLAM model. The comparison with the GOES data reveals that during the first part of the simulation BOLAM underestimates the cloud top temperature and the extent of convection. This implies that in reality the older outflow is injected at higher altitudes in the troposphere than the picture given in Fig. 7. This would lead to a reversed cirrus layering with cluster (a) above cluster (b). Under this assumption, the trajectories would fully explain the observed cirrus layering. The role of gravity waves detected in the BSR data cannot be proven. It is possible to assume that the waves superpose to the main formation process which is con-vective hydration leading to a modulation of the efficiency of ice freezing and to a more rapid formation of small ice par-ticles as shown by high BSR values in the core of the lowest layer.
4 Conclusions
The lidar observations from the flight SF4 performed during the Hibiscus campaign provide the evidence of two distinct cloud types based on their optical properties. The first class
F. Fierli et al.: Cirrus in a convective outflow 4557 is characterized by higher values of BSR and lower values of
Dwhile, for the second class, BSR has lower values and D higher values. The two types of clouds are observed at adja-cent locations and at close altitudes. From the D and BSR classification both clouds seem to fit the HACII typology proposed by Pfister et al. (2001) that is formed from recent and more aged (a few days old) convective outflows. The li-dar data analysis suggests that the two types of cirrus clouds could be further distinguished in terms of particle size and shape, reflecting different formation mechanisms and ther-mal histories. This is confirmed by simultaneous humidity observations that reveal a different water content for the dif-ferent cirrus typologies. The satellite data analysis and the modelling of transport confirm the convective origin of the two types of cirrus clouds. The SF4 flight was influenced by deep convection developing in a vast region north of Bauru during the days preceeding the flight leading to the uplift of moist air in the upper troposphere at different times. The mesoscale model simulation agrees well with the observa-tions of cirrus in supersaturated air above 11.5 km height and with the simulations carried out with an independent model. Moreover, the mesoscale simulations provide a ro-bust interpretation of the observed differences based on the different convective uplift times and water contents experi-enced along the trajectories. Despite the highly parametrized microphysics the mesoscale simulation reveals that the for-mation processes for the observed cirrus clouds are mainly related to the convection and associated transport that are generally well reproduced. This analysis that follows pre-vious observational studies confirms that the cirrus clouds can have a complex structure related to concurrent forma-tion processes. It should be stressed that the different parti-cle concentrations and dimensions, as inferred from the lidar data, can be related to the thermodynamic conditions experi-enced by the airmasses. This can have an impact on model estimates of the radiative and water vapour budgets in the upper troposphere which are crucial in the study of the upper troposphere and lower stratosphere climate systems and their feedbacks. The approach presented here for a single case study, that has provided a detailed analysis and an assessment of the parametrized model processes, could be extended in a statistical sense at the regional or global scales using satellite based and in-situ regular observations of cirrus.
Acknowledgements. This study was supported by the EU through the Hibiscus project of the VIFP. Maurizio Viterbini and Carlo Buontempo are acknowledged for their support in the field campaign. The ECMWF is acknowledged for providing the atmospheric analysis used in this work. Finally, the authors wish to thank Dominik Brunner for providing the GOES data.
Edited by: R. MacKenzie
References
Ackerman, T. P., Liou, K.-N., Valero P. J., and Pfister L.: Heating rates in tropical anvils, J. Atmos. Sci., 45, 1606–1623, 1988. Buzzi, A. and Foschini, L.: Mesoscale meteorological features
as-sociated with heavy precipitation in the southern Alpine region, Meteorol. Atmos. Phys., 72, 131–146, 2000.
Corti T., Luo, B. P., Fu, Q., Vomel, H., and Peter, T.: The impact of cirrus clouds on tropical troposphere-to-stratosphere transport, Atmos. Chem. Phys., 6, 2539–2547, 2006,
http://www.atmos-chem-phys.net/6/2539/2006/.
Davies H. C.: A lateral boundary formulation for multilevel predic-tion models, Q. J. R. Meteorol. Soc., 102, 405–418, 1976. Dessler, A. E. and Yang, P.: The Distribution of Tropical Thin
Cir-rus Clouds Inferred from Terra MODIS Data, J. Climate, 16, 1241–1247,2003.
Di Donfrancesco, G., Cairo, F., Buontempo, C., et al. : Balloon-borne Lidar for cloud physics studies, Appl. Opt., 42, 22, 5701– 5708, 2006.
Durry, G., Huret, N., Hauchecorne, A., Marecal, V., Pommereau, J.-P., Jones, R. L., Held, G., Larsen, N., and Renard, J.-B.: Isen-tropic advection and convective lifting of water vapor in the UT - LS as observed over Brazil (22◦S) in February 2004 by in situ high-resolution measurements of H2O, CH4, O3 and tempera-ture, Atmos. Chem. Phys. Discuss., 6, 12469–12501, 2006, http://www.atmos-chem-phys-discuss.net/6/12469/2006/. Folkins, I. and Martin, R.V.: The vertical structure of tropical
con-vection and its impact on the budgets of water vapor and ozone, J. Atmos. Sci.,62, 1560–1573, 2005.
Fueglistaler, S., Bonazzola, M., Haynes, P. H., Peter, T.: Strato-spheric water vapor predicted from the Lagrangian temperature history of air entering the stratosphere in the tropics, J. Geophys. Res., 110, D08107, doi:10.1029/2004JD005516, 2005.
Fueglistaler, S. and Fu, Q.: Impact of clouds on radiative heating rates in the tropical lower stratosphere, J. Geophys. Res., 111, D23202, doi:10.1029/2006JD007273, 2006.
Gettelman, A., Salby, M. L., and Sassi, F.: Distribution and influ-ence of convection in the tropical tropopause region, J. Geophys. Res.-Atmos.,1737–1746, doi:1029/2006JD004080, 2002. Gheusi, F. and Stein, J.: Lagrangian description of airflows using
Eulerian passive tracers, Q. J. R. M. S., 128, 579, 337–360, 2002. Hartmann, R. L.: Radiative effects of clouds on Earth’s climate. Aerosol-Cloud-Climate Interactions,International Geophysical Series, 54, Academic Press, P. V. Hobbs Editor, 151–173, 1993. Holton, J. R., Haynes, P. H. , Douglass, A. R., Rood ,R. B., and
Pfister, L.: Stratosphere-troposphere exchange. Rev. Geophys., 33(4),403–439, 1995.
Kain, J. S. and Fritsch, J. M.: A one-dimensional entrain-ing/detraining plume model and its application in convective pa-rameterization. J. Atmos. Sci., 47, 2784–2802, 1990.
Kain, J. S. and Fritsch, J. M.: Multiscale Convective Overturning in Mesoscale Convective Systems: Reconciling Observations, Sim-ulations, and Theory, Mon. Wea. Rev., 126, 2254–2273, 1998. Kain J. S.: The Kain-Fritsch convective parametrization: an update,
J. App. Meteorol., 43, 170–181, 2004.
King, M. A., Chee, S., Platinick, S. E., Wang, M., and Liou, K.: Cloud Retrieval Algorithms for MODIS: Optical Thickness, Ef-fective Particle Radius, and Thermodynamic Phase, Algorithm Theoretical Basis Document No. ATBD-MOD-MOD06 Cloud product, 1997.
Lehman, R.: On the choice of relaxation coefficients for Davies’ lat-eral boundaries scheme for regional weather prediction models, Meteorol. Atmos. Phys., 52, 1–14, 1993.
Liou, K.-N.: Influence of cirrus clouds on weather and climate pro-cesses: A global perspective, 1986, Mon. Wea. Rev., 114, 1167– 1200, 1986.
Liu, L. and Mishchenko, M. I.: Constraints on PSC particle micro-physics derived from lidarobservations, Journal of Quantitative Spectroscopy and Radiative Transfer, 70, 817–831, 2001. Liu, C. and Zipser, E. J.: Global distribution of convection
pene-trating the tropical tropopause, J. Geophys. Res., 110, D23104, doi:10.1029/2005JD006063, 2005.
Mace, G. G., Zhang, Y., Platnick, S., King, M. D., Minnis, P., and Yang, P.: Evaluation of Cirrus Cloud Properties Derived from MODIS Data Using Cloud Properties Derived from Ground-Based Observations Collected at the ARM SGP Site, J. Appl. Meteorol., 44, 221–240, 2005.
Mace, G. G., Benson, S., and Vernon, E.: Cirrus Clouds and the Large-Scale Atmospheric State: Relationships Revealed by Six Years of Ground-Based Data, J. Climate, 19, 3257–3278, doi:10.1175/JCLI3786.1, 2006.
Mar´ecal V., Durry G., Longo K., Freitas S., Riviere E.D. and M. Pirre: Mesoscale modelling of water vapour in the tropical UTLS: two case studies from the HIBISCUS campaign, Atmos. Chem. Phys., 7, 1471–1489, 2007,
http://www.atmos-chem-phys.net/7/1471/2007/.
Marti, L. and Mauersberger, K.:A survey and new measurements of ice vapor pressure at temperatures between 170 and 250 K, Geophys. Res. Lett., 20, 363–366, 1993.
Massie, S., Gettelman, A., Randel, W., and Baumgardner, D.: Dis-tribution of tropical cirrus in relation to convection, J. Geophys. Res., 107(D21), 4591, doi:10.1029/2001JD001293, 2002. McFarquhar, G. M. and Heymsfield, A. J.: Microphysical
charac-teristics of three anvils sampled during the Central Equatorial Pacific Experiment, J. Atmos. Sci.,53, 2401–2423, 1996. Morcrette, J. J., Clough, S. A., Mlawer, E. J., and Iacono, M. J.:
Impact of a validated radiative transfer scheme, RRTM, on the ECMWF model climate and 10-day forecasts. ECMWF Techni-cal Memo., 252, 1998.
Noel, V., Winker, D. M., McGill, M., and Lawson P.:Classification of particle shapes from lidar depolarization ratio in con-vective ice clouds compared to in situ observations dur-ing CRYSTAL-FACE, J. Geophys. Res., 109, D24213, doi:10.1029/2004JD004883, 2004.
Pfister, L., Selkirk, H. B., Jensen, E. J., et al.: Aircraft observations of thin cirrus clouds near the tropical tropopause, J. Geophys. Res., 106(D9), 9765–9786, 2001.
Pommereau, J.-P., Garnier, A., Held, G., Gomes, A.-M., Goutail, F., Durry, G., Borchi, F., Hauchecorne, A., Montoux, N., Coc-querez, P., Letrenne, G., Vial, F., Hertzog, A., Legras, B., Pisso, I., Pyle, J. A., Harris, N. R. P., Jones, R. L., Robinson, A., Hans-ford, G., Eden, L., Gardiner, T., Swann, N., Knudsen, B., Larsen,
N., Nielsen, J., Christensen, T., Cairo, F., Pirre, M., Marcal, V., Huret, N., Rivire, E., Coe, H., Grosvenor, D., Edvarsen, K., Di Donfrancesco, G., Ricaud, P., Berthelier, J.-J., Godefroy, M., Seran, E., Longo, K., and Freitas, S.: An overview of the HIBIS-CUS campaign, Atmos. Chem. Phys. Discuss., 7, 2389–2475, 2007,
http://www.atmos-chem-phys-discuss.net/7/2389/2007/. Pressman, D. J.: Chislennaja model’ gidrotermicheskikh
pro-cessov v pochve kak chast’ skhemy mezomasshtabnogo prog-noza (A numerical model of hydrothermical processes in soil as a part of a mesoscale weather forecast scheme), Meteorologiya i gidrologiya (Meteorology and Hydrology), 11, 62–75, 1994 (in Russian).
Ren, C., MacKenzie, A. R., Schiller, C., Shur, G., and Yushkov, V.: Diagnosis of processes controlling water vapour in the tropical tropopause layer by a Lagrangian cirrus model, Atmos. Chem. Phys., 7, 5401–5413, 2007,
http://www.atmos-chem-phys.net/7/5401/2007/.
Ritter, B. and Geleyn, J.: A comprehensive radiation scheme for numerical weather prediction models with potential applications in climate simulations, Mon. Wea. Rev., 120, 303–325, 1992. Sassen, K. and Benson, S.: A Midlatitude Cirrus Cloud
Clima-tology from the Facility for Atmospheric Remote Sensing. Part II: Microphysical Properties Derived from Lidar Depolarization, Journal of Atmospheric Sciences, 58, 2103–2112, 2001. Saunders, R. and Brunel, P.: RTTOV 8.5 user guide,
EUMET-SAT SAFNWP http://www.metoffice.gv.uk/research/interproj/ nwpsaf/rtm/, 2004.
Schultz, P.: An explicit cloud physics parameterization for opera-tional numerical weather prediction, Mon. Wea. Rev, 123, 3331– 3343, 1995.
Shibata T., Voemel H., Hamdi S., Kaloka S., Hasebe F., Fujiwara M., and Shiotani M.: Tropical cirrus near cold point tropopause under ice supersaturated condition observed by lidar and balloon-borne cryogenic frost point hygrometer, J. Geophys. Res., 112, D03210, doi:10.1029/2006JD007631, 2007.
Tompkins A. M., Gierens, K., and Radel G.: Ice Supersaturation in the ECMWF Integrated Forecast System, ECMWF technical memorandum, 481, 2005.
Wang, P. H., Minnis, P., McCormick, M. P., Kent, G. S., and Skeens, K. M.: A 6-year climatology of cloud occurence fre-quency from Stratospheric Aerosol and Gas Experiment II ob-servations (1985–1990), J. Geophys. Res., 101, 29 407–29 429, 1996.
Whiteway, J., Cook, C., Gallagher, M., et al.: Anatomy of cirrus clouds: Results from the Emerald airborne campaigns, Geophys. Res. Lett., 31, L24102, doi:10.1029/2004GL021201, 2004. Zampieri, M., Buzzi A., and Malguzzi, P.: Sensitivity of
quantita-tive precipitation forecasts to boundary layer parameterization: a flash flood case study in the Western Mediterranean, Nat. Haz-ards Earth Syst. Sci., 5, 603–612, 2005,


![[PDF] Cours Word avec exemples : Insérer un tableau | Cours informatique](data:image/gif;base64,R0lGODlhAQABAIAAAP///wAAACH5BAEAAAAALAAAAAABAAEAAAICRAEAOw==)