Digitally Augmented Sketch-planning
By
Kenneth Goulding
Bachelor of Architectural Studies
University of Cape Town
Cape Town, South Africa (1998)
Submitted to the Department of Urban Studies and Planning in partial
fulfill-ment of the requirefulfill-ments for the degree of
Master in City Planning
at the
MASSACHUSETTS INSTITUTE OF TECHNOLOGY
June 2002
@ 2002 Kenneth Goulding, All Rights Reserved
The author hereby grants to MIT permission to reproduce and distribute publicly paper and electronic copies of this thesis document
in whole or in part.
Author
Department of Urban Studies and Planning May, 2002 Certified by
/7/
Accepted by OF TECHNOLOGY LIBRARIESProfe)' Josph Ferreira Jr. Department of Urban Studies and Planning Thesis Supervisor
Professor Dennis Frenchman Chair, MCP Committee Department of Urban Studies and Planning
Abstract
Digitally Augmented Sketch-planning
by
Kenneth R. Goulding
Submitted to the Department of Urban Studies and Planning on May 16, 2002 in Partial Fulfillment of the Requirements for the Degree of Master in City Planning.
ABSTRACT
While many aspects of the planning profession have changed radically in light of recent technological advances, the practice of sketching plans has remained largely unaffected. There may be good reasons for eschewing computers in the design arena such as that their use may detract from the liberty of the design thinking process. This thesis suggests that this reluctance may be overcome by changing the practice from one of emulation with digital tools to one of "augmentation".
In addressing a perceived need to bring computation to the design table a solution called the "digitally augmented sketch planning environment" (DASPE) has been developed. Making use of video projection,
DASPE augments the design space with digital visualization and analysis tools and allows planners to
sketch using either conventional media or a pen stylus on a digitizing table. Plans can be sketched in the conventional manner, then "hardened" into three dimensional computer models without the need to leave the design space.
Thesis Supervisor: Joseph Ferreira Jr..
Contents
2
Abstract
4
List of Figures
5
Introduction
Planners need tools to help them think 5
Introducing DASPE 6
Introduction to terms used: 8
9
The substance of digital graphics
Components 11 14 Related Work CAD 14 GIS 14 Communication 15 3D design software 15 3D visioning systems 16
Texturing and Rendering 18
Digitally augmented workspaces 20
Tangible Interfaces 20
Sketching in 3D 22
Sketch-based interfaces 22
A Question of Progress 23
25
Design
Principles
1: Match the level of input to the level of design thinking 25
2: Facilitate effective communication and maintain its intent 26 3: Add a dimension without adding complexity 28
4: The computer as butler -pervasive computing 29
30
What
it means to "Digitally Augment"
33
Integration
with
Maya
34
DASPE
Description 34
Maya Commands Used 35
40
DASPE Tools
Construction Tools: 40
Landscape tools: 49
Visualization: 52
56
Use Case - Design for the Big Dig
Corridor
66
Reflections
69
Future
Work
72
Conclusion
73
References
75
Appendix A: MEL Scripts
List of Figures
6 Figure 1: The projector mounted in the ceiling shines through the custom ceiling tile.
6 Figure 2: The environment created with two projectors and a digitizing table.
6 Figure 3: Running a MEL script to create a human figure.
7 Figure 4: Conventional and digital media.
7 Figure 5: Drawing on the table; viewing on the table and wall.
7 Figure 6: Splitting the layout across two computer screens.
10 Figure 7: Method for circle recognition. 11 Figure 8: Three ways to represent a curve. 12 Figure 9: NURBS sphere triangulated and shaded
18 Figure 10: Using corners and edges to intelligently texture 3D vector objects
19 Figure 11: "A hidden-line plot file given the wobbly line treatment..."
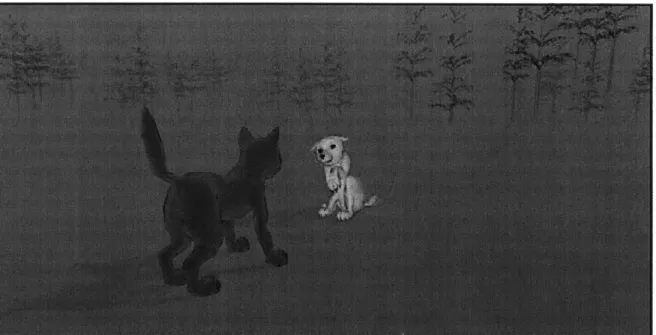
20 Figure 12: Sketchy Rendering Example: The white wolf shows submissive body language.
31 Figure 13: A gestural sketching survey with a summary of the results.
35 Figure 14: Curves of varying degrees
36 Figure 15: Automation for drawing large curvilinear shapes (land-use, grass and water)
37 Figure 16: Automation for extrusions along lines (used in hedges, concrete and roads)
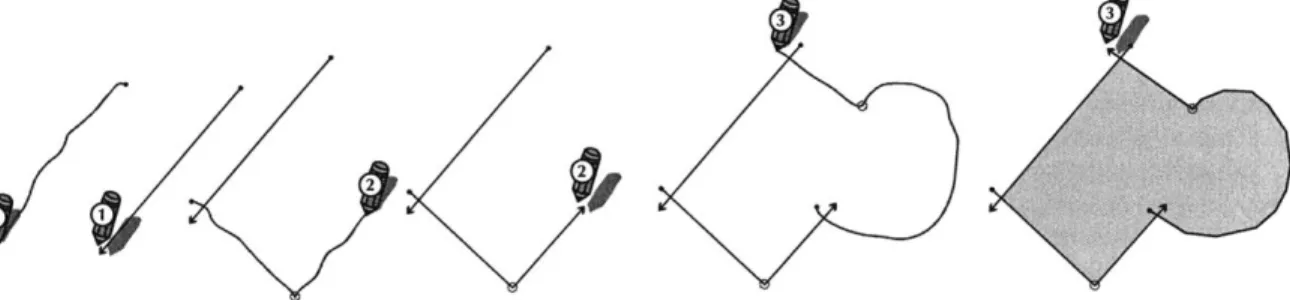
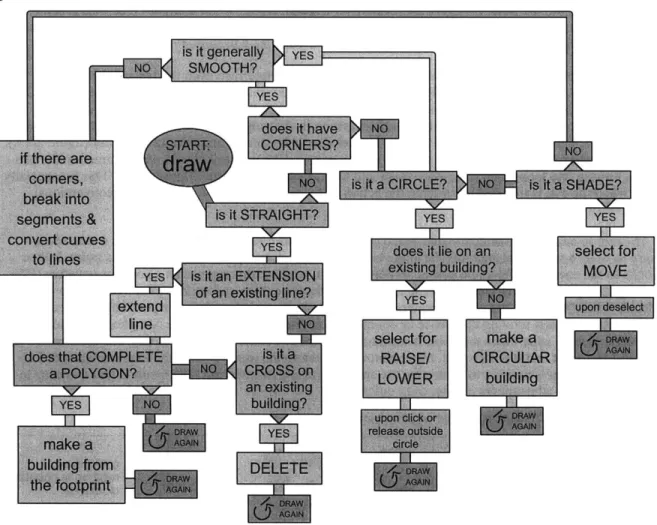
37 Figure 17: Bevelling a block to create different roof styles 40 Figure 18: The process for drawing building footprints. 41 Figure 19: Flow diagram for the Building Sketch Tool.
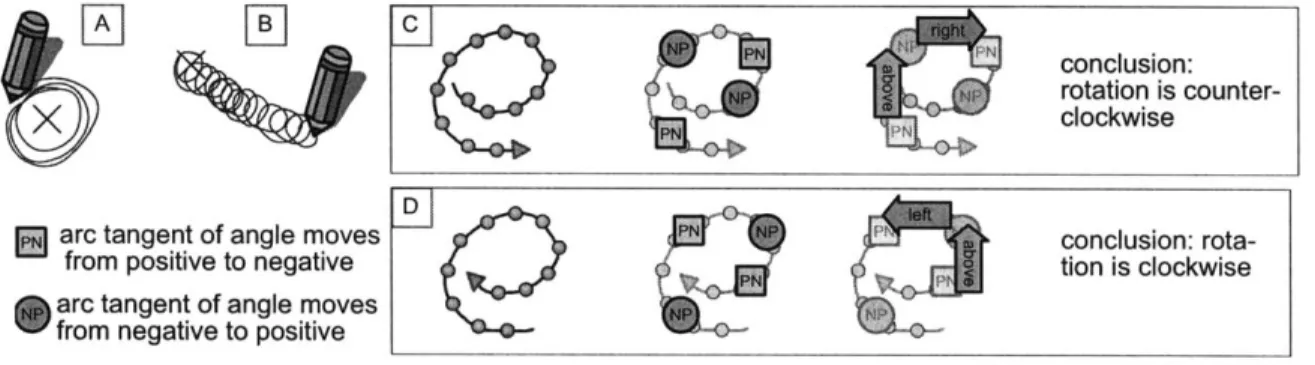
42 Figure 20: The logic used to figure out whether turning is clockwise or counter-clockwise. 43 Figure 21: Texture mapping for different land-use typologies.
44 Figure 22: Methods for setting orthogonal building orientation.
45 Figure 23: Using the Concrete Pen for paths, walls and a massing study 46 Figure 24: Cutting roads away from a paving surface to represent curbs. 47 Figure 25: Lamps and parking meters.
48 Figure 26: Different lamp styles.
48 Figure 27: The resulting roads in plan and perspective. 49 Figure 28: Making a hill with Maya's "sculpt polygons" tool
50 Figure 29: Hedges extruded to different heights.
50 Figure 30: Layering solution for representing roads, sidewalks, grass and water
51 Figure 31: Different styles of trees.
52 Figure 32: The different spatial quality when people do or don't populate the same space.
52 Figure 30: Tool options for the People Tool
54 Figure 33: Studying shadows with the solar analysis tools
55 Figure 34: The sun first becomes visible at a new point of interest.
56 Figure 35: Big Dig Corridor 'Use Case' (29 illustrations) (pp 56-65)
69 Figure 36: A proposed tool to automate FAR calculations.
69 Figure 37: Allocating square footage to buildings.
71 Figure 38: An Augmented Reality Interface for Collaborative Computing.
77 Figure 39: Menu created for edit mode of Building Sketch Tool.
Introduction
Planners need tools to help them think
Modem designers often reflect upon the history of design with a touch of nostalgia and a great deal of respect. We are amazed at how technically advanced and yet ecologically sensitive old solutions to design problems seem to be. However, this should not be surprising when one considers how much time has been put into such solutions. In most cases, many generations were able to give thought to the same design problem, to test it and to modify it. Importantly, the problems and the technologies available to solve them remained the same.
Today we are faced with rapidly evolving technologies that change the way we build and use cities. There is little time for any new technology to become "tried and tested" before we discover another. The design demands of implementing any such new technologies should therefore be immense, and one would expect the task of the city planner to be an impossible one. He or she cannot hope to give the same amount of consideration to a design problem as could be given when cities and technologies evolved more slowly. "This problem can be traced back to the institutional problem of the separation of the plan-ning, architectural, and engineering professions where design at the human scale, no longer having a single, powerful patron, fell between the cracks." (Miller 1988)
As a result, planning efforts will often fail in many respects (even if they succeed in others) simply be-cause not enough thought can be given to all the necessary aspects of the design. In addition, constraints on time and budget compound this already challenging task. One approach to this problem is to abstract the design process (often through use of analogy) so that the task becomes manageable. In addition the planner may employ powerful tools to help with providing quality information, visualizing the implica-tions of decisions, and communicating the logic behind them to other planners, the clients or the public. Such tools have, as yet, done little to enable the planner to provide design at the human scale.
A number of tools exist that are capable of assisting the planning process. However such tools are
sel-dom "pure" planning tools. Planning is a close enough cousin of architecture and engineering for planners to use tools that were designed for those purposes. This tendency is compounded by the need for planners to share drawings with these professions. Furthermore, the planning profession's relatively small user-base does not encourage the creation of specific tools for planners when others will suffice.
Ultimately the use of such tools does little to improve the efficiency of the planning process. In fact it often introduces new inefficiencies associated with producing drawings to be compatible with architects and engineers. The production quality of a planner's output may be much improved (in the sense that the drawings look more professional) but much subtle information that exists in hand-sketches may be lost in the process. As a result many planners still like to produce drawings by hand, and the decision to use computers is often based on competition with other firms in terms of what the clients expect to see.
In this context, the computer is seldom used as a design tool, and is not associated with the design process so much as with a drawing production process. This paper looks at the need to develop computer-based tools that more closely identify with the design needs of the planner. Hopefully, by providing new tools that assist design thinking, visualization and communication, planners may begin to confront the super-human task of designing the city at a human scale.
Introducina DASPE
"The planner... sees and understands only those things for which he or she can provide expression." (Rowe, 1985)
The digitally augmented sketch planning environment (DASPE) developed for this thesis creates a con-text in which planners may sketch their ideas using both conventional and digital media. Combining the computer's visualization and analysis tools with the freedom to draw with pencil on paper establishes and environment conducive to expressing and understanding design concepts.
Making DASPE
The environment is created using a ceiling mounted video projector that projects onto a large Calcomp (Drawing Board II) digitizing table below. The projector and digitizer are calibrated to ensure that input and display are collocated. This is done by simply projecting the image of the com-puter screen onto the table, then mapping the whole surface of the
digitiz-ing table to the whole screen. Once this is done one only has to zoom the projection and shift the table until the projection fills the active part of the
digitizing surface exactly. Input and display will then occur in the same place so that the digitizer may effectively be used as a large touch-screen.
A wireless pen stylus (from Calcomp) is used to sketch on the surface of
the digitizer. The stylus is pressure-sensitive and senses variable degrees of pressure applied to its tip.
-a
Figure 1: The projector mounted in the ceiling shines through the custom ceiling tile (figure 2B:5).
Figure 2: These images show the environment created with two projectors (one in the ceiling (1), the other on the wall (2)). The Calcomp digitizing table has been removed from its original stand and made to lie horizontally as a flat table (3).
Designers and other participants may sketch on the table and view the results of their creations on the wall opposite the main sketcher (4).
Figure 3: Running a MEL script to create a human figure.
The Software
The software component for DASPE has been created in a program called Maya (from Alias Wavefront). Maya is a 3D modelling and animation pack-age used to create animated motion pictures (such as Shrek or Toy Story). It was chosen for this interface as it comes with a powerful scripting language called MEL (for Maya embedded language). This allows the interface to be customized and new tools to be made so that a working prototype for a 3D software environment can be created in far less time than would otherwise be feasible. The image to the left shows a simple MEL script being used to create a representation of a person by moving the vertices of a cylinder.
Conventional and Digital Media
DASPE encourages conventional drawing
media to be used alongside the digital media on the table surface. At any point during the design process sketchers may switch from one medium to another or use a combination of both.
In Design Thinking, Rowe (1985) describes
the design process for architects and planners as one consisting of many stages and incor-porating a variety of design heuristics. This
process is not linear and may require many Figure 4: Above: table sur-iterations. It is unlikely that any particular face without projection and tool, medium, or perspective will serve the two pens -a marker used
designer's needs in all iterations and he or r sketching on the trace she may struggle for inspiration. Providing "inking" with digital lines. a number of media along with the ability of Above right: using a crayon computer graphics to easily shift between to sketch an alternative on scales helps to create an environment in rule aong wiht pen s which the designer can maintain forward lus to input a straight line. momentum - or step back and reflect as the
need may arise.
Vertical and Horizontal
Projecting onto the wall is desirable for two reasons: A) it is more visible to a larger number of people and therefore necessary for larger presentations and B) it provides the correct orientation of the perspective and elevation views to all present.
The projector in the ceiling is used to project the plan view and tool-bars onto the table (see image B below). Ideally (if a suitable video card ca-pable of splitting the display across two screens were available), a second screen would display the elevation and perspective views on the wall (see
A below) freeing up a larger workspace in plan. Currently the same view
is projected on the table and on the wall. Figure 5: Drawing on the table;
viewing on the table and wall.
Figure 6: These images show how the layout is designed to be split across two computer screens (A for the wall, B for the table).
Introduction to terms used:
This is an attempt to clarify the distinctions made between certain similar terms as they are used in this thesis.
Modelling: The term "modelling" will be used to describe either the simulation of real-world processes in a computer "model" or the creation of geometry that represents a physical "model". The terms "com-puter modelling" or "scenario modelling" are used to describe the former process while "geometric mod-elling" or "3D modmod-elling" describe the latter. DASPE does not make use of "scenario modelling," and the term is used mainly in the discussion of related work.
Sketching: The term "sketch" is used to mean either a loose way of drawing lines with a pen (or pencil) or a more abstract notion of creating a rough scenario in such a manner as to allow decisions to be readily changed. The latter does not necessarily require lines to be drawn (neither with a pen nor any other input device) and may instead make use of a number of points specified by a mouse pointer for input. "Sketch-ing" on computers in this fashion is often frowned upon as being clumsy, restrictive and lacking in expres-siveness, but may be desirable for such uses as scenario modelling or automating repetitive tasks. Indeed the term may be broadly used anywhere that the common theme is one of transience or impermanence.
Users, Sketchers and Designers: The term "sketcher," is preferred to "user" in most cases. A "user" is one who makes use of computer software; most software developers will discuss their software as it pertains to a user. However the term "user" also carries connotations of identity for those involved with computers in terms of being considered a computer "user" or a "non-user." In making the distinction between DASPE's approach of allowing "non-users" to sketch with the interface, the term "sketcher" is preferred in referring to all users of the interface. Sketchers may be both designers or non-designers. The term "designer" is often used to distinguish a certain class of sketcher.
3D: The term "3D" is used to describe software and hardware that make use of three dimensional
rep-resentations of objects and scenes. Characteristic of these 3D applications is the ability to dynamically change one's view so that the three dimensionality of such objects can be appreciated. This is necessary because the view is seldom actually seen with "depth perception" or "in stereo" as both eyes view exactly the same information on a flat plane (3D software most often makes use of two dimensional perspectives when showing its 3D info). The term will be used here to refer to such 3D software and its associated components. The term "three dimensional" on the other hand will be used to refer to truly three dimen-sional environments such as the physical environment which 3D software is used to emulate.
Conventional Media: This term will be used to refer to media such as paper, pens, pencils, markers, crayons, trace-paper and other paraphernalia commonly used in creating sketches and drawings. Such media may be used alongside "digital augmentation" with digital media in the DASPE system.
Digital Augmentation: This term is used in this thesis to refer to the addition of digital media to the existing physical environment using a projector. The use of the word "augment" in this fashion comes from the "Augmented Reality" (or AR) tradition. AR systems seek to "augment" existing "realities" with digital information rather than to entirely replace the existing environment (as is the practice with Virtual Reality (or VR) systems).
The substance of digital graphics
It would seem to make sense that a sketch planning interface should make use of "sketching" as its chief input, but the nature of computation and digital graphics has not been conducive to allowing this. Indeed there are a number of reasons why the interfaces that planners use are so far removed from what might be
seen as ideal from the user's perspective.
1. The amount of computation required to implement a natural interface, or any interface that puts user
comfort above computer efficiency is invariably greater than an interface that focusses instead on using each cycle of the processor most efficiently to achieve the task at hand. Since any period of unrespon-siveness from the computer may be deemed discomforting to the user, it could be argued that efficiency is paramount to user comfort. Only recently have processor speeds increased to the point where we can make use of more complex computation without a noticeable delay. Perhaps the most noteworthy amongst such improvements has been in the speed of 3D graphics rendering. 3D graphics is an inherently proces-sor intensive task and these improvements have brought previously intolerable graphics computations into the realm of feasibility. The demand for better 3D graphics in personal computers has been derived largely from the 3D computer gaming industry, although many innovations have also been made by the
US Department of Defense (McCracken,1997).
2. Gestural interfaces are inherently difficult to implement from a programming perspective. This is largely due to difference in interpretation between what the computer "sees" and what the user sees. Pro-gramming is generally difficult to implement in any situation where there are "grey areas" or ambiguity.
Since software development decisions have typically been made by computer programmers, that which is easiest to program often has most often won out over that which makes the most "common sense."
3. The "user base" for planning software is not great and planning is not sufficiently dissimilar to
archi-tecture and engineering that it requires its own software.
4. Computer software is more likely to be accepted if it adds to an existing process without upsetting the status quo. A software package may offer the promise of easier production or new computations that can inform the planning process, but developers have wisely avoided the temptation to replace existing processes such as sketch planning.
5. We are good at learning new tools: people can learn by experimentation and, by observing the results of an operation, may become quite comfortable with using nonsensical gestures to communicate with the computer. For example, one thinks nothing of drawing a straight line (a radius, diameter or "bounding box" diagonal) to signal the computer to produce a circle. This is because the feedback provided shows a circle and not a line so this can begin to seem normal. The development of gestural interfaces has there-fore not been essential in enabling drawing to be done on a computer.
6. Despite all the advances in technology, human cognition remains far superior to electronic
computa-tion at such processes as visual pattern recognicomputa-tion. It is therefore difficult to make the computer behave as a useful and seemingly intelligent entity where pattern recognition is involved. Computers have
sensi-bly been employed in the realm of unambiguous and repetitive tasks that they may do far more accurately
and efficiently than humans. However, since computer interfaces must involve communication between humans and computers, and since their use has extended beyond simple, unfuzzy graphics tasks, it will often be frustrating for the user if the computer does not attempt some "common sensical" computations so that it behaves as a seemingly intelligent and trustworthy entity.
There therefore exist rifts between what is computationally efficient, what is easy to implement in code, and what is simplest and most natural for the user. Occasionally, one will encounter a method that just happens to fulfil all three requirements at once. An example of this is the movement of the "Curiosity Camera" in DASPE from one position to another. This is programmed by continually halving the distance from the desired position until it is close enough to stop. This is extremely simple to compute, requires
no extra variables in the programming and has a pleasant motion that starts quickly as though pushed and decelerates towards the point of interest as though it is coming to a halt. However, for the majority of implementations, one has to choose between that which is easy to compute, easy to program, or easy for the user. In order to illustrate this, it may be helpful to look at the requirements for drawing a two dimen-sional circle in a gestural sketch interface.
By way of background for this discussion, it will be necessary to clarify the distinction between vector
and raster graphics. Raster or "bitmap" graphics are comprised of a grid of "pixels." Certain color infor-mation is stored for each pixel so that an image may be represented by the grid. Raster graphics make use of the same kind of logic as is used to display graphics to the user on the screen. Drawing in raster-based applications (such as earlier versions of Adobe PhotoShop) tends to allow more free-form drawing, but does not lend itself to accurate drawing or tweaking. Vector graphics (sometimes also known as "object oriented" graphics) represent "graphical objects, such as lines, arcs, circles, and rectangles, with mathe-matical formulas." (Lycos Tech Glossary) The objects used in vector graphics may contain a variety of at-tributes that specify how they are to be represented. Other atat-tributes may contain additional hidden infor-mation such as GIS data. Vector objects are described in terms of a number of standard "primitives" (such as ellipses, rectangles, lines, curves and points) from which all graphic representations will be made.
A "2D" circle is the simplest vector object that can be represented by computer graphics in terms of
the number of variables used to describe it. Any circle may be stored simply as three variables: its x and y positions in the Cartesian plane and its radius (or r). By comparison, a line requires four variables (xl,yl,x2,y2) while a square must require at least a specified rotation. In addition a point is effectively simpler than a circle (it contains only x and y), but is not "renderable" except as a circle or a more com-plex shape. This concept may seem strange to anyone who has had to draw circles with a pen and pa-per where it is necessary to use a tool such as circle stencil or a pair of compasses in order to achieve a
consistent shape. Indeed, when drawing by hand most other shapes are easier to produce than an accurate circle.
Drawing a circle freehand is an interesting process: it is indeed very difficult to draw a continuous line a certain distance from a center point and ensure that it is smooth and regular. Many sketchers will draw circles iteratively, starting with a rough circle and then refining it with each new stroke drawn. The later
strokes are often made firmer than the earlier ones so that a circular shape is most evident to the eye and the rougher lines may be ignored. However, while the human eye may immediately recognize this sketched form as a circle, it is not as easy for a computer to be made to do so. Indeed the implementation of a "common sense" interface must accommodate many such situations in which the "eye" may assume something to be obvious, but the computer may be entirely fooled unless recognition for that particular pattern has been encoded.
For DASPE's circle recognition algorithm, I have employed Lew Hopkins method for determining a circle (Hopkins, 2002) : it is a series of sketched points that, when divided into six equal segments can form a "Jewish" star that has S6 roughly equal sides (see figure 1). This works very well when one
considers how simple it is to implement computationally -but only provided that the user finishes the circle near its start point. Many users may however draw the multiple iterative rings described above, or simply end the circle a little further around the circumference than the point where it started. The Hopkins algorithm will try to divide the line into six even parts, but unless the line is a single circular form with a start-point near its end point, it will not be recognized as a cir-cle. In order to accommodate all the human conceptions of something as simple as a circle, one may need to add further logic. Perhaps the
3 4circle algorithm should watch to see when the circle can first be
con-sidered closed, mark this point and later run the algorithm looking at
Fre7:tod fthe sketched curve only up until this point. However, while this may
ensure that all circles are recognized as circles, there is a danger that other shapes may be "recognized" as circles too. For example a square will most often also meet the requirements of Hopkins' algorithm. An interface that automatically converts a square into a circle will be annoying and is unlikely to earn the user's trust and confidence. In DASPE this problem is overcome (for the most part) by checking two things. Firstly there is an algorithm that looks for corners. Unfortunately in reality any curve drawn with a stylus will have small kinks and since the smoothing algorithm does not successfully straighten these out, the corner-finding algorithm will often find corners in a circle! Therefore it is also desirable to check the average change for all angles that aren't considered part of a corner. After the corners have been removed from a square, most other points will be straight in relation to each other. A circle on the other hand will run up a far higher average change in angle between points, and can thus be recognized once a tolerance is determined (through numerous trials) to separate circles and squares. However, even so, the computer can still get confused between circles and squares or by lines that aren't supposed to represent either prim-itive exactly. The variability between drawn strokes that to the human eye may appear unambiguous is too large to always ensure correct interpretation.
So, rather than draw a circle in the fashion all people know by common sense it is far simpler compu-tationally and less ambiguous to draw a circle by specifying first its center point and then dragging away from that point to set its radius. Furthermore, since most computer graphics packages rely on mouse in-put, it would be less accurate and slower to draw circles in the conventional fashion. It is however
neces-sary to provide a specific tool for drawing circles since a circle is really being input by drawing a line with the mouse. In addition, it may at times be desirable to draw a circle by dragging from its edge, and many computer programs draw circles or ellipses to fill a "bounding box". In each case, a new tool state must be
specified for each input since the mouse drag used to specify the circle looks only at two points -the start and end of the drag operation.
Indeed, for almost all drawing tools used in conventional CAD or graphics programs, input takes the form of a single click, series of clicks, or the start and end of a drag operation. All other intent is speci-fied by tool selection or through keyboard input. Rarely does the software "care" what happens during the drag operation.
A gestural interface on the other hand must rely almost entirely on what happens during that drag -not just on the positions of all the points plotted during the drag, but also on their order and sometimes also
on the speed at which they were drawn.
Consider the popular gestural interface used on the Palm handhelds. The letters of the alphabet and a number of other commands and symbols are all represented by the points along a drag operation. In this case an extremely difficult problem of character recognition has been greatly simplified by the
require-ment of a compromise between what is easy for the computer and what is easy for the user. The computer requires that the user learn a fixed way of drawing each character. Note however that "fixed" here refers to the human perspective and a great deal of computation must still be conducted in order to decipher those lines that are all the same thing to the human eye. This has proved to be a happy and very popular compromise: a compact and natural input device for the user; a reliable and unambiguous set of patterns for the computer.
Components
Lines and Curves
Circles alone would obviously not be the most efficient way to represent any two dimensional draw-ing. Curves and lines on the other hand may be
used to represent almost any shape, especially if
they may be drawn as multiple lines and curves
used to enclose "fills." Curves and lines are both
represented by a number of points along the line or Cardinal
(or CVs). Curves are stored in the same way as lines but for a few extra control vertices used to determine their curvature. B-spline and cardinal curves make use of one extra CV for each segment. This influ-ences the curvature of the line either strongly (for cardinal curves) or more loosely (for B-splines). Bezier curves use two control nodes or "handles" to describe the curve. These handles and CVs may be used to represent any possible curve -often with fewer points than one would imagine. Many graphics programs make use of sophisticated algorithms to represent a drawn stroke with such vector curves and some even allow the accuracy of the representation to be tightened or loosened to create smoother curves or curves that follow the drawn line very closely. Some programs such as Macromedia Flash will also attempt to interpret whether or not a sketched line is intended to be straight, or whether it should result in a circle, a square, a rectangle or some other regular shape. This may also be turned off in order to draw curves that would otherwise be wrongly interpreted.
Triangles
In the same way that curves may be used to outline any two dimensional form, triangles can be used to represent any 3D geometry. In truth, triangles may not perfectly represent a rounded object such as a sphere, however they may be used to approximate its form to varying degrees of accuracy. The main reason triangles are valued for representing 3D geometry is that a triangle's points will always lie in the same plane No other shape shares this property, and it allows the triangle in question to be rendered with the appropriate amount of light for the plane in which it lies. Seen together, all the triangles will appear to represent a solid, shaded entity such as the shaded spheres on the right in figure 9.
Polygons
Polygons are similar to triangles, but, as their name would suggest, may consist of more than three sides. Polygons are ultimately "triangulated" in order to form triangles. This ensures that all faces of the object then lie in a single plane so that they may be rendered. Some software packages will take a differ-ent approach and will prevdiffer-ent the creation of
"non-planar" polygons. In such a case there is no need for Figure 9: NURBS sphere triangulated and shaded triangulation.
NURBS
NURBS stands for Non-Uniform Rational B-Spline. "[NURBS] surfaces are webs of interconnected
curves" (from Maya Documentation). In order to be rendered, NURBS surfaces must also be triangulated in a processor intensive process. There is a trade-off between using more triangles for increased accuracy and greater smoothness and the time it takes to create more triangles (through tesselation) and to render them. Figure 9 shows a NURBS sphere that is represented with a web of lines on the left. Before it can be shown as shaded (on the right) it must first be "tessellated" into a number of triangular facets.
Rendering
The term "rendering" refers to the process of generating a "bitmap" or "raster" image from the 3D vec-tor geometry. It is most often used to refer to the final output of the 3D modelling software, but is also used here to refer to any representation of 3D geometry on the screen. Vector geometry cannot after all be seen unless it is "rendered" to form a bitmap image such as can be displayed on a screen. In figure 3, both
spheres would be considered rendered by this definition: the NURBS sphere as a wireframe; the shaded polygonal sphere as both a flat shade and a wireframe together. Note that if one were to "render" this scene as the term is used in Maya, both spheres would be shown identically by default.
Rendering Speed
Rendering is a processor intensive task. Even though processor speeds are becoming increasingly impressive, 3D rendering remains an area in which one may very quickly observe a slow-down in sys-tem performance. DASPE relies on real-time rendering in the model viewer within Maya. This model viewer uses many of the "hardware rendering" techniques available on many modem video cards which ensures that an incredibly large number of polygons may be rendered without any apparent slow-down (this means all those polygons are being rendered at least 30 times every second). However, slow-down may become apparent when the polygon count becomes sufficiently high, when lights are to be rendered
or especially when "depth map" shadows are projected. The main solution to speed problems is therefore to reduce the number of polygons (or more specifically, triangles) used wherever possible and also to turn off more processor intensive tasks such as lighting and shadows when animating the scene.
Texture maps
The term "texture map" refers to a bitmap or raster "texture" that is "mapped" onto 3D geometry. A tex-ture is generally an image that is repeated a number of times in order to entirely cover the 3D object. For example, an image containing horizontal and vertical lines may form a texture for a building. In DASPE such images repeat once for every storey of the building and a number of times horizontally so that the entire building is covered. Since one is applying a two dimensional texture onto a 3D geometry, a variety of "projections" may be used in order to determine the 3D orientation for the texture maps used. DASPE
makes use of "cylindrical projection" for the buildings.
Maya allows texture maps to be rendered using the processing power of the graphics card. "Hardware rendering" in this way is extremely fast and ensures that, in terms of speed, texture mapping is far prefer-able to representing the same information with 3D geometry.
Tweaking
One of the main advantages of using vector graphics is that it is easy to make changes to a drawing by tweaking a number of variables. For example, all line weights may be increased, or all textures changed for the selected objects. In addition, since all objects are represented with control vertices, their form may be altered at any point. Such small changes are known as "tweaks."
Related Work
"We shape our tools and they in turn shape us" (McLuhan, 1967)
The role of the city planner is ever-changing. This has never been more true than it is now in light of the availability of new tools that both expedite existing processes and enable new ones that could never before have been feasible. It will be curious to watch how the planning profession takes on new roles in light of the new tools available. Here follows a discussion of a number of innovations that have changed the face of planning in recent years and some that are only beginning to make their presence felt. Such a discussion is important to establish an understanding of the technological environment in which DASPE is designed to exist.
CAD
Most planners make use of "industry standard" drawing tools such as MicroStation and AutoCAD. These form a small part of the broader CADD (Computer Aided Drawing and Design) field. It is a highly innovative field, and has revolutionized the design process for many industries. However since most of these innovations assume a product -and most often a physical 3D product, few of them are well suited to planning. Furthermore CAD drawings tend to become too rigid, too quickly. Even though they may be easily modified, it is often easier to start a drawing from scratch. CAD, with its promise of efficiency and ease of modification discourages this practice.
Many newer innovations inspired by the CAD industry may do more to improve the planner's task. Sketch interfaces such as SKETCH and ErgoDesk (discussed below) as well as speech control interfaces that simplify the input of commands are some examples. Some CSCW (Computer Supported Cooperative Work) applications developed for the CAD industry may also be useful to planners although the benefits are unlikely to be as great as for other practices.
GIS
GIS is an innovation so useful to planners, that many people consider it to be a planning application
first and foremost. Geographic Information Systems were, however, initially developed for the purpose of cartography and the practice of linking graphic elements to an attribute database is so powerful that GIS is now employed for a broad variety of purposes.
With the right data, GIS can allow planners to make informed decisions from remote locations and with limited time where previously they would have to visit a site, solicit information at great expense or
sim-ply guess. It should be possible to have all the information necessary for decision making literally at one's
fingertips. However since GIS was not designed for planning, and the information available has been gathered for a variety of purposes, it is often necessary to process the information before it can be used to assist design decisions.
Despite this requirement, it is clear that no planning support tool would be complete without a GIS component to it. However, while I will demonstrate the use of GIS in DASPE, it will not be the focus of this thesis and will often be employed as "vapor-ware." I have made this decision because I am confident that high quality work is being done in the GIS field to equip planners with the tools they need. It is the integration of these tools into a form more useful to planners in the design phase of their work that has been lacking.
Of particular interest to this thesis is the work by Raj Singh in using GIS in the sketch planning process.
This work will be considered in more detail later, however it is worth noting here that such uses of GIS may be still more useful when incorporated into an interface such as DASPE. This may be done in an iterative process incorporating traditional sketch planning techniques and the deployment of such GIS based tools as Singh's.
Another initiative of interest is the MIT City Scanning Project. Seth Teller's effort to create realistic 3D models of the city using photography and image-mapping techniques may prove an invaluable resource for planners. These models will provide a previously unavailable opportunity to visualize the city and the effect of one's interventions on the experience "on the ground". Intriguingly the technique of draping bitmaps over buildings to achieve a simplified, but convincing representation of reality is similar to that which I propose in DASPE as a "false-reality" used to "fill in the gaps".
Communication
Portfolio Wall (Alias WaveFront 2001) is a system that, like DASPE, uses Maya and a large screen with collocated input. However, the portfolio wall is not used for design -it is called "digital asset management
software." Its purpose is to bring a number of designers or clients up to speed on the progress of a design
-essentially replacing the pre-digital bulletin boards that served the same purpose. Users may interact with the touch screen and view any of a selection of models from different perspectives by gesturing with a finger. They may also attach notes to a model by writing on the screen.
As with DASPE, Portfolio Wall serves as a forum for sharing ideas and apparently aims to create shared-understanding. The wall may be used for group discussions about a project, but one of its main ob-jectives is that of remote collaboration. It therefore differs from DASPE which aims primarily to generate discussion between people in the same room.
A CSCW system capitalizes upon the convenience and efficiency of computers in organizing and
facili-tating the sharing of work documents and drawings. It is becoming increasingly important when using such impersonal systems to encourage individuals to come together and share their ideas in a physical environment in order to ensure that shared-understanding exists. (Schrage 2000) Although DASPE is not demonstrated as part of a greater CSCW system, it could easily be incorporated into one, and would be the natural place for people to come together over a prototype.
3D design software
Most 3D CAD packages are primarily two dimensional drawing tools onto which a third dimension has been added. More recently, some packages have emphasized 3D design as their focus. Perhaps the most popular product in this niche, ArchiCAD (from Graphisoft) has been developed with the intention of streamlining the architectural drawing process through the use of intelligent functions that can draw walls complete with height information and "specs" from a simple line. Doors and windows may be added to the wall with the minimum amount of user input. While demonstrations of this sort of intelligent, dedicat-ed software never fail to impress those who have "wastdedicat-ed" many hours drawing the equivalent manually,
many architects complain that its intelligent functions limit the freedom of the architect to design more interesting structures than the functions allow. Overcoming this (if it is possible at all) may often result in frustration and inefficiency such that many of the gains of the intelligent software are negated.
Some architectural firms (particularly those who design more complex structures) therefore opt to use less "intelligent," less dedicated applications that give them more freedom to explore their creativity with a full array of 3D modelling tools. Such packages are far more difficult to learn, and are not closely tied into CAD systems so that few of the efficiencies possible in integrated solutions such as ArchiCAD are appreciated. However since they use software that was primarily designed for 3D animation (such as 3D Studio and Maya), this allows for the creation of photo-realistic 3D fly-throughs and other animations that set new standards for visual communication to clients.
It should also be noted that the freedom to design in 3D without the worries of maintaining a CAD drawing simultaneously allow for far more exploration and experimentation with architectural design. However it has been beyond the scope of most architects to learn these software packages. In addition,
it is debatable whether or not the ability to create realistic and complex 3D models with computer tools (even once mastered) is as useful as traditional media in terms of thinking through a design. As a result, there is generally a division of labor between those who do the design and those who create 3D models of
it for visual communication. This amounts to a separation of thinking and production. It is not necessarily the most desirable situation, but has been the most practical given the options available.
In the particular case of Urban Planning there appear to be no dedicated tools that streamline the process of urban design as ArchiCAD has sought to do with architectural design. However planning firms have responded to the growing demand for visual communication by using 3D animation software, and spend needlessly large amounts of time in order to market their designs with these tools. This thesis will seek to create tools that streamline the planning process in the same fashion as ArchiCAD (and others) has done for architecture. However, at the same time it seeks to address the issue of flexibility that is manifest in an over-simplified program such as ArchiCAD by using an application (Maya) that allows those who have mastered 3D modelling tools to use them as their expertise will allow.
3D visioning systems
"Urban simulations; that is computer generated simulations of the built environment, are an
effective means of improving the public's participation in the planning process". (Bulmer, 2001)
The above is Bulmer's hypothesis in a paper submitted to the online planning journal. He makes a con-vincing argument for the potential of 3D graphics and visualization for communicating planning concepts to clients and the public. "Simulation" is used to refer both to the creation of 3D models for visualizing urban environments and to the use of computer models for scenario modelling. Both may be used to improve the quality of knowledge transfer. As Schiffer (1996) purports "information technology (IT) can help people to comprehend information, thereby delivering knowledge."
In order to capitalize on this potential, a number of commercial 3D visioning systems for cities have recently been made available to planners. These discussed here were recently presented at the American Planning Association Conference (2002). They are mostly focussed on representing existing conditions from information in a database, but may also be used for design visualization by modifying the data used. For DASPE these packages may provide an invaluable resource in terms of creating 3D context from GIS data.
SiteBuilder 3D from MultiGen-Paradigm (www.multigen.com) uses database information to automati-cally generate photoreal 3D environments. This may take the form of terrain data, point data for objects such as trees and lamps and polygonal data for objects such as buildings. The program is marketed as an extension to ESRI's ArcView. Models of buildings may make use of simple extrusions with generic texture maps, or predefined building shapes (used mainly for houses). The package also includes software for creating more complex 3D objects and applying texture maps created from photographs of the existing buildings.
CommunityViz (www.communityviz.com) markets MultiGen's software along with a "Scenario Con-structor" application that allows the user to consider visually the impacts of decisions made. In this case the visualization may extend beyond a representation of the physical to representations of more abstract data such as the results of a suitability analysis.
VantagePoint (www.vantagepointtechnologies.com) take a similar approach although they do not pro-vide scenario analysis tools, and concentrate mainly on visualization. Their package, called Perspective, allows some design to be done in a perspective view: for example, one may place a certain style of tree at a certain point by selecting it from a menu then indicating its desired position in the view-port. Their focus, however, seems to be on collection of data into large, comprehensive databases that include models for every building in the region of interest to as high a degree of detail as is available. The database may also contain temporal data so that various models may be stored to record the changes in a building over time.
All these programs make use of very similar 3D data-representation and visualization techniques. Many
are similar to those used in DASPE, but there are also some differences. Point data.
Most of the objects represented by point data are modelled either as a cross-form or as a head-on texture map that always points toward the user and can never be seen edge-on. The cross method has long been used by the makers of physical models where a simple 2D profile of an object such as a tree is cut out of card or balsa-wood and combined with a second profile placed at 90 degrees. This ensures that the 2D profile can never be seen edge-on without seeing the second profile face-on. The head-on method works
by continually rotating an object to face the camera although obviously this happens only in the horizontal
plane and it does not also rotate vertically to face a camera above it. This therefore works best for smaller objects seen at eye level.
DASPE does not make use of the cross method, but instead uses Maya's modelling tools to create
sim-ple three dimensional models of trees, lamps and other objects. SiteBuilder and Perspective make use of true 3D models only for more complex objects that are externally generated and accessed through librar-ies. It should be noted that 3D models are not stored only as point data and may therefore have a specified rotation so that, for example, street lamps may lean out over a street.
Polygonal Forest Objects
In SiteBuilder, trees may also be specified as polygons that represent a wooded area. Large clusters of trees are often perceived as an edge to a space and it would be inefficient to represent them as individual trees so large bodies of trees are instead represented as a single forest object mapped with a multiple tree texture. This successfully describes the tree-body as an edge and represents its texture. It should be noted that if the user is allowed to fly over the top of such a forest, it may appear odd.
DASPE deals with trees as either individual objects or as lines of trees. The scale of visualization for
which DASPE is designed does not require the sketching of trees in such large bodies as cannot be repre-sented individually, however such techniques would be ideal for showing context around a site. There is no tool for creating such tree bodies in DASPE. It is assumed that packages such as Multigen's would be used to create existing site conditions from GIS data for use as a base model.
Ortho Photos and Terrain
Terrain is represented in both SiteBuilder and Perspective as a triangulated mesh onto which an ortho photo has been draped. This is a common practice and works well for representing landscape. Cars and other three dimensional objects, may however appear squashed onto the pavement as they are not repre-sented by the geometry of the mesh. Furthermore, while buildings may be included in the terrain model and the ortho photo accurately aligned such that each building is draped with the appropriate texture, there are a number of problems associated with representing buildings this way. The most obvious is that the facades are not represented, and appear as vertical streaks of whatever color happens to map to that edge. This is because the ortho photo is "projected" from above. What's more, the perspective on an ortho photo is such that the roofs of tall buildings will have shifted out of alignment with the base. In ortho photos it is the base and not the roof that represents the actual location of a building. Therefore, the ortho-photo will often appear to be out of alignment because the roof will appear to spill off the edges of a building extru-sion. As a result this technique is undesirable for models that are viewed from the ground level. However despite these shortcomings, the method is quite remarkable at realistically representing the context when seen more broadly.
More detailed models
Areas that are intended to be viewed from the ground require more detail. This may be achieved in 3 ways: by creating all the building's components from 3D geometry, by applying a generic texture map (as in DASPE), or by using actual photographs of the building in question and mapping these onto a basic 3D
geometry. The latter method is desirable in most cases since fairly realistic context may be quickly gener-ated while keeping the polygon count low. MetaCreations' Canoma (www.canoma.com) was ideal for quickly creating context from oblique aerial photographs. It is a great pity that this product is no longer available at the time of writing, however a more expensive and more complex alternative called Photo-Modeller (http://www.photomodeler.com) could probably be used in the same way.
MultiGen provides an application called "Model Builder" that allows textures to be mapped to models such that they may be used in its visualizations. They have some fine demonstrations of its use, however, this is very labor intensive and one would be unlikely to see its use in generating context for an individual planning project. VantagePoint's solution to create comprehensive databases for an entire town may prove a more useful resource. These models may be provided by the architects who designed the building (as required by the town), they may be commissioned by the town, or they may be built for the planner either in-house or as a service rendered by the company. However such an eclectic database may consist of models that are ill-suited for use as context and are unlikely to look coherent. But there may certainly be solutions to the problem (such as providing rough texture-mapped models as well as detailed models) and it is encouraging that there is a perceived market for products that can provide 3D context for use by plan-ners. DASPE is poised to capitalize on such tools.
Texturing and Rendering
DASPE makes use of very basic texturing methods to achieve a sense of scale and offer a suggestion of
what may be possible when creating automatic representation of generic building types. The results do not satisfactorily represent buildings realistically, however recent 3D graphics research suggests a number of ways to improve both texturing and rendering. One solution discussed here looks at a method for intel-ligently rendering a 3D form based on its vector information rather than simply projecting textures at it. An alternative solution may be not so much to automate the construction of a building from a sketch as to present the sketch in a style more appropriate to the level of thought put into it.
Julie Dorsey's work on Cellular Texturing for Architectural Components (Dorsey 2001) may also provide insights into how best to texture map an entire building with a far better degree of realism. While it would be unnecessary (and undesirable) to achieve the level of detail that Dorsey's work allows, the same ordering of texturing operations that starts with corners, then makes edges and finally fills in sur-faces would ensure that texture maps do not flow around corners. In addition, edges of buildings could be differentiated with a different material to achieve a more interesting and realistic appearance (figure 10 shows how recognizing corners and edges allows Dorsey's software to intelligently render the stone-work pattern based on a certain logic for stone-work). As well as respecting corners and edges, it may also be desirable to have a center of interest node that could be moved around the perimeter of the building. Early experiments with this technique suggest that it could be implemented fairly easily in Maya by creating a "curve on surface" through "projecting" a curve onto the building facade. When moved, this curve will run around the sides of the
building only. The center of Fi ure 10: usin corners and ed es to intelli enti texture 3D vector obects interest would specify the
lo-cation of the building's main entrance and may also invoke a different facade representa-tion at that point. It is beyond the scope of this thesis, but the potential of a cellular based texturing system for creating different building ty-pographies holds a great deal of promise for the success of this first solution.
In the second solution, the goal would be to produce a live 3D rendering that looks and feels like a loose perspective sketch. This solution would rely on the ability of the human eye to interpret loose lines and their intent, and would avoid the fact that it may be bothered by any imperfections exposed in an attempt to render photorealistically.
A number of people have realized that photorealistic rendering of 3D models is not always the most
ap-propriate manner in which to present them. Non-photorealistic Rendering (NPR) is becoming an increas-ingly popular alternative. Not only does it simplify the rendering process and increase its efficiency, but it also allows the model to presented in a fashion that looks "sketchy." While it would be difficult to dis-credit the power of photoreal images in communicating a proposal to clients and the public, such images require a great deal of time and attention to produce and such quality is difficult to generate automatically. Automatic renderings that attempt to be photoreal tend to appear "tacky," but perhaps more detrimentally, they appear to be further resolved than they really are. It is difficult to look at a building that is rendered with shading and a texture map and think of it as "just a sketch."
In realizing the importance of representing "sketch" models as sketches (or even rendering more com-plete models in a fashion that appears more natural and engaging) Richens and Schofield (1995) came up
with an architectural rendering system that would employ NPR rendering techniques. This would be done in an interface that allowed the user to provide their own input through painting. The resulting program, called Piranesi, "is a hybrid between a conventional paint program, and a renderer of three-dimensional images. The interface is similar to a paint program, but the pixel planes on which it works are extended to include a z-buffer, which defines the distance to each pixel in the scene, and a material buffer, which defines the layer or material from which that pixel was generated." ([Online] Martin Centre CADLAB,
2002) This product has been very successful and is marketed by manufacturers of 3D software such as Microstation or SketchUp as a solution for presenting the sterile 3D photoreal output of such applications in a more interesting and engaging fashion.
Obviously Piranesi cannot be used to solve DASPE's rendering dilemma as it is designed for painting a single static view, however some of the NPR methods used may be applied in real-time too. Indeed some NPR methods can be extremely simple and require little more than a degeneration of the im-age from "hard" computer drawn lines to something that appears more spontaneous. Figure 11 shows how
simply "wobbling" the lines of a vector drawing can produce a sketch-like effect.
Such degenerations are computationally very easy and this effect could certainly be achieved in a real-time rendering, but requires randomization and may produce undesirable motion in the lines. There are,
however, other NPR methods that do work well when animated.
Figure 11: "a hidden-line plot file given the wobbly line treatment using simulated charcoal effect."
source: http://www.arct.cam.ac.uk/research/cadab/irender/gallery/ wigglylinejpeg
A particularly effective demonstration of this has been employed in the AlphaWolf project at the MIT
Media Lab's Synthetic Characters Group (Tomlinson and Downie 2002). Marc Downie has rendered the wolves with loose sketchy lines that easily convey wolves and their body language without trying to represent them in a photorealistic manner. The static screenshots of these sketchy wolves look quite "sketchy" (see figure 12), but one can tell they're not hand drawn and they don't match up to a real hand-drawn sketch by an artist. However when the wolves move about or the camera flies around them in 3D, the effect is quite remarkable. It is hoped that rendering buildings and landscape in a similar fashion for
DASPE could be just as effective -particularly for the leashed camera (see page 53) and other moving views.
Figure 12: The white wolf shows submissive body language. This sketchy rendering is used to display 3D ge-ometry and updates as the characters or cameras move.
source: http://web.media.mit.edu/-badger/alphaWolf/images/submitBig.gif
Digitally augmented workspaces
Many people find the "digital workspace" provided by desktop computers to be restrictive due to the size-constraints of the screen and the separation of input and display. The metaphor of the desktop is provided for its familiarity, but the experience of the two is not closely aligned. A digitally augmented workspace goes beyond the metaphorical and takes the physical environment as its starting point. This is then added to by digital inputs and displays. The digital desk that Wellner dreamed up at the Media Lab as long ago as 1992 inspired a number of initiatives to digitally augment our work space. The utopian "vaporware" video (Wellner 1992) produced by Wellner appears comical to today's audience in its quaint technoromanticism. However, like any good vaporware demo, it has broadened the way we think about interacting with computers in our day to day life. DASPE shares a number of technical initiatives with the DigitalDesk. Most notably, it uses projection to illuminate a physical surface, which, but for the illumina-tion and a sensing device, can be used as a normal workspace.
Tangible Interfaces
The MIT Media Lab's Tangible Media Group headed by Hiroshi Ishii has made ground-breaking use of physical, tangible interfaces for urban design. They have made an effort to bridge the gap between the experiences of working with tangible models and working with computer tools. Two projects are of particular relevance to this thesis:
URP -The Urban Planning Workbench:
The "URP" interface (Underkoffler et al, 1999) tracks the position of physical models on a table surface and can be used to project virtual shadows for any time of day and year, conduct basic wind studies, and visualize traffic flows.
The interface has been heralded as a great success and continues to be improved. However a funda-mental problem exists in that the physical models are simply "handles" for digital models. If you make a