HAL Id: hal-01600945
https://hal.archives-ouvertes.fr/hal-01600945
Submitted on 19 Jun 2019
HAL is a multi-disciplinary open access
archive for the deposit and dissemination of
sci-entific research documents, whether they are
pub-lished or not. The documents may come from
teaching and research institutions in France or
abroad, or from public or private research centers.
L’archive ouverte pluridisciplinaire HAL, est
destinée au dépôt et à la diffusion de documents
scientifiques de niveau recherche, publiés ou non,
émanant des établissements d’enseignement et de
recherche français ou étrangers, des laboratoires
publics ou privés.
Distributed under a Creative Commons Attribution| 4.0 International License
Frédéric Angles, Marie-Pierre Castanie-Cornet, Nawel Slama, Mickael Dinclaux, Anne-Marie
Ciri-nesi, et al.. Multilevel interaction of the DnaK/DnaJ(HSP70/HSP40) stress-responsive chaperone
machine with the central metabolism. Scientific Reports, Nature Publishing Group, 2017, 7 (1), 16 p.
�10.1038/srep41341�. �hal-01600945�
Multilevel interaction of the
DnaK/DnaJ(HSP70/HSP40)
stress-responsive chaperone
machine with the central
metabolism
Fréderic Anglès
1,2, Marie-Pierre Castanié-Cornet
1, Nawel Slama
1, Mickael Dinclaux
2,
Anne-Marie Cirinesi
1, Jean-Charles Portais
2, Fabien Létisse
2& Pierre Genevaux
1Networks of molecular chaperones maintain cellular protein homeostasis by acting at nearly every step in the biogenesis of proteins and protein complexes. Herein, we demonstrate that the major chaperone DnaK/HSP70 of the model bacterium Escherichia coli is critical for the proper functioning of the central metabolism and for the cellular response to carbon nutrition changes, either directly or indirectly via the control of the heat-shock response. We identified carbon sources whose utilization was positively or negatively affected by DnaK and isolated several central metabolism genes (among other genes identified in this work) that compensate for the lack of DnaK and/or DnaK/Trigger Factor chaperone functions in vivo. Using carbon sources with specific entry points coupled to NMR analyses of real-time carbon assimilation, metabolic coproducts production and flux rearrangements, we demonstrate that DnaK significantly impacts the hierarchical order of carbon sources utilization, the excretion of main coproducts and the distribution of metabolic fluxes, thus revealing a multilevel interaction of DnaK with the central metabolism.
Ubiquitous molecular chaperone machines control cellular protein homeostasis, both under lenient and more stressful growth conditions1. Among these machines, members of the highly conserved HSP70 (Heat Shock
Protein of 70 kDa) family of ATP-dependent molecular chaperones have been associated with almost all known chaperone functions2,3. In the bacterium Escherichia coli, the multifunctional HSP70, named DnaK, acts in
con-cert with its cochaperones DnaJ and GrpE (all together referred as DnaKJE) to efficiently assist de novo protein folding, protein disaggregation, protein targeting and translocation through biological membranes, as well as the remodeling of protein complexes4–7. DnaK interacts with a wide range of E. coli proteins, more than 7008 and
mutations in dnaK induces a plethora of cellular defects that result in various phenotypes such as a cold- and a temperature-sensitive growth, a susceptibility to nutrient starvation and to various antibiotics3,9.
It is known that DnaKJE downregulates the entire heat shock response (HSR) by interacting directly with heat shock transcription factor σ 32 to facilitate its degradation by the membrane-anchored FtsH protease10. Under
stress condition, DnaK is efficiently recruited to accumulating aggregated proteins, leading to an increased stabil-ity of σ 32 and the subsequent induction of more than hundred HSPs11. This places DnaK as a central component
of the cellular response to proteostasis collapse, both by acting directly on misfolded and aggregated proteins and by modulating the synthesis of a plethora of other heat shock inducible chaperones and proteases.
Remarkably, previous works showed that DnaKJE acts in a concerted and cooperative manner with other major cytosolic chaperones, namely Trigger Factor (TF) and GroESL, especially during the biogenesis of cytosolic proteins8,12. Although the ribosome-bound TF facilitates the folding of the majority of the newly synthesized
E. coli proteins, a significant fraction of these proteins, over 30%, necessitates assistance by the downstream
1Laboratoire de Microbiologie et de Génétique Moléculaires, Centre de Biologie Intégrative (CBI), Université de Toulouse, CNRS, 118 route de Narbonne, 31062 Toulouse Cedex 9, France. 2LISBP, Université de Toulouse, CNRS, INRA, INSA F-31400 Toulouse, France. Correspondence and requests for materials should be addressed to F.L. (email: fabien. [email protected]) or P.G. (email: [email protected])
Received: 28 November 2016 Accepted: 16 December 2016 Published: 27 January 2017
OPEN
with specific entry points in the CM coupled to a functional analysis of the metabolism, we next demonstrate that DnaK significantly impacts the responsiveness of the CM by acting either directly at the level of the CM or along the first steps of carbon assimilation. How does the multifunctional DnaK chaperone modulate carbon consump-tion in response to proteostasis failure or in response to nutrient starvaconsump-tion is discussed.
Results
Central metabolism genes support bacterial growth in the absence of major chaperones.
The Δ tig Δ dnaKJ chaperone-deficient strain is a sensitive genetic tool to study proteostasis networks in bacteria and identify novel factors involved15,19,20. Our search for overexpressed E. coli genes that partially suppress thebacte-rial growth defect observed in the absence of these main chaperones led to the identification of several new genes involved in multiple cellular processes including transcription (dksA, csrC, fis), protein synthesis (leuX, serX,
proL), tRNA maturation (rnt), oxidative stress (tpx), metabolism (ldhA, lpd, ackA, talB, pykF, nagB, sseA, ydfG)
and a gene with unknown cellular functions (ypaB). This indicates that cells can use multiple pathways to coun-teract the severe proteostasis collapse induced by the lack of chaperones, as previously proposed8,15,19–21. A
com-plete list of the newly identified suppressors is shown in Fig. S1. Remarkably, we found that about one third of the multicopy suppressors isolated carried genes that are key players of the CM, which is defined as the main path-ways for cell anabolism and catabolism, including the Embden–Meyerhof–Parnas (EMP) pathway, the Pentose Phosphate (PP) pathway, the Entner-Doudoroff (ED) pathway and the Tricarboxylic Acid cycle (TCA cycle). The CM genes include ackA encoding the acetate kinase AckA that performs the reversible conversion of acetyl-phos-phate (AcP) into acetate, ldhA encoding the heat shock protein lactate dehydrogenase LdhA, mainly responsible for the production of D-lactate from pyruvate, lpd encoding the lipoamide dehydrogenase Lpd that is part of the glycine cleavage, the pyruvate dehydrogenase and α -ketoglutarate dehydrogenase complexes, pykF encoding the pyruvate kinase PykF, which converts phosphoenolpyruvate into pyruvate, talB encoding the transladolase B enzyme of the non-oxidative branch of the pentose phosphate pathway, and csrC, a small non coding RNA reg-ulating negatively CsrA, a central metabolism regulator22. These genes were individually cloned in the plasmid
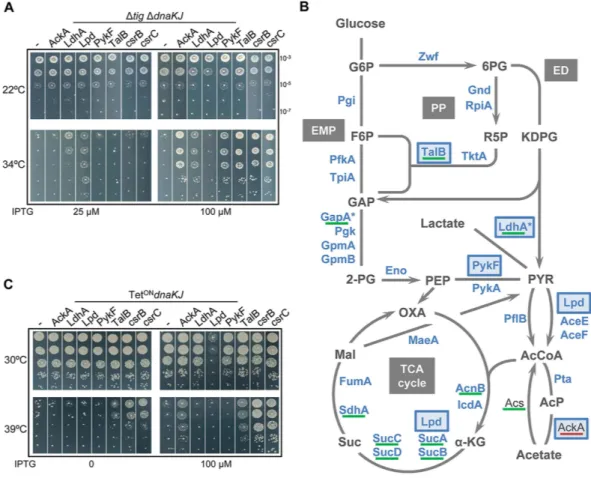
pSE380 under the control of an IPTG-inducible promoter and suppression of the Δ tig Δ dnaKJ double mutant growth defect at high temperature was confirmed (Fig. 1). In all cases, we found that suppression was optimal at 34 °C and not visible at 37 °C. Note that in addition to csrC we have cloned and expressed csrB, a non-coding RNA homologous to csrC, also known to negatively regulate CsrA, and found that it equally suppresses the tempera-ture-sensitive (Ts) phenotype (Fig. 1A). This suggests that a shutdown of CsrA regulatory mechanism helps cells to survive in the absence of chaperones22.
Partial suppression of the growth defect by genes of the CM suggests that some suppressors could possess chaperone function or be bone fide TF/DnaK substrates that do not fold very efficiently (or are degraded) in the absence of the chaperones, and whose overexpression restores a sufficient pool of active proteins. Some of these gene products might also have a high propensity to be unfolded and to aggregate, which could induce another stress response that potentially facilitates growth in the absence of TF and DnaK. In addition, with respect to the nature of the suppressors, their overexpression might also reroute metabolic reactions to bypass the need for TF and DnaK functions. This could occur either through their enzymatic properties or through transcriptional or post-transcriptional remodeling, as it might be the case for csrB/C via a shutdown of CsrA regulatory mechanism22,
or for AckA via its effect on AcP synthesis (see below). Although suppression by TalB remains enigmatic, the fact that Lpd, PykF and LdhA suppress the growth defect of the Δ tig Δ dnaKJ double mutant suggests that the TF/ DnaK chaperone pathway might contribute at the level of the pyruvate node, which involves the assembly of the large pyruvate dehydrogenase multimeric complex composed of 60 subunits of AceE, AceF and Lpd23. In support
of this, AceE, AceF and Lpd, were previously isolated as protein aggregates both in the single Δ dnaK strain and, more severely, in the double Δ tig Δ dnaK mutant8,12.
Interestingly, the recent DnaK interactome performed in E. coli wild type revealed that DnaK interacts with a large number of CM enzymes (about 50%, representing 5% of the proteome), including the suppressors LdhA, Lpd, PykF and TalB, and that endogenous expression of at least ten CM enzymes, including TalB and LdhA, increases significantly in the Δ dnaKJ mutant (Fig. 1B). Of note, the suppressor AckA was the only CM enzyme exhibiting a lower endogenous level in the absence of DnaKJ8. Therefore, we next asked whether the newly
iso-lated multicopy suppressors of the Δ tig Δ dnaKJ mutant could also suppress the Ts phenotype of DnaK depleted cells3. The plasmid-encoded suppressors were overexpressed in the MG1655 PtetONdnaKJ strain in which the
Fig. 1C show that overexpression of AckA, TalB, csrB or csrC was sufficient to suppress the Ts phenotype of the
dnaKJ mutant at 39 °C. The fact that some of the isolated CM genes partially suppress the Ts phenotype of the
double Δ tig Δ dnaKJ but not the one of the single dnaKJ mutant at high temperature, i.e., pykF, ldhA and lpd, sug-gests that these genes might be weaker suppressors of the defective DnaK/TF folding pathway, perhaps not capa-ble of supporting folding of critical high-temperature sensitive substrates of both TF and DnaK. Alternatively, suppression might be restricted to TF function, which could be supported by DnaK in its absence. In addition, we found that overexpression of Lpd was toxic at permissive temperature in the dnaKJ mutant but had only very little, or no effect in the Δ tig Δ dnaKJ double mutant (Fig. 1A and C). Further genetic characterization of these suppressors showed that there is no synthetic lethality between a dnaK mutation and mutations in the multicopy suppressor genes. Yet, in the case of lpd, we found that the double lpd Δ dnaKJ mutant was more severely affected for growth at the normally permissive-temperature of 30 °C when compared to the single isogenic mutants (Fig. S2). Together these data highlight important links between DnaK function and the CM.
Figure 1. Central metabolism genes rescue bacterial growth in the absence of major chaperones. (A) MG1655
Δ tig Δ dnaKJ mutant containing plasmid pSE380NcoI vector (− ), pSE-AckA, pSE-LdhA, pSE-Lpd, pSE-PykF, pSE-TalB, pSE-csrB or pSE-csrC were grown at 22 °C, serially diluted 10-fold, and spotted on LB ampicillin agar plates with (25 or 100 μ M) or without IPTG inducer. Plates were incubated for 1 day at 34 °C or 2 days at 22 °C. (B) Schematic representation of previously identified in vivo DnaK interactors by Calloni and coworkers (2012) within the central metabolic network. Interactors of DnaK are depicted in blue and newly identified suppressors from (A) are highlighted with a dark blue frame. Proteins significantly increased in the Δ dnaK mutant are underlined in green and those significantly decreased in red. Heat-shock proteins are marked with an asterisk. Metabolic network includes the Embden–Meyerhof–Parnas (EMP) pathway, the Pentose Phosphate (PP) pathway, the Entner-Doudoroff (ED) pathway and the Tricarboxylic Acid cycle (TCA cycle). Abbreviations: glucose-6-phosphate (G6P), fructose-6-glucose-6-phosphate (F6P), 6- phosphogluconate (6PG), ribose-5-glucose-6-phosphate (R5P), 2-keto-3-deoxy-6-phospho-gluconate (KDPG), glyceraldehyde-3-phosphate (GAP), 2-phospho-D-glycerate (2-PG), phosphoenolpyruvate (PEP), pyruvate (PYR), acetyl-CoA (AcCoA), acetyl-phosphate (AcP), α -ketoglutarate (α -KG), succinate (Suc), malate (Mal) and oxaloacetate (OXA). (C) Transformants of MG1655 PTetON dnaKJ
containing plasmid pSE380NcoI vector, pSE-AckA, pSE-LdhA, pSE-Lpd, pSE-PykF, pSE-TalB, pSE-csrB or pSE-csrC were grown to mid-log phase at 30 °C in LB supplemented with ampicillin and anhydrotetracycline to ensure expression of DnaKJ, serially diluted 10-fold, and spotted on LB ampicillin agar plates with or without IPTG. Note that the anhydrotetracycline inducer was not present in the plates to ensure the repression of the dnaKJ operon. Plates were incubated for 1 day at 30 °C or at 39 °C.
DnaK differentially impacts E. coli growth on specific carbon sources.
To further investigate such possible interplay between DnaK and the CM, we first tested whether specific patterns of carbon utilization could be observed in the absence of DnaK, depending on the entry point of the carbon sources in the CM. As stated above, one of the key cellular functions of DnaK is the downregulation of the entire HSR. In order to dis-tinguish between an HSR-dependent or -independent role of DnaK in the utilization of specific carbon sources, two mutant derivatives were used throughout this study: a Δ dnaKJ mutant, thus lacking all DnaK functions, and a σ 32 mutant, i.e., rpoH(I54N), known to escape the DnaK-dependent targeting to FtsH25. This σ 32 mutantharbors the isoleucine 54 to asparagine amino acid substitution in the first part of the second region defined as a small patch with a crucial function in σ 32 degradation25. The I54N mutation almost completely abolishes the
DnaK-dependent downregulation of the HSR without appreciably altering σ 32 binding to RNA polymerase25. The
use of such a mutant mimics a condition in which DnaK is present and where all the HSPs (including DnaK) are induced to levels comparable to those observed in a dnaKJ null mutant. Accordingly, steady state levels of σ 32 and
other HSPs were similar both in MG1655 rpoH(I54N) and MG1655Δ dnaKJ mutant strains (Fig. 2A).
The three isogenic strains were independently grown at the permissive temperature of 30 °C in minimal medium supplemented with single carbon sources (21 different carbon sources were tested in total) with selected entry points in the CM (Fig. S3), and growth rates were measured for each condition (Fig. 2B and Table S1). From these data, we defined 5 major classes of carbon sources according to the growth behavior of both Δ dnaKJ and
rpoH(I54N) mutants compared to wild type. Class I is represented by carbon sources that do not support growth
of both mutants, thus suggesting that the HSR is detrimental in this case; class II carbon sources support higher
Figure 2. DnaK’s impact on E. coli growth is carbon source-dependent. (A) Whole cell extracts of MG1655
wild type, Δ dnaKJ and rpoH(I54N) were separated on SDS-PAGE, stained with Coomassie Blue or analyzed
by western blot using anti-Lon, -DnaK, -GroEL, -DnaJ or -RpoH antibodies. (B) Heat maps representing the averaged growth rates obtained from three different biological replicates of the three strains grown on 21 carbon sources. The blue scale indicates high (darker) to low (lighter) growth rate. Carbon sources were grouped into five classes each representing a different growth behavior of either the Δ dnaKJ or the rpoH(I54N) mutant
compared to the wild type: class I groups carbon sources on which the two mutants did not grow, class II groups carbon sources on which both mutants exhibit higher growth rates than the wild type, class III groups carbon sources on which a growth defect of the dnaKJ mutant is observed, class IV groups carbon sources on which
dnaKJ mutant exhibits a lowest rate of growth compared to both the wild-type strain and the rpoH(I54N) mutant
and class V groups carbon sources on which no significant difference in growth was observed for both mutants and the wild type. Abbreviations NAG and NANA stand for N-acetyl-glucosamine and N-acetyl-neuraminate, respectively. (C) Representative growth curves of E. coli K-12 MG1655 wild type (green), Δ dnaKJ (red) and
rpoH(I54N) (blue) for each class: Glucosamine (class I), Pyruvate (class II), Ribose (class III), Succinate
growth rates for both mutants, which suggests a positive contribution of the HSR; class III carbon sources only support growth of both wild type and rpoH(I54N), and class IV contains carbon sources on which the Δ dnaKJ
mutant exhibits a reduced growth rate when compared to both wild type and rpoH(I54N). Both class III and IV
thus contain carbon sources for which DnaK likely plays a specific role independently of the HSR. Finally, class V represents carbon sources for which no significant difference could be observed between the strains (Fig. 2B). A representative growth is shown for each class in Fig. 2C. Growth complementation experiments of MG1655 Δ dnaKJ mutant transformed with a plasmid encoding DnaK and DnaJ confirmed that the carbon source-specific growth defects observed were indeed DnaKJ-dependent (Table S1).
These results demonstrate that the lack of DnaK has a major effect on bacterial growth on numerous relevant carbon sources, either alone (class III and IV) or via the fine tuning of HSP synthesis (class I and II). We found that the Δ dnaKJ and/or rpoH(I54N) mutations severely affected growth on carbon sources belonging to class I and
III but not on carbon sources belonging the class V, although some of these carbon sources share the same entry point in the CM, i.e., D-galactose (class I) and D-glucose (class V) enter at the level of glucose-6-phosphate; D-ribose (class III) and D-xylose (class V) at the level of X5P/R5P; D-mannose (class I), D-sorbitol (class III) and NAG (class V) at the level of fructose-6-phosphate (Fig. S3). This suggests that DnaK could act at the first steps of utilization of these compounds, perhaps at the level of their transport. The previously observed membrane local-ization of DnaK in E. coli is in line with such proposed DnaK function26. In the case of mannose, previous data
indicate that the absence of DnaK induces the repression of the manXYZ operon encoding for the mannose trans-porter27. Yet, DnaK also interacts directly with the ManX subunit of the mannose permease at a late step of its
folding process, thus suggesting that assistance by DnaK might also take place at the level of transporter assembly8.
The fact that glucosamine also uses the mannose transporter to enter the cell suggests a similar mechanism28.
DnaK affects the extracellular accumulation of metabolic by-products.
To further characterize the impact of DnaK in the CM, we next analyzed the different metabolites, i.e., the carbon substrates and the met-abolic by-products, present in culture supernatants using an untargeted quantitative NMR approach. Analyses were performed for each time point on culture supernatants collected during growth of the three strains on each of the 21 carbon sources. Representative sets of substrate consumption and bacterial growth experiments obtained on lactate, malate and glucose are shown as examples in Fig. 3A,C and E. Substrate consumption, growth and specific consumption rates (qs) for each strain on each carbon source are summarized in Table S2. Generallyqs vary accordingly to growth rates, leading to similar biomass yields for the three strains. Yet, in the case of
pyruvate and lactate, qs are lower for both mutants although growth rates are significantly higher. This suggests
that an increased level of HSPs induces an increased biomass yield on these carbon sources. Analysis of metabolic by-products revealed that pyruvate accumulates in the supernatant when wild type was grown on lactate Fig. 3B. In contrast, we found that the Δ dnaKJ mutant accumulates significantly less pyruvate when compared to the wild type, suggesting that pyruvate is more efficiently consumed in the absence of DnaK. Interestingly, three of the Δ tig Δ dnaKJ multicopy suppressors, namely LdhA, Lpd and PykF play a role in pyruvate production and utilization, thus suggesting that DnaK could regulate pyruvate utilization within the cell. Yet a direct involvement of DnaK at the pyruvate node remains to be determined.
More generally, analysis of metabolic by-products revealed that acetate and orotate were both efficiently detected in culture supernatants (Table S2), except for cells grown on glycerol. Acetate is known to be excreted during E. coli growth29 and accumulation of orotate is generally explained by the reading frame shift in rphE that
is present in E. coli MG1655, which generates a bottleneck within the pyrimidine biosynthesis pathway30. Molar
yields relative to substrates were also calculated using substrate consumption and metabolic by-product produc-tion (Table S2). All together, we found that DnaK significantly impacts the excreproduc-tion patterns of coproducts. The production of extracellular metabolic compounds (i.e., acetate, orotate, pyruvate, succinate and fumarate) for both mutants relative to the wild type grown on lactate, malate and glucose, respectively members of classes II, III and V, are shown in Fig. 3B,D and F. Note that orotate was not detected during growth on malate. Remarkably, the molar production yields of acetate and orotate are always lower for both mutants when compared to the wild type. Although acetate and orotate accumulation is generally considered growth rate dependent31, we found that this
does not always apply to both dnaK and rpoH mutants. Indeed, excretion of acetate and orotate is significantly reduced in both mutants when compared to the wild type, while their growth rates are similar or even higher on class V and II carbon sources, respectively. These data reveal a major role of DnaK and the HSR in the metabolism of acetate and orotate.
DnaK imposes a hierarchal order of carbon utilization when multiple carbon sources are present.
Our results show that Δ dnaKJ mutation can have a profound effect on E. coli growth according to the carbon source available. Yet, in its main ecological niche i.e., the mammalian intestine, E. coli generally has access to several carbon sources available to support bacterial growth and colonization of the intestine. Accordingly, it has been shown that E. coli can efficiently co-metabolize several sugars and that its survival and colonization abilities are defined by nutrient availability and consumption32. Therefore, we next investigated whether DnaK
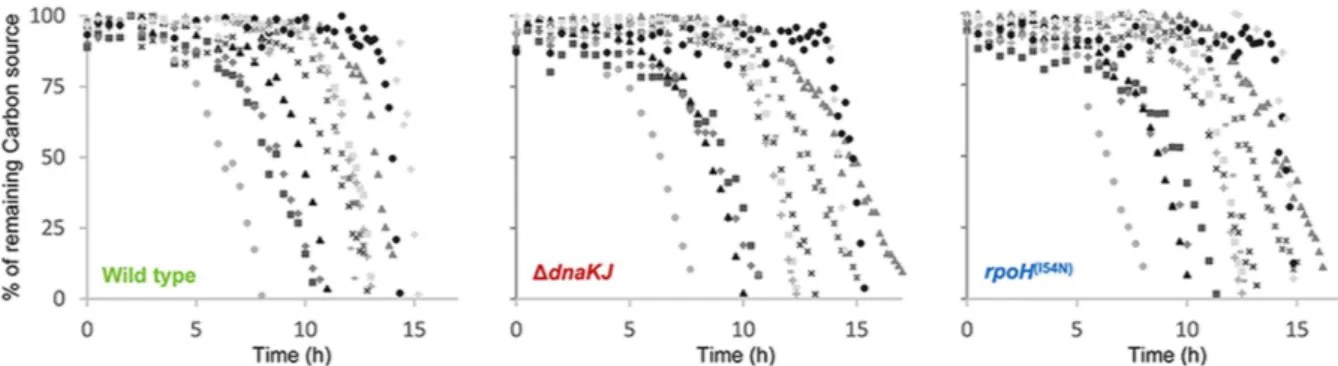
impacts carbon consumption when several carbon sources are simultaneously present in the same growth medium. To this aim, we followed bacterial growth, carbon consumption and excreted compounds of the three strains at 30 °C in a medium containing 13 different carbon sources, i.e., NAG, gluconate, D-galactose, N-acetyl-neuraminate (NANA), D-galacturonate, D-glucuronate, D-mannose, D-ribose, L-arabinose, glu-cosamine, maltose, L-fucose and acetate (0,5 g/l each), as described by Fabich and colleagues32. Of note, only 4
out of 13 carbon sources present in the mix, D-galactose, D-mannose, D-ribose, glucosamine did not support growth of the Δ dnaKJ mutant when present as sole carbon sources (Fig. 2). The results from Fig. 4A and B clearly show important differences between the strains. In this case, the order of nutrient preference was deter-mined at 50% of carbon consumption for each carbon source. The preference order for E. coli MG1655 wild
type, i.e., gluconate > NAG = galactose > NANA > ribose > arabinose = mannose = glucuronate = galacturo-nate > glucosamine > maltose > fucose, is similar to that determined by Fabich et al.32, except for gluconate and
NAG for which the preference order is reversed. The temperature of growth used in this work (30 °C versus 37 °C in ref. 32) could account for such difference. Although no significant difference in the order of carbon sources consumption could be observed between Δ dnaKJ and rpoH(I54N), the preference order of the two mutants
(gluconate > NANA = galactose > NAG > glucuronate = galacturonate = ribose = arabinose > mannose > malt-ose = fucmalt-ose > glucosamine) is significantly different than the one observed for the wild type, with NANA, glucu-ronate and galactuglucu-ronate being consumed earlier by both mutants (Fig. 4A and B). Together these results indicate that in the presence of multiple carbon sources DnaK significantly contributes to the establishment of a hierarchi-cal order of carbon utilization, mainly via its regulatory effect on the synthesis of HSPs.
This work also reveals that the Δ dnaKJ mutant can fully consume ribose and galactose within the mix-ture, while it could not when they were present as sole carbon sources. The same observation was made for the
rpoH(I54N) mutant in the presence of galactose. Similarly, the two mutants are now capable of consuming mannose
and glucosamine, both carbon sources that normally do not support growth of the mutants as sole carbon sources, albeit less efficiently than the wild type strain (Fig. 4A and B). The fact that the simultaneous presence of multi-ple carbon sources allows the utilization of DnaK-dependent substrates (Fig. 2) suggests that certain metabolic pathways and/or transporters in place somehow buffer for the absence of DnaK28,33. To address such a hypothesis,
we monitored mannose, glucosamine, ribose or galactose utilization by both wild type and Δ dnaKJ cells grown
Figure 3. Effect of DnaK on carbon sources utilization and extracellular accumulation of metabolic products. Growth kinetics and carbon utilization monitored for MG1655 wild type (green), Δ dnaKJ (red) and
rpoH(I54N) (blue) grown on lactate (A), malate (C) and glucose (E). Extracellular accumulation of metabolic
compounds detected during growth MG1655 wild type (green), Δ dnaKJ (red) and rpoH(I54N) (blue) on lactate
(B), malate (D) and glucose (F) corresponds to molar yields (mol of by-products formed/mol of carbon sources consumed) relative to those measured for the wild type. Growth was monitored by optical density measurement at 600 nm (OD600) and compounds in culture supernatant were quantified by 1D 1H-NMR every 30 min.
Figure 4. DnaK-dependent adaptive growth in complex mixture of carbon sources known to be present in intestinal environment. (A) Carbon sources consumption by MG1655 wild type (left panel), Δ dnaKJ (middle
panel) and rpoH(I54N) (right panel) in a chemically defined medium supplemented with 13 carbon nutrients
(0.5 g/l each). Carbon sources in culture supernatants were quantified by 1H 1D-NMR. (B) The period of time
where consumption of the indicated sugar began and was completed, are depicted by horizontal bars, green for the E. coli K-12 MG1655 wild type, red for Δ dnaKJ mutant and blue for rpoH(I54N)mutant. Abbreviations:
gluconate (Gnt), N-acetyl-glucosamine (NAG), galactose (Gal), N-acetyl-neuraminate (NANA), ribose (Rib), arabinose (Ara), mannose (Man), glucuronate (GlcU), galacturonate (GalU), glucosamine (GlcN), maltose (Malt), fucose (Fuc), and acetate (Ac). acetate (C) and orotate (D) concentrations in culture supernatant during growth in the complex mixture of carbon sources and % of extracellular accumulation (mol of by-products formed/mol of carbon sources consumed) relative to those measured for the wild type (left insets).
in binary mixtures of carbon sources containing mannose, glucosamine, ribose or galactose, together with one of each of the permissive carbon sources present in the multiple carbon source experiment from Fig. 4. We found that in the absence of DnaK, the presence of NAG, but none of the other carbon sources, could specifically trigger the utilization of both mannose and glucosamine (Fig. 5). Since the mannose uptake system, known to support the transport of both mannose and glucosamine34, is depleted in the absence of DnaK, it is likely that the presence
of NAG might specifically induce the production of non-specific transporter(s) for mannose and glucosamine. In sharp contrast, the utilization of both ribose and galactose by the Δ dnaKJ mutant was triggered by each of the other carbon sources tested here (Fig. 5). Although the precise cellular mechanism involved remains unknown, it shows that at least one other carbon or energy source is required to initiate utilization of these two compounds in the absence of DnaK. Together these results strongly suggest that different metabolic processes can support the utilization of DnaK-dependent carbon sources.
It is believed that acetate is utilized when consumption of preferential, high energy carbon sources is completed29.
In the case of the wild type strain, acetate utilization is concomitant with a full consumption of gluconate, galac-tose, NANA, NAG, arabinose, ribose, mannose, galacturonnate, glucoronate and glucosamine, while fucose and maltose are not yet consumed (Fig. 4B). For both mutants, acetate consumption initiates even before mannose and glucosamine consumption was completed, thus indicating that acetate is not the last carbon source to be consumed (Fig. 4B and C). Finally, the mutants also accumulate lower amount of orotate and acetate, as observed on single carbon sources (Fig. 3), thus further supporting a major role of DnaK in acetate and orotate production and/or excretion, independently of carbon availability and utilization.
DnaK severely impacts acetate metabolism.
The phenotypic analysis of Δ dnaKJ and rpoH(I54N)mutants (Figs 2 and 3) and the multicopy suppression of both Δ tig Δ dnaKJ and Δ dnaKJ mutants by AckA (Fig. 1) reveal major links between DnaK and acetate metabolism. To further investigate such interplay, we moni-tored bacterial growth either at high acetate concentration (40 mM), in which the phosphate acetyltransferase Pta and AckA pathway forms the major route for acetate utilization, or at low acetate concentration (6 mM), where acetate is mostly scavenged by the acetyl-coA synthetase Acs35. At high acetate concentration, the growth rate of
the Δ dnaKJ strain is severely reduced when compared to the wild type and the rpoH(I54N) strains, and is directly
correlated with a lower acetate consumption rate (Fig. S4). This is in agreement with both the multicopy suppres-sion by AckA and the reduced cellular concentration of AckA found in the absence of DnaK (Fig. 1)8. In contrast,
at low acetate concentration we observed a faster growth for both mutants when compared to the wild type, which was correlated with a higher acetate consumption rate (Fig. S4). This indicates that the absence of DnaK specifically slows down acetate utilization via the AckA-Pta pathway and, through the induction of HSPs, likely facilitates acetate utilization via Acs. Of note, overexpression of either Pta or Acs did not suppress the growth defect of the double Δ tig Δ dnaKJ mutant (Fig. S4), suggesting that AckA could be the only limiting enzyme for acetate production/utilization in such a chaperone deficient context. Interestingly, AckA, which is responsible for the reversible conversion of AcP into acetate, regulates the intracellular concentration of AcP, known to have global regulatory functions in E. coli.29 Since AcP, was shown to stimulate protein disaggregation and degradation
Figure 5. Mannose, glucosamine, ribose and galactose utilization in presence of one additional carbon source. Cultures of MG1655 wild type and Δ dnaKJ grown in LB media overnight at 30 °C were washed and
transferred in minimal M9 based-medium supplemented with glucose (2.7 g/L). Before cells enter the stationary phase, cells were washed and then inoculated at an initial OD600 of 0.1 in M9 based-medium supplemented
with binary mixture of two carbon sources one of which was mannose, glucosamine, ribose or galactose. Concentration of each carbon source in the medium was 1 g/L. Cultivations were performed in triplicate using a bioreactor block in an automatic high throughput fluxomic workstation (Freedom EVO 200, TECAN, Switzerland). Samples of culture supernatants were collected when cells stopped growing and analyzed by 1D 1H NMR, to determine the proportion of mannose, glucosamine, ribose or galactose remaining in the medium. All analyses showed exhaustion of all the others carbon sources. Abbreviations: gluconate (Gnt), N-acetyl-glucosamine (NAG), N-acetyl-neuraminate (NANA), arabinose (Ara), glucuronate (GlcU), galacturonate (GalU), maltose (Malt), fucose (Fuc).
under stress conditions36,37, these data suggest that DnaK could additionally maintain protein homeostasis by
modulating the levels of cellular AcP.
DnaK modulates carbon metabolic flux distribution within cells.
Our data suggest that the proper functioning of the CM might be affected by the absence of DnaK. However, despite a significant decrease in ace-tate excretion, the Δ dnaKJ mutation does not affect growth on carbon sources belonging to the class V, although their utilization massively involves the CM. One possible explanation in these cases, is that the Δ dnaKJ mutant undergoes a functional remodeling of the CM, which eventually leads to a silent growth phenotype38. Toinvesti-gate such possible phenomenon, metabolic flux maps of the wild type and the two mutants were established using a steady-state 13C-labeling experiment with a mixture of 80% 1-13C and 20% U-13C-glucose as sole carbon source
at the permissive temperature of 30 °C. Of note, Calloni and coworkers8 also used glucose to determine the DnaK
interactome and most current flux analyses have been performed on glucose as well, thus providing comparable data sets. In this case, labeled proteinogenic amino acids and extracellular metabolites were analyzed by 1D- and 2D-NMR methods (Table S3), and flux distribution within the central metabolism pathways was calculated from each isotopic dataset39.
The flux map obtained for the wild type strain (Fig. 6 and Table S4) showed that glucose is mainly catabolized via the EMP pathway. The fraction of glucose catabolized via the PP pathway represents 24% and only 1% via the ED pathway. At the end, 53% of the glucose enters the TCA cycle via the citrate synthase (Cs); the anaplerotic flux (Ppc) represents 21%. The flux distribution was similar to that previously described for E. coli wild type MG1655 at 37 °C, indicating that lowering the temperature does not detectably modify the functioning of the CM, although the growth rate is significantly lower (0.37 h−1 at 30 °C versus 0.56 h−1 at 37 °C).
Remarkably, metabolic fluxes through the PP pathway are significantly reduced for both mutants when com-pared to the wild type (Fig. 6 and Table S4). Of note, TalB, which is a robust suppressor of both Δ tig Δ dnaKJ and Δ dnaKJ mutants, is involved in the PP pathway. Whether TalB is a limiting factor in this case is not known. In the case of rpoH(I54N), the relative flux through the EMP pathway is higher than the ones observed for the
wild type and the Δ dnaKJ mutant, thus reflecting the reduced flux in the PP pathway for this mutant. The split ratio between the PP and the ED pathways for the Δ dnaKJ mutant is significantly higher when compared to the two other strains, with a flux through ED of 9%, thus leading to a corresponding decrease of the relative flux in the PP pathway (from 24% for the wild type to 11% for the mutant). Therefore, in the presence of glucose, the contribution of the PP pathway is significantly lower in the two mutants compared to the wild type strain due to a higher contribution of the EMP pathway for the rpoH(I54N) mutant, and of the ED pathway in the case of the
Δ dnaKJ mutant. Intriguingly, a comparable decrease of fluxes in the PP pathway was found for the lpd mutant in
E. coli, further supporting the link between DnaK and the suppressor Lpd described above40. Importantly, a
sig-nificant flux increase in the TCA cycle was observed for both Δ dnaKJ and rpoH(I54N) mutants. In this case, fluxes
that enter the TCA cycle were about 30% and 40% higher for the rpoH(I54N) and Δ dnaKJ mutants, respectively.
Correspondingly, the flux increase in the TCA cycle correlates with a major decrease in acetate production (about 50%).
In sum, these flux data show that in the absence of DnaK there is significant carbon flux redistribution in the PP and ED pathways, in the TCA cycle and in the acetate production. A similar rearrangement is observed in the
rpoH(I54N) mutant, except for the ED pathway, suggesting that DnaK’s impact on fluxes remodeling predominantly
occurs via the control of HSP synthesis.
Carbon fluxes distribution was also used to estimate the energetic fluxes in terms of NADPH and ATP pro-duction fluxes (Table S5). For both mutants, we found that there is a default in NADPH propro-duction at the level of the PP pathway that is efficiently compensated by the increased fluxes in the TCA cycle at the level of isocitrate dehydrogenase (Idh), which is involved in NADPH synthesis. This is in complete agreement with the fact that biomass yields and growth rates are comparable for the three strains (Fig. 2 and Table S2). In addition, increased fluxes in the TCA cycle also resulted in higher ATP production fluxes, which appeared to be more pronounced in the case of the Δ dnaKJ mutant (Table S5; see below).
Discussion
In this work, we have combined genetic, metabolomic and fluxomic approaches to investigate the role of the stress-responsive chaperone DnaK/HSP70 in the CM. We have identified several enzymes of the CM that partially compensate for the lack of DnaK and relevant carbon sources whose utilization was differentially affected by DnaK. In addition, we found that DnaK function significantly contributes to the establishment of a hierarchical order in the utilization of carbon sources when multiple carbon sources are simultaneously available during growth, thus indicating that DnaK modulates the uptake and consumption of available substrates. Moreover, we demonstrated that DnaK differentially affects the excretion of main metabolism coproducts, including ace-tate, and significantly impacts metabolic flux distribution, mainly by modulating fluxes through the TCA cycle. Together these results demonstrate that DnaK multitasking chaperone function is critical for the proper function-ing of the CM, actfunction-ing at several key steps of carbon utilization.
In many cases, we found that the effect of DnaK on the CM was directly connected to its role in downregu-lating the HSR. Remarkably, induction of HSPs either facilitates (class II carbon sources) or limits (class I carbon sources) the utilization of certain carbon sources (Fig. 2), and significantly modifies the order of carbon source consumption (Fig. 4). This indicates that a fine-tuning of HSP synthesis by endogenous DnaK level might rep-resent a highly efficient way to successfully adapt to carbon source changes or limitation. Interestingly, we found that the sidB1 mutation known to partially destabilize σ 32 independently of its interaction with DnaK and thus
to reduce the endogenous level of HSPs in a dnaK mutant41 significantly restored growth and utilization of class
strongly suggests that the loss of utilization of these carbon sources is indeed mediated by DnaK’s regulation of cellular HSP level.
The previously observed catabolic repression of the dnaKJ operon further supports such an adaptive model involving DnaK18. The fact that NANA, which is one of the most abundant components of mucins42, is consumed
earlier by both Δ dnaKJ and rpoH(I54N) mutants (Fig. 4) additionally suggests that induction of HSPs might confer
Figure 6. DnaK modulates metabolic flux distribution. Flux distributions within central metabolism for
the three strains: upper values in green, wild type; middle values in red, Δ dnaKJ mutant; lower values in blue,
rpoH(I54N)mutant. Underlined values indicate a flux increase (yellow) or decrease (purple) compared to the
wild type, respectively. The three different strains were grown at 30 °C in minimal medium supplemented with a mixture of 80% [1-13C] and 20% [U-13C] glucose. All fluxes are presented as a molar percentage of the
specific glucose uptake rate. The data are presented as flux ± 95% Confidence Interval (CI), the latter being determined by Monte-Carlo-based sensitivity analysis. Metabolite precursors for amino acid biosynthesis are depicted in relief. Abbreviations: fructose-1,6-bisphosphate (FBP), citrate (Cit), combined pool of 2- and 3-phosphoglycerate (2/3-PG), erythrose-4-phosphate (E4P), sedoheptulose-7-phosphate (S7P), Glucose-6-phosphate 1-dehydrogenase (zwf), Glucose-6-phosphate isomerase (Pgi), 6-phosphogluconate dehydrogenase (Gnd), Phosphogluconate dehydratase (Edd), fructose-bisphosphate aldolase (Ald),
Transaldolase (Tal), Transketolase (Tkt), Phosphoglycerate kinase (Pgk), Enolase (Eno), Pyruvate kinase (Pyk), Phosphoenolpyruvate carboxylase (Ppc), Citrate synthase (Cs), Pyruvate dehydrogenase (Pdh), Fumarase (Fum), Isocitrate dehydrogenase (Idh). All the other abbreviations are from Fig. 1
a substantial advantage during bacterial colonization43. Noticeably, our data also revealed that induction of HSPs
helps bacteria to grow on low acetate concentration (Fig. S4), thus suggesting that when preferential carbon sources are consumed, a DnaK-dependent induction of HSPs might also facilitate the utilization of metabolic co-products, such as acetate and pyruvate, to promote bacterial growth29.
Although this work clearly shows that DnaK, either alone or via the control of HSP synthesis, can act as a key modulator of the CM, the fact that the cellular abundance of a significant number of proteins is altered in a Δ dnaKJ mutant8, suggests that some of the observed changes in the CM could be indirect consequences of the
absence of DnaK or of the resulting constitutive activation of the heat-shock response, both known to induce large-scale transcriptional responses. This is in agreement with the proposed role of the stress-responsive DnaK chaperone as a major hub in the cellular proteostasis network8.
Previous studies showed that under stress conditions affecting cellular protein homeostasis, DnaK chaperone tasking is efficiently rerouted towards accumulating protein aggregates, subsequently leading to the rapid stabili-zation of σ 32 and a prolonged induction of HSPs, which includes major chaperones and proteases known to
coop-erate with DnaK11,44. Our data further extend this model, suggesting that the capture of DnaK by aggregates could
additionally provoke significant rearrangements of the metabolism, which might be crucial for cell survival under such circumstances. This includes changes in the CM regulatory networks, in the uptake of specific compounds, in the production of certain metabolites, and in the redistribution of carbon fluxes within the cell. Remarkably, the unexpected increase in metabolic fluxes through the TCA cycle induced by both the lack of DnaK and the induction of HSPs, suggests that titration of DnaK and the subsequent induction of HSPs might provoke a rapid increase in the flux of ATP production. Such phenomenon could well reflect the transient increase in cellular ATP that was previously observed following high temperature stress45. Since a significant fraction of major
chaper-ones and proteases involved in the cellular defense against protein aggregation are indeed ATP-dependent1, it is
reasonable to assume that such a DnaK-dependent process might represent a highly efficient way to accumulate rapid surplus of energy that becomes crucial for bacterial survival under proteostasis collapse8. Further work is
warranted to elucidate such a possible DnaK-dependent response that couples protein homeostasis to ATP pro-duction in bacteria.
Methods
Bacterial strains, phages, culture conditions and plasmid constructs.
The MC4100 mutant derivatives Δ dnaKJ::KanR, Δ tig::CmR Δ dnaKJ::KanR14, rpoH(I54N)25 have been previously described. Mutationsdescribed in this study were moved into the MG1655 genetic background by bacteriophage P1-mediated trans-duction. The W3110 Δ dnaK52::CmR thr::Tn10 has been previously described19. The Δ ackA::KanR, Δ ldhA::KanR,
Figure 7. Destabilizing σ32 in the absence of DnaK partially restores growth on class I carbon sources.
(A) Representative growth curves of MG1655 wild type (green), Δ dnaKJ (red), sidB1 (blue) and sidB1 Δ dnaKJ (yellow) on class I carbon sources, namely galactose, mannose, glucosamine. Strains were first grown at 30 °C in minimal M9 medium supplemented with glucose (2.7 g/L). Mid-log phase cultures were washed and then inoculated at an initial OD = 0.2 in M9 medium supplemented with 1 g/L galactose, mannose, glucosamine. Cultivations were performed in triplicate using a bioreactor block in an automatic high throughput fluxomic workstation (Freedom EVO 200, TECAN, Switzerland). (B) Samples of culture supernatants were collected when cells stopped growing and analyzed by 1D 1H NMR, to determine the
Δ lpd::KanR, Δ pykF::KanR and Δ talB::KanR mutant alleles were obtained from strain JWK2293, JWK1375,
JWK0112, JWK1666 and JWK0007, respectively (Keio collection). The Δ csrBΔ csrC::KanR is a kind gift of
Catherine Turlan and Agamemnon Carpousis (Toulouse). The MG1655 sidB1 derivatives were constructed as follows. The zhf-50::Tn10 (TetR) allele from CAG1845046 was first moved into MC4100 sidB1 strain using P1
transduction and selection at 30 °C on LB agar plates supplemented tetracycline (from Bernd Bukau via Costa Georgopoulos41). Following sequencing of the sidB allele, a new P1 lysate was prepared and used to transduce
the sidB1 allele linked to zhf-50::Tn10 (TetR) into MG1655 following selection at 30 °C on LB agar plates supple-mented tetracycline. Finally, the Δ dnaKJ::KanR mutant allele was then moved into MG1655 sidB+zhf-50::Tn10
(TetR) and MG1655 sidB1 zhf-50::Tn10 (TetR), thus resulting in a set of isogenic MG1655 derivatives. Bacteria were grown in LB or M9 based medium with specific carbon sources (see below) supplemented when necessary with chloramphenicol (10 μ g/ml), kanamycin (50 μ g/ml), ampicillin (50 μ g/ml) and tetracycline (15 μ g/ml).
Plasmid pSE380Δ NcoI is a derivative of pSE380 from Invitrogen (www.addgene.org/vector-database/4063/) in which a small region of the multi-cloning site (nt 268 to 306 that includes the NcoI to BstB1 restriction sites) has been deleted, leaving an EcoRI site directly downstream the original ribosome-binding site. This leads to the following sequence: CACAGGAGAATTCAGCA (ribosome-binding site underlined and EcoRI site bold)14.
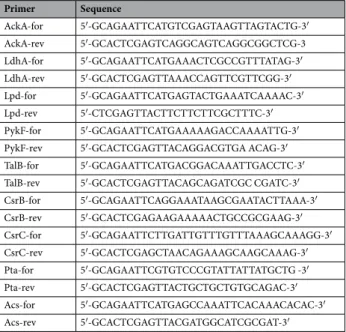
To construct the high-copy number plasmids pSE-AckA, pSE-LdhA, pSE-Lpd, pSE-PykF, pSE-TalB, pSE-csrB, pSE-csrC, pSE-Pta, pSE-Acs the 1203-bp ackA, 990-bp ldhA, 1425-bp lpd, 1413-bp pykF, 954-bp talB,369-bp csrB, 245-bp csrC, 2145-bp pta and 1959-bp acs coding sequences were PCR-amplified using appropriate primers listed in Table 1 and MG1655 genomic DNA as template. The PCR fragments were digested with EcoRI and XhoI and cloned into pSE380Δ NcoI previously digested with the same enzymes.
Genetic selection.
Genetic suppressors of the Δ tig Δ dnaKJ double mutant were isolated as follows. A pMPMA2–based E. coli multicopy genomic library (laboratory collection) was transformed into MG1655 Δ tig Δ dnaKJ and selection was performed at 35 °C on LB agar plates supplemented in ampicillin. From approximately 70 000 transformants tested, ninety two plasmids capable of suppressing the growth defect were first extracted and retransformed into the same strain in order to confirm suppression. The thirty two suppressors that passed the second selection were then sequenced. At the end we have identified 19 suppressor fragments encoding pro-teins that belong to diverse cell pathways (metabolism, protein processing, translation and transcription) or have unknown functions. Interestingly, six of the suppressor fragments contain genes involved in the central metabo-lism of the cell (Fig. 1).Bacterial growth on specific carbon sources.
Overnight cultures in LB at 30 °C were diluted 1/50, grown in M9 based medium with glucose (2 g/l) until mid-log phase (OD600 0,8) at 30 °C, washed with M9 saltsand inoculated at OD600 0,1 and grown aerobically in baffled Erlenmeyer flask containing M9 based medium
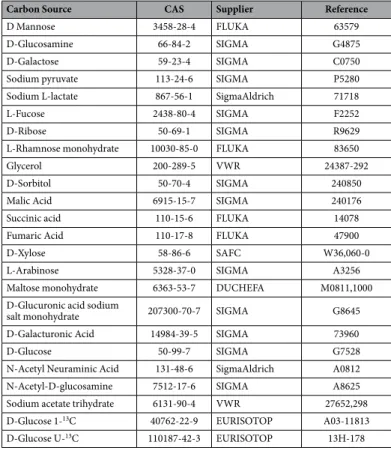
containing independently L-arabinose (1.2 g/l), D-glucose (1.2 g/l), malate (1.2 g/l), succinate (1.2 g/l), maltose (1.2 g/l), N-acetyl-glucosamine (1.2 g/l), glycerol (1.2 g/l), L-fucose (0.7 g/l), pyruvate (0.7 g/l), D-xylose (0.7 g/l), D-galactose (0.7 g/l), D-glucosamine (0.7 g/l), D-mannose (0.7 g/l), D-ribose (0.7 g/l), D-sorbitol (0.7 g/l), L-rhamnose (0.7 g/l), N-acetyl-neuraminate (0.7 g/l), L-lactate (0.7 g/l), D-glucuronate (0.7 g/l), galacturonate (0.7 g/l), fumarate (0.7 g/l) or acetate (0.35 g/l or 2.5 g/l). Carbon source references are listed in Table 2. Samples were taken every 30 min for 16 hours during bacterial growth on the different carbon sources described above. For each time point, OD600 was monitored, 500 μ l of culture was filtered (Sartolon polyamide 0.2 μ m, Sartorius)
CsrC-rev 5′ -GCACTCGAGCTAACAGAAAGCAAGCAAAG-3′
Pta-for 5′ -GCAGAATTCGTGTCCCGTATTATTATGCTG -3′
Pta-rev 5′ -GCACTCGAGTTACTGCTGCTGTGCAGAC-3′
Acs-for 5′ -GCAGAATTCATGAGCCAAATTCACAAACACAC-3′
Acs-rev 5′ -GCACTCGAGTTACGATGGCATCGCGAT-3′
and stored at − 20 °C before NMR analysis. In the case of the multiple carbon source assay the second inoculation was performed to an OD600 of 0,05 and grown in M9 containing N-Acetyl glucosamine, gluconate, galactose
N-acetyl-neuraminate, galacturonate, glucuronate, mannose, ribose, arabinose, glucosamine, maltose, fucose and acetate (0,5 g/l each). Samples were taken every 30 min for the first 6 hours then every 20 min until 15 hours and every 10 min for the last two hours. Each time OD600 was monitored and sample for NMR analysis were taken.
Sampling and NMR analysis of extracellular metabolites.
The main metabolic products which accumulated during growth in the extracellular medium were measured by NMR spectroscopy. Samples were analyzed by quantitative 1H 1D-NMR at 298 K, using 30° pulse and a relaxation delay of 10 s with an advanced800 MHz spectrometer (Bruker, Rheinstetten, Germany). A total of 64 scans were accumulated after 8 dummy scans. Molar yields have been calculated at the time of exhaustion of the primary carbon source. Spectra collected from samples of the 13 carbon source experiments contained at least one isolated peak for each carbon source from which the quantification of the compound could be performed unambiguously. This analysis was performed at 280 K.
Calculation of fluxes of ATP and NADPH production.
NADH, NADPH and FADH2: total productionof each reduced cofactor was calculated by adding fluxes of all reactions which produced the reduced cofactor. ATP: production of ATP via substrate-level phosphorylation was calculated by adding all the fluxes measured for all ATP producing reactions in carbon metabolism, and subtracting the fluxes of all ATP-consuming reactions. The ATP produced from NADH and FADH2 via oxidative phosphorylation was estimated assuming a P:O ratio
of 1.75 for both redox cofactors47.
13
C-metabolomic Flux analysis: sampling, analysis of proteinogenic amino acids by
two-dimensional NMR and flux calculation.
Overnight cultures of MG1655 wild type, Δ dnaKJ andrpoH(I54N) strains grown in LB at 30 °C were diluted 1/50 and grown in baffled Erlenmeyer flask containing M9
based medium with a mixture of 80% [1-13C] glucose and 20% [U-13C] glucose (Table S2) until mid-log phase
(OD600 0,8) at 30 °C. Cells were washed once with M9 salts inoculated to an OD600 of 0,05 and incubated at 30 °C
a second time in baffled Erlenmeyer flask containing M9 based medium with the same glucose labeled mixture at 30 °C to minimize the effect of unlabeled carbon. Note that the ratio of (1-13C) and (U-13C) glucose used in this
experiment was determined and optimized using the software Isodesign48.
Culture samples were collected for NMR analyses at an OD600 of 1 to ensure both isotopic and metabolic
steady-state conditions. In this case, 9 ml of solvent H2O/Methanol/Acetonitrile (20:40:40) was added to 1 ml
of cell culture to quench the metabolism and samples were stored at − 20 °C for 15 min. The mixture was then centrifuged at 12,000 g at − 20 °C for 5 min. Then, the 400 mg of harvested cells were incubated in 5 ml of 6 M HCl at 105 °C for 24 h for metabolite extraction. The acid was removed by evaporation (SC110A SpeedVac Plus),
Carbon Source CAS Supplier Reference
D Mannose 3458-28-4 FLUKA 63579
D-Glucosamine 66-84-2 SIGMA G4875
D-Galactose 59-23-4 SIGMA C0750
Sodium pyruvate 113-24-6 SIGMA P5280
Sodium L-lactate 867-56-1 SigmaAldrich 71718
L-Fucose 2438-80-4 SIGMA F2252
D-Ribose 50-69-1 SIGMA R9629
L-Rhamnose monohydrate 10030-85-0 FLUKA 83650
Glycerol 200-289-5 VWR 24387-292
D-Sorbitol 50-70-4 SIGMA 240850
Malic Acid 6915-15-7 SIGMA 240176
Succinic acid 110-15-6 FLUKA 14078
Fumaric Acid 110-17-8 FLUKA 47900
D-Xylose 58-86-6 SAFC W36,060-0
L-Arabinose 5328-37-0 SIGMA A3256
Maltose monohydrate 6363-53-7 DUCHEFA M0811,1000
D-Glucuronic acid sodium
salt monohydrate 207300-70-7 SIGMA G8645
D-Galacturonic Acid 14984-39-5 SIGMA 73960
D-Glucose 50-99-7 SIGMA G7528
N-Acetyl Neuraminic Acid 131-48-6 SigmaAldrich A0812
N-Acetyl-D-glucosamine 7512-17-6 SIGMA A8625
Sodium acetate trihydrate 6131-90-4 VWR 27652,298
D-Glucose 1-13C 40762-22-9 EURISOTOP A03-11813
D-Glucose U-13C 110187-42-3 EURISOTOP 13H-178
shown in Fig. S5. To investigate the sensitivity of metabolic fluxes, standard deviations were estimated using a Monte Carlo procedure. 100 iterations were performed for each dataset. All this procedure has been performed on two independent biological replicates.
Western Blot Analysis.
Western blot were performed has described earlier19. A rabbit antibody against Lon,a mouse antibody against DnaK, a rabbit antibody against GroEL, a rabbit antibody against DnaJ and a rabbit antibody against sigma 32 were used as primary antibodies, and HRP-conjugated rabbit IgG (1:5,000; Sigma) or mouse IgG (1:2,000; Sigma) were used as secondary antibodies. Membranes were developed using an ECL Plus (GE Healthcare) with a luminescence analyzer (LAS4000, Fuji).
References
1. Hartl, F. U. Chaperone-assisted protein folding: the path to discovery from a personal perspective. Nat Med 17, 1206–1210, doi: 10.1038/nm.2467 (2011).
2. Bukau, B., Weissman, J. & Horwich, A. Molecular chaperones and protein quality control. Cell 125, 443–451 (2006).
3. Genevaux, P., Georgopoulos, C. & Kelley, W. L. The Hsp70 chaperone machines of Escherichia coli: a paradigm for the repartition of chaperone functions. Mol. Microbiol. 66, 840–857 (2007).
4. Acebron, S. P., Martin, I., del Castillo, U., Moro, F. & Muga, A. DnaK-mediated association of ClpB to protein aggregates. A bichaperone network at the aggregate surface. FEBS Lett 583, 2991–2996, doi: 10.1016/j.febslet.2009.08.020 (2009).
5. Kramer, G., Boehringer, D., Ban, N. & Bukau, B. The ribosome as a platform for co-translational processing, folding and targeting of newly synthesized proteins. Nature Structural & Molecular Biology 16, 589–597 (2009).
6. Mogk, A. & Bukau, B. Molecular chaperones: structure of a protein disaggregase. Curr. Biol. 14, R78–R80 (2004).
7. Finka, A., Sharma, S. K. & Goloubinoff, P. Multi-layered Molecular Mechanisms of polypeptide Holding, Unfolding and Disaggregation by HSP70/HSP110 chaperones. Name: Frontiers in Molecular Biosciences 2, 29 (2015).
8. Calloni, G. et al. DnaK Functions as a Central Hub in the E. coli Chaperone Network. Cell Rep 1, 251–264, doi: 10.1016/j. celrep.2011.12.007 (2012).
9. Castanie-Cornet, M. P., Bruel, N. & Genevaux, P. Chaperone networking facilitates protein targeting to the bacterial cytoplasmic membrane. Biochim Biophys Acta 1843, 1442–1456, doi: 10.1016/j.bbamcr.2013.11.007 (2014).
10. Liberek, K., Galitski, T. P., Zylicz, M. & Georgopoulos, C. The DnaK chaperone modulates the heat shock response of Escherichia coli by binding to the sigma 32 transcription factor. Proc Natl Acad Sci USA 89, 3516–3520 (1992).
11. Guisbert, E., Yura, T., Rhodius, V. A. & Gross, C. A. Convergence of molecular, modeling, and systems approaches for an understanding of the Escherichia coli heat shock response. Microbiol Mol Biol Rev 72, 545–554, doi: 10.1128/MMBR.00007-08 (2008).
12. Deuerling, E. et al. Trigger Factor and DnaK possess overlapping substrate pools and binding specificities. Molecular Microbiology
47, 1317–1328 (2003).
13. Agashe, V. R. et al. Function of trigger factor and DnaK in multidomain protein folding: increase in yield at the expense of folding speed. Cell 117, 199–209 (2004).
14. Genevaux, P. et al. In vivo analysis of the overlapping functions of DnaK and trigger factor. EMBO Rep. 5, 195–200 (2004). 15. Vorderwulbecke, S. et al. Low temperature or GroEL/ES overproduction permits growth of Escherichia coli cells lacking trigger
factor and DnaK. FEBS Lett. 559, 181–187 (2004).
16. Powers, E. T., Powers, D. L. & Gierasch, L. M. FoldEco: a model for proteostasis in E. coli. Cell Rep 1, 265–276, doi: 10.1016/j. celrep.2012.02.011 (2012).
17. Burkholder, W. F. et al. Isolation and characterization of an Escherichia coli DnaK mutant with impaired ATPase activity. J Mol Biol
242, 364–377, doi: 10.1006/jmbi.1994.1587 (1994).
18. Gosset, G., Zhang, Z., Nayyar, S., Cuevas, W. A. & Saier, M. H., Jr. Transcriptome analysis of Crp-dependent catabolite control of gene expression in Escherichia coli. J Bacteriol 186, 3516–3524, doi: 10.1128/jb.186.11.3516-3524.2004 (2004).
19. Bruel, N. et al. Hsp33 Controls Elongation Factor-Tu Stability and Allows Escherichia coli Growth in the Absence of the Major DnaK and Trigger Factor Chaperones. J Biol Chem 287, 44435–44446, doi: 10.1074/jbc.M112.418525 (2012).
20. Ullers, R. S. et al. SecB is a bona fide generalized chaperone in Escherichia coli. Proc. Natl. Acad. Sci. USA 101, 7583–7588 (2004). 21. Oh, E. et al. Selective Ribosome Profiling Reveals the Cotranslational Chaperone Action of Trigger Factor In Vivo. Cell 147,
1295–1308, doi: 10.1016/j.cell.2011.10.044 (2011).
22. Romeo, T., Vakulskas, C. A. & Babitzke, P. Post‐transcriptional regulation on a global scale: form and function of Csr/Rsm systems.
Environmental microbiology 15, 313–324 (2013).
23. Murphy, G. E. & Jensen, G. J. Electron cryotomography of the E. coli pyruvate and 2-oxoglutarate dehydrogenase complexes.
Structure 13, 1765–1773 (2005).
24. Perrody, E. et al. A bacteriophage-encoded J-domain protein interacts with the DnaK/Hsp70 chaperone and stabilizes the heat-shock factor sigma32 of Escherichia coli. PLoS Genet 8, e1003037, doi: 10.1371/journal.pgen.1003037 (2012).
25. Yura, T. et al. Analysis of sigma32 mutants defective in chaperone-mediated feedback control reveals unexpected complexity of the heat shock response. Proc Natl Acad Sci USA 104, 17638–17643, doi: 10.1073/pnas.0708819104 (2007).
26. Bukau, B., Reilly, P., McCarty, J. & Walker, G. C. Immunogold localization of the DnaK heat shock protein in Escherichia coli cells. J
Gen Microbiol 139, 95–99 (1993).
27. Shimizu, K. Metabolic Regulation of a Bacterial Cell System with Emphasis on Escherichia coli Metabolism. ISRN biochemistry 2013, 645983, doi: 10.1155/2013/645983 (2013).
28. Tchieu, J. H., Norris, V., Edwards, J. S. & Saier, M. H. Jr. The complete phosphotransferase system in Escherichia coli. Journal of
molecular microbiology and biotechnology 3, 329–346 (2001).
29. Wolfe, A. J. The acetate switch. Microbiol Mol Biol Rev 69, 12–50, doi: 10.1128/mmbr.69.1.12-50.2005 (2005).
30. Jensen, K. F. The Escherichia coli K-12” wild types” W3110 and MG1655 have an rph frameshift mutation that leads to pyrimidine starvation due to low pyrE expression levels. Journal of Bacteriology 175, 3401–3407 (1993).
31. Valgepea, K., Adamberg, K. & Vilu, R. Decrease of energy spilling in Escherichia coli continuous cultures with rising specific growth rate and carbon wasting. BMC systems biology 5, 106, doi: 10.1186/1752-0509-5-106 (2011).
32. Fabich, A. J. et al. Comparison of carbon nutrition for pathogenic and commensal Escherichia coli strains in the mouse intestine.
Infect Immun 76, 1143–1152, doi: 10.1128/iai.01386-07 (2008).
33. Davidson, A. L. & Chen, J. ATP-binding cassette transporters in bacteria. Annu Rev Biochem 73, 241–268, doi: 10.1146/annurev. biochem.73.011303.073626 (2004).
34. Curtis, S. J. & Epstein, W. Phosphorylation of D-glucose in Escherichia coli mutants defective in glucosephosphotransferase, mannosephosphotransferase, and glucokinase. J Bacteriol 122, 1189–1199 (1975).
35. Kumari, S., Tishel, R., Eisenbach, M. & Wolfe, A. J. Cloning, characterization, and functional expression of acs, the gene which encodes acetyl coenzyme A synthetase in Escherichia coli. J Bacteriol 177, 2878–2886 (1995).
36. Mizrahi, I., Biran, D. & Ron, E. Z. Requirement for the acetyl phosphate pathway in Escherichia coli ATP-dependent proteolysis. Mol
Microbiol 62, 201–211, doi: 10.1111/j.1365-2958.2006.05360.x (2006).
37. Mizrahi, I., Biran, D. & Ron, E. Z. Involvement of the Pta-AckA pathway in protein folding and aggregation. Res Microbiol 160, 80–84, doi: 10.1016/j.resmic.2008.10.007 (2009).
38. Sauer, U. et al. Metabolic flux ratio analysis of genetic and environmental modulations of Escherichia coli central carbon metabolism.
J Bacteriol 181, 6679–6688 (1999).
39. Millard, P., Massou, S., Wittmann, C., Portais, J. C. & Letisse, F. Sampling of intracellular metabolites for stationary and non-stationary (13)C metabolic flux analysis in Escherichia coli. Anal Biochem 465, 38–49, doi: 10.1016/j.ab.2014.07.026 (2014). 40. Li, M., Ho, P. Y., Yao, S. & Shimizu, K. Effect of lpdA gene knockout on the metabolism in Escherichia coli based on enzyme activities,
intracellular metabolite concentrations and metabolic flux analysis by 13C-labeling experiments. Journal of biotechnology 122, 254–266, doi: 10.1016/j.jbiotec.2005.09.016 (2006).
41. Bukau, B. & Walker, G. C. Mutations altering heat shock specific subunit of RNA polymerase suppress major cellular defects of
E. coli mutants lacking the DnaK chaperone. EMBO J 9, 4027–4036 (1990).
42. Deplancke, B. & Gaskins, H. R. Microbial modulation of innate defense: goblet cells and the intestinal mucus layer. The American
journal of clinical nutrition 73, 1131S–1141S (2001).
43. Chang, D. E. et al. Carbon nutrition of Escherichia coli in the mouse intestine. Proc Natl Acad Sci USA 101, 7427–7432, doi: 10.1073/ pnas.0307888101 (2004).
44. Winkler, J. et al. Quantitative and spatio-temporal features of protein aggregation in Escherichia coli and consequences on protein quality control and cellular ageing. Embo Journal 29, 910–923 (2010).
45. Soini, J. et al. Transient increase of ATP as a response to temperature up-shift in Escherichia coli. Microbial cell factories 4, 9, doi: 10.1186/1475-2859-4-9 (2005).
46. Nichols, B. P., Shafiq, O. & Meiners, V. Sequence analysis of Tn10 insertion sites in a collection of Escherichia coli strains used for genetic mapping and strain construction. J Bacteriol 180, 6408–6411 (1998).
47. Feist, A. M. et al. A genome‐scale metabolic reconstruction for Escherichia coli K‐12 MG1655 that accounts for 1260 ORFs and thermodynamic information. Molecular systems biology 3, 121 (2007).
48. Millard, P., Sokol, S., Letisse, F. & Portais, J. C. IsoDesign: a software for optimizing the design of 13C-metabolic flux analysis experiments. Biotechnology and bioengineering 111, 202–208, doi: 10.1002/bit.24997 (2014).
49. Massou, S., Nicolas, C., Letisse, F. & Portais, J. C. Application of 2D-TOCSY NMR to the measurement of specific(13C-enrichments in complex mixtures of 13C-labeled metabolites. Metabolic engineering 9, 252–257, doi: 10.1016/j.ymben.2007.03.001 (2007). 50. Massou, S., Nicolas, C., Letisse, F. & Portais, J. C. NMR-based fluxomics: quantitative 2D NMR methods for isotopomers analysis.
Phytochemistry 68, 2330–2340, doi: 10.1016/j.phytochem.2007.03.011 (2007).
51. Neidhart, F. C. Escherichia coli and Salmonella. (Blackwell Science Ltd, 1996).
Acknowledgements
We thank Takashi Yura for the rpoH(I54N) strain; Catherine Turlan and Agamemnon Carpousis for csrB/C strain;
MetaToul platform (Toulouse, France), and more specifically Lindsay Peyriga and Edern Cahoreau for assistance with NMR spectroscopy; Pierre Millard for help with data management; Costa Georgopoulos and Fabien Jourdan for critical discussions; Nicolas Bruel and Gaëlle Bourriquen for their contribution at the early stages of this project. This work was supported by an ATIP-CNRS grant to PG and PRES/Region Midi-Pyrénées grant to F.A.
Author Contributions
F.A., M.P.C.C., N.S., M.D., A.M.C. performed experiments; F.A., M.P.C.C., N.S., M.D., A.M.C., J.C.P., F.L. and P.G. analyzed data; M.P.C.C. and J.C.P. revised the manuscript for important intellectual content; F.A., F.L. and P.G. designed research and wrote the paper.
Additional Information
Supplementary information accompanies this paper at http://www.nature.com/srep Competing financial interests: The authors declare no competing financial interests.
How to cite this article: Angles, F. et al. Multilevel interaction of the DnaK/DnaJ(HSP70/HSP40)
stress-responsive chaperone machine with the central metabolism. Sci. Rep. 7, 41341; doi: 10.1038/srep41341 (2017).
Publisher's note: Springer Nature remains neutral with regard to jurisdictional claims in published maps and