Publisher’s version / Version de l'éditeur:
Vous avez des questions? Nous pouvons vous aider. Pour communiquer directement avec un auteur, consultez la première page de la revue dans laquelle son article a été publié afin de trouver ses coordonnées. Si vous n’arrivez pas à les repérer, communiquez avec nous à PublicationsArchive-ArchivesPublications@nrc-cnrc.gc.ca.
Questions? Contact the NRC Publications Archive team at
PublicationsArchive-ArchivesPublications@nrc-cnrc.gc.ca. If you wish to email the authors directly, please see the first page of the publication for their contact information.
https://publications-cnrc.canada.ca/fra/droits
L’accès à ce site Web et l’utilisation de son contenu sont assujettis aux conditions présentées dans le site
LISEZ CES CONDITIONS ATTENTIVEMENT AVANT D’UTILISER CE SITE WEB.
Combustion Institute Canadian Section, 2008 Spring Technical Meeting
[Proceedings], 2008
READ THESE TERMS AND CONDITIONS CAREFULLY BEFORE USING THIS WEBSITE.
https://nrc-publications.canada.ca/eng/copyright
NRC Publications Archive Record / Notice des Archives des publications du CNRC :
https://nrc-publications.canada.ca/eng/view/object/?id=89ec8cf0-9b04-4aae-bfd0-807923b6938d
https://publications-cnrc.canada.ca/fra/voir/objet/?id=89ec8cf0-9b04-4aae-bfd0-807923b6938d
NRC Publications Archive
Archives des publications du CNRC
This publication could be one of several versions: author’s original, accepted manuscript or the publisher’s version. / La version de cette publication peut être l’une des suivantes : la version prépublication de l’auteur, la version acceptée du manuscrit ou la version de l’éditeur.
Access and use of this website and the material on it are subject to the Terms and Conditions set forth at
One-dimensional spectral line-of-sight attenuation for soot optical
property measurement
_____________________________________________ Proceedings of Combustion Institute – Canadian Section Spring Technical Meeting University of Toronto, Ontario May 12-14, 2008
One-Dimensional Spectral Line-of-Sight Attenuation for Soot
Optical Property Measurement
Kevin A. Thomson
a,*, Matthew R. Johnson
b, David R. Snelling
a, and Gregory J.
Smallwood
aa
Combustion Research, Institute for Chemical Process & Environmental Tech., NRC b
Mechanical & Aerospace Engineering, Carleton University
1. Introduction
Soot emission from industrial processes and engines has significant detrimental impacts on air quality and human health [1], and is recognized as an important factor in global warming [2]. Soot formation also plays an important role in the performance of these technologies. Therefore, developing methods to accurately quantify soot emission, reducing the environmental and health impact, and improving operating efficiency of combustion devices are high priorities for most countries, but in many cases require more detailed understanding of soot, both in terms of its optical properties and the fundaments of its formation and oxidation.
Soot formation in flames is a complex process that involves hundreds of different chemical species, inception and growth of particles in the nanometer range, and the agglomeration of small particles to larger aggregates (e.g., [3,4]). A number of kinetic models have been proposed during the last decades [5-8], however, the full mechanisms governing soot formation remain elusive.
Progress in experimentally based soot formation research is highly dependent on availability of accurate and practical particulate matter diagnostics. Line-of-sight attenuation (LOSA), laser induced incandescence (LII), and spectral soot emission (SSE) are all valuable tools for spatially resolved measurement of soot concentration flames or exhaust plumes; however, the accuracies of these diagnostics are strongly dependent on the absolute magnitude and spectral variation of the soot refractive index absorption function E(m).
In a recent publication, Thomson et al. [9] presented a novel variation of 2D-LOSA which uses a diffuse light source and allows highly sensitive attenuation measurements. With a minor change to the detection system of this diagnostic, it is possible to achieve one-dimensional, spectrally resolved line-of-sight attenuation measurements. This diagnostic, termed Spec-LOSA, provides a valuable tool to evaluate the variability of soot extinction coefficients and in some cases the spectral variation of the soot refractive index absorption function with wavelength of soot aerosols. In this paper, the Spec-LOSA diagnostic is presented and then demonstrated through measurements at various heights in a Gülder ethylene/air co-annular non-premixed flame.
2. Theory
Line-of-sight-attenuation (LOSA) is a well established optical method for measuring concentration of particles in an aerosol laden stream (see [9] and references therein). In LOSA measurements, the optical transmissivity of an aerosol containing medium is measured along a linear path through the medium. The transmissivity of the path, , at wavelength λ, is measured as the ratio of light intensity before, Iλ,0, and after
passing through the attenuating medium, Iλ. The transmissivity is functionally related to a line integral of
the local extinction coefficients, K(e), along the path via:
*
(e)
,0exp
d
I
K
s
I
(1)Transmissivity measurements are line-averaged; however, in a medium with axi-symmetric property variation, multiple transmissivity measurements along parallel chords in a plane normal to the axis of symmetry can be inverted to determine the local properties [10,11]. In the present case, the line-integrated property is
ln
ed
y
K
s
and the local property isK
e
r
. For spectrally resolved transmissivity data, the transmissivity data at each wavelength is inverted independently.The relationship among soot concentration, extinction, absorption, and scatter for fractal aggregates made up of primary particles that fall in the Rayleigh range (i.e. dp/ < 0.3, where dp is the diameter of a
primary particle), is well predicted by Rayleigh–Debye–Gans/polydisperse-fractal aggregate (RDG/PFA) theory [12-15]. From RDG/PFA theory, soot concentration relates to extinction coefficient as:
sa,
,
6
6 1
a e vK
K
f
E m
E m
(2)where E(m) is the soot absorption function and sa,is the ratio of the total scattering coefficient (over 4*π
steradian), K(s), to the absorption coefficient, K(a). From RDG/PFA theory, it is possible to estimate sa,
and therefore K(a); however, detailed knowledge of the soot morphology (e.g. the primary particle diameter and number of particles per aggregate, etc.) is required. Correct determination of fv further
requires knowledge of E(m), which is a much contested parameter (e.g., [16-21]). For attenuation
measurements, it is only necessary to know E(m)at the measurement wavelength and the uncertainty in fv
scales with the uncertainty in E(m) which is estimated at 20% [19]. However, in soot emission based
techniques such as two-colour LII or SSE, relative variation of E(m)over the measurement wavelengths
impacts measured soot temperature which in turn greatly impacts the accuracy of measured soot concentration.
In circumstances where light scatter is negligible (i.e. for very small soot aggregates) or for soot of known morphology, Spec-LOSA provides a tool to investigate the relative variation E(m) with λ:
,
6
a a vK
E m
K
f
(3)since fv is constant in a given measurement. Absolute measurement of E(m) is possible if fv can be
measured by another method such as gravimetric sampling (e.g. [22]).
3. Apparatus
In most applications of line-of-sight attenuation, a monochromatic transmissivity measurement through an attenuating medium is achieved either by using a monochromatic light source or a detector which is filtered such that it only detects one wavelength of light. In the present experiments a „white‟ or broadband light source and an imaging spectrometer as the detector is used so that transmissivity of the medium as a function of wavelength can be measured over a wide spectral range.
The apparatus is shown schematically in Figure 1. Two consumer grade 50 W halogen spotlights coupled with an integrating sphere produce an intense diffuse light source with a diameter of 25 mm. The output plane of the sphere is imaged to the centre of the particulate laden medium (e.g. a flame) with a pair of optically conjugate achromatic lens (focal lengths 100 and 150 mm, diameters 50 mm) with a nominal magnification of 1.5. The center of the medium is imaged onto the horizontally oriented entrance slit of a holographic imaging spectrometer using a Nikon Micro 105 mm focal length lens. The f-number of lenses between the diffuse source and the flame (~f/3) is purposely much lower than that for the flame imaging lenses (f/22) to avoid vignetting, even in the presence of beam steering [9]. The CCD on the output plane of the spectrometer measures horizontal spatial position on one axis and wavelength on the second. The spectrometer can resolve and measure light intensity in a spectral band from 250 to 1050 nm; however, this
range is reduced due to the spectral output of the light source, attenuation of some UV light by the optics, and the sensitivity of the detector. The effective working range of the system is 450 to 950 nm.
Halogen Lamp (2) Integrating Sphere Source Imaging Lenses Flame Source Image Plane Flame Imaging Lenses Spectrometer and CCD Flame Image Plane
Figure 1: Schematic of Spec-LOSA diagnostic
In an experimental setting I,0 and I (see Equation 1) are not measured directly. Instead, a transmissivity
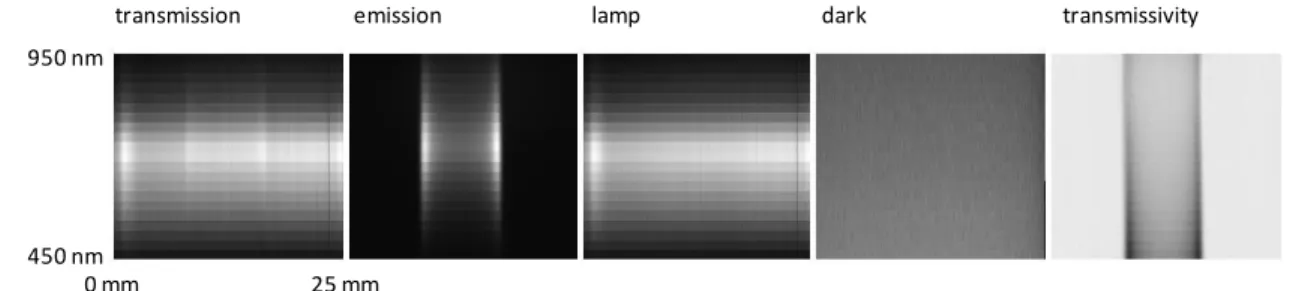
measurement is typically achieved by a sequence of four measurements. These are the detected intensity of the lamp without the attenuation medium present (lamp), the intensity measured in the absence of lamp and attenuating medium (dark), the intensity with both the lamp and attenuating medium (transmission), and the intensity measured from the attenuating medium in the absence of the lamp (emission). The transmissivity is then calculated as λ = (transmission – emission)/(lamp-dark).
A Gülder laminar non-premixed co-annular burner was used in these experiments. Fuel is emitted from a central steel fuel nozzle with an o.d. of 12.7 mm and an i.d. of 10.9 mm. Air is emitted from a co-annular tube with an i.d. of 100 mm. The air flow is straightened using a combination of glass beads and sintered metal foam. The air flow rate was 284 slpm (20°C, 101.3 kPa) and the fuel was ethylene at 194 sccm. Spec-LOSA measurements were made at a height above the burner (HAB) of 5, 10, 42, and 55 mm. The heights of 5 and 10 mm were selected as examples of young and small soot aggregates for which light scatter should be negligible. The height of 42 mm was selected because the soot morphology has been characterized at this location and thus the extinction measurements can be corrected for scatter. Finally, the measurement at 55 mm provides an example of mature, partially oxidized and small soot for which light scatter is idealized as being negligible.
4. Results
Data was collected for the ethylene/air laminar non-premixed co-annular diffuse flames using the Spec-LOSA optical arrangement. At each measurement height image sets consisted of 30 shot acquisitions for each measurement (i.e., lamp, dark, transmission and emission) averaged to reduce shot noise and allow analysis of the measurement uncertainty. A typical set of averaged images is shown in Figure 2, along with the transmissivity calculated from these images. The vertical axis of each image is the spectral axis. The horizontal axis is the spatial axis. Whereas the raw data has a resolution (spectral x spatial) of 2 nm x 25 µm per pixel, the data used for calculations is binned into 25 nm x 50 µm bins to reduce shot noise.
transmission emission lamp dark transmissivity
450 nm 950 nm
0 mm 25 mm
To determine radially resolved extinction, the curves of negative natural logarithm of transmissivity for each 25 nm bin were inverted using the 3-point Abel inversion [10]. The results for each height in the flame are included in Figure 3.
Figure 3: Extinction coefficients [1/mm] at HAB = a.) 5 mm, b.) 10 mm, c.) 42 mm, d.) 55 mm
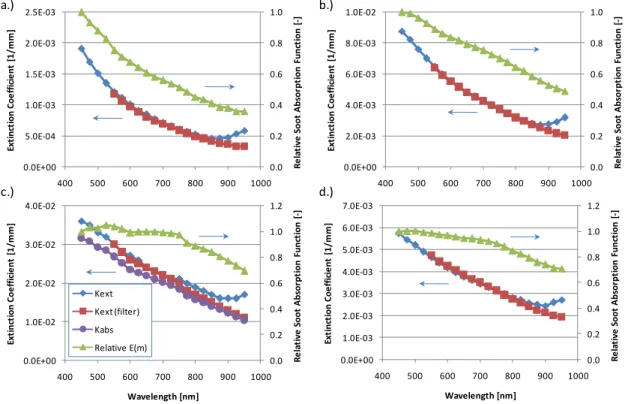
For each of the four heights, an average extinction coefficient was determined by performing an annular integration of the extinction coefficient over the soot containing radii at that height (e.g. r = 3.5 to 5.5 mm for HAB = 5 mm). These results are plotted as a function of λ in Figure 4. A trend of decreasing extinction coefficient with increasing wavelength is observed for wavelengths of 450 through ~850 nm; however, above this wavelength, the extinction coefficient unexpectedly begins to rise again. It is postulated that this upward trend is an artifact of the spectrometer, where a portion of the radiation entering the spectrometer at a wavelength λ will image on the CCD at the same location as radiation for a wavelength of 2λ is imaged. This is referred to as „second order‟ radiation. For radiation in the wavelength range of 350 to 475 nm, a second order contamination is possible in the spectral range of 700 – 950 nm. Since the extinction coefficient is higher at lower wavelengths, the bias is towards higher „observed‟ extinction coefficients. The degree of bias is a function of the ratio of the lamp intensities at λ and 2λ. Biases at measurement wavelengths below 700 nm are unlikely since the lamp intensity below 350 nm is very weak and the optics in the imaging lens strongly attenuate light below this wavelength. However, above 700 nm, a second order effect is possible and is observed.
To improve the estimate of the extinction coefficient for higher wavelengths, a colour glass filter was placed before the imaging lens which cuts out all radiation below 530 nm, thus eliminating the possibility of second order contamination. This filtered measurement corresponds to the curve with square symbols plotted in Figures 4 a.) thru d.). With the second order contamination removed, the extinction coefficient decreases with increasing wavelength over the full measurement range as was originally expected.
In order to study the relative variation of the soot absorption function with wavelength, the extinction coefficients must be corrected for scatter. For HAB = 5, 10, and 55 mm, no information is available on the soot morphology; however, the soot is expected to be small and thus the assumption is made that
) (a
K K(e). For HAB = 42 mm, soot morphology has been measured and scatter corrections are calculated following the method outlined in [22] for soot morphology parameters of: Df = 1.767, kf = 6.519,
dp = 29 nm, Ng = 21.4, and 2g = 3.3. Please see [22] for explanations of these parameters. The scatter
corrected absorption coefficients are included in Figure 4 c.). The maximum correction at λ = 450 is 10% with a correction of about 4% at λ = 950 nm.
It is common to assume that the soot absorption function E(m) is invariant with wavelength over the
visible and near infrared (e.g. [19]). The results in Figure 4 seriously challenge this assumption for in-flame soot in an ethylene/air non-premixed in-flame. For HAB = 5 mm, there is a 64% drop in the relative magnitude of E(m) over the measured wavelength range of 450 to 950 nm. The variation becomes less
pronounced with increasing HAB with a 51% drop for 10 mm, 30% for 42 mm and 29% at 55 mm.
This observation is tempered by the acknowledgement that a scatter correction was either not made or includes a degree of uncertainty when it was applied. Scatter increases with decreasing wavelength and would have a „flattening effect‟ on the relative absorption function curves. However, a scatter to absorption ratio of 2 would be needed to make the relative absorption function value at λ = 450 nm equal to the value at λ = 950 nm for HAB = 5 mm. It was mentioned previously that sa,450nm for HAB = 42 nm is
about 0.1. Therefore a value of 2 for HAB = 5 mm is highly improbable. The trend of curve flattening with increasing HAB (despite increasing aggregate size) supports the premise that soot optical properties
a.) b.) c.) d.) e x ti n c ti o n c o e ff ic ie n t [1 /m m ]
radius [mm] radius [mm] radius [mm]
change (significantly) as the soot ages. Alternatively, light absorption from large gas phase species such as polycyclic aromatic hydrocarbons (PAH) contributes to total attenuation in the visible and near-infrared.
0.0 0.2 0.4 0.6 0.8 1.0 0.0E+00 5.0E-04 1.0E-03 1.5E-03 2.0E-03 2.5E-03 400 500 600 700 800 900 1000 R e la ti v e S oo t A bs or pt ion F un ct ion [ -] E xt inc ti on C oe ff ic ie nt [ 1 / m m ] Wavelength [nm] 0.0 0.2 0.4 0.6 0.8 1.0 0.0E+00 2.0E-03 4.0E-03 6.0E-03 8.0E-03 1.0E-02 400 500 600 700 800 900 1000 R e la ti v e S oo t A bs or pt ion F un ct ion [ -] E xt inc ti on C oe ff ic ie nt [ 1 / m m ] Wavelength [nm] 0.0 0.2 0.4 0.6 0.8 1.0 1.2 0.0E+00 1.0E-02 2.0E-02 3.0E-02 4.0E-02 400 500 600 700 800 900 1000 R e la ti v e S oo t A bs or pt ion F un ct ion [ -] E xt inc ti on C oe ff ic ie nt [ 1 / m m ] Wavelength [nm] Kext Kext (filter) Kabs Relative E(m) 0.0 0.2 0.4 0.6 0.8 1.0 1.2 0.0E+00 1.0E-03 2.0E-03 3.0E-03 4.0E-03 5.0E-03 6.0E-03 7.0E-03 400 500 600 700 800 900 1000 R e la ti v e S oo t A bs or pt ion F un ct ion [ -] E xt inc ti on C oe ff ic ie nt [ 1 / m m ] Wavelength [nm] a.) b.) c.) d.)
Figure 4:
K
(e),K
(e) for Schott OG530 filtered spectrometer, and relative soot absorption function for HAB = a.) 5 mm, b.) 10 mm, c.) 42 mm, and d.) 55 mm.K
( )a for HAB = 42 mmAs a final observation on soot optical properties and as a further demonstration of the utility of Spec-LOSA, the data presented in Figure 3 c.) is revisited. A closer examination of the curves for different wavelengths reveals that the variation of K(e) with wavelength varies with radial location. For soot formed in the fuel rich core of the flame, the variation of K(e)with wavelength is more pronounced. The „wing‟ in the outer radii of the profile represents soot which formed in the annular flame reaction zone immediately above the fuel nozzle and which is almost completely oxidized since the annular wings in the soot concentration profiles disappear just above HAB = 42 mm. The variation of K(e) with wavelength for this soot is much less pronounced. This difference is quantified by recalculating the average extinction coefficients and relative soot absorption functions for the two regions (i.e. r < 1.7 mm and 1.9 < r < 2.3 mm). The results are included in Figure 5 where it is shown that the variation of E(m) is 31% in the core
and only 16% in the annulus.
0.0 0.2 0.4 0.6 0.8 1.0 1.2 400 500 600 700 800 900 1000 R e la ti v e E (m ) [-] Wavelength [nm] Core Region Annulus
5. Conclusions
Spec-LOSA is a powerful diagnostic to explore the important issue of variation of soot optical properties with wavelength. The diagnostic allows measurement of spectrally resolved extinction coefficients in the wavelength range of 450 to 950 nm. The diagnostic has been applied to a non-premixed ethylene/air flame and used to calculate relative variation of the soot absorption function, E(m), with wavelength. It is
observed that there is significant decrease of the absorption function with increasing wavelength for young soot. For higher heights in the flame, there continues to be a ~20% decrease of E(m) over the spectral
measurement range. Not only does relative E(m) vary with HAB, it also varies with radius, suggesting
that soot optical properties vary with soot formation history. This is a very preliminary study and further testing is needed to validate and further understand the results.
6. Acknowledgements
The NSERC PERD Program and the NRC/Helmholtz collaborative research fund are acknowledged for their support. Mr. Adam Coderre is thanked for his assistance with scatter correction calculations.
References
[1] U.S. EPA, “Air Quality Criteria for Particulate Matter,” EPA 600/P-99/002aF-bF (2004).
[2] IPCC “Climate Change 2007: The Physical Science Basis” Cambridge University Press, 996 pp. (2007)
[3] B.S. Haynes and H. Gg. Wagner, Prog. Energ. Combust. 7:229-273 (1981). [4] H. Bockhorn, Phil. Trans. R. Soc. Lond. A, 358:2659-2672 (2000)
[5] P. A. Vlasov and J. Warnatz, Proc. Combust. Inst., 29:2335-2341 (2002). [6] A. D‟Alessio et al., Proc. Combust. Inst., 24:973 (1992).
[7] M. Frenklach, Phys. Chem. Chem. Phys., 4:2028-2037 (2002). [8] A. V. Krestinin, Combust. Flame, 121:513-524 (2000). [9] K. A. Thomson et al., Applied Optics, 47:694-703 (2008). [10] C. J. Dasch, Applied Optics, 31:1146–1152 (1992). [11] K. J. Daun et al., Applied Optics, 45:4638-4646 (2006). [12] P. A. Bonczyk and R. J. Hall, Langmuir, 7:1274–1280 (1991).
[13] R. A. Dobbins and C. M. Megaridis, Applied Optics, 30:4747–4754 (1991). [14] Ü. Ö. Köylü and G. M. Faeth, Combustion and Flame, 89:140-156 (1992). [15] C. M. Sorensen, Aerosol Science and Tech., 35:648–687 (2001).
[16] W.H. Dalzell and A.F. Sarofim, J. Heat Transfer, 91:100-104 (1969). [17] B.J. Stagg and T.T. Charalampopoulos, Comb. Flame, 94:381-396 (1993). [18] S.C. Lee and C.L. Tien, 18th Symp. (Int'l), The Comb. Inst., 1159-1166 (1981). [19] S.S. Krishnan, K.C. Lin, G.M. Faeth, J. Heat Transfer, 122:517-524 (2000). [20] M.Y. Choi et al., Combustion and Flame, 102:161-169 (1995)
[21] D.R. Snelling, F.S. Liu, G.J. Smallwood, O.L. Gulder, Comb. Flame, 136:180-190 (2004).
[22] A. R. Coderre et al., Proceedings of Combustion Institute Canadian Section Spring Technical Meeting, Toronto, ON, (2008).
![Figure 3: Extinction coefficients [1/mm] at HAB = a.) 5 mm, b.) 10 mm, c.) 42 mm, d.) 55 mm](https://thumb-eu.123doks.com/thumbv2/123doknet/14167603.474116/5.918.155.773.121.279/figure-extinction-coefficients-mm-hab-mm-mm-mm.webp)