HAL Id: hal-01585070
https://hal.sorbonne-universite.fr/hal-01585070
Submitted on 11 Sep 2017
HAL is a multi-disciplinary open access archive for the deposit and dissemination of sci-entific research documents, whether they are pub-lished or not. The documents may come from teaching and research institutions in France or abroad, or from public or private research centers.
L’archive ouverte pluridisciplinaire HAL, est destinée au dépôt et à la diffusion de documents scientifiques de niveau recherche, publiés ou non, émanant des établissements d’enseignement et de recherche français ou étrangers, des laboratoires publics ou privés.
Distributed under a Creative Commons Attribution| 4.0 International License
North Atlantic polar lows and weather regimes: do
current links persist in a warmer climate?
Paul-Etienne Mallet, Chantal Claud, Marie Vicomte
To cite this version:
Paul-Etienne Mallet, Chantal Claud, Marie Vicomte. North Atlantic polar lows and weather regimes: do current links persist in a warmer climate?. Atmospheric Science Letters, Wiley, 2017, 18 (8), pp.349-355. �10.1002/asl.763�. �hal-01585070�
(wileyonlinelibrary.com) DOI: 10.1002/asl.763
North Atlantic polar lows and weather regimes:
do current links persist in a warmer climate?
Paul-Etienne Mallet,1,2* Chantal Claud1 and Marie Vicomte11LMD/IPSL, École polytechnique, Université Paris Saclay, ENS, PSL Research University, Sorbonne Universités, UPMC Univ Paris 06, CNRS, Palaiseau, France
2Laboratoire d’Optique Atmosphérique, Université de Lille, France
*Correspondence to: P.-E. Mallet, Laboratoire d’Optique Atmosphérique, Université de Lille, Villeneuve d’Ascq Cedex, Lille 59655, France. E-mail: [email protected] Received: 17 January 2017 Revised: 7 July 2017 Accepted: 11 July 2017 Abstract
Polar low development over the North Atlantic under a warmer climate is assessed using simulations of an atmospheric – oceanic coupled general circulation model, specifically with regards to the evolution of large-scale atmospheric variability described by weather regimes, and their links with lower-layer static stability. While a relationship has been identified for the present climate, under a warmer climate, polar low favorable conditions are expected to occur less often, and the large-scale circulation variability appears to have reduced influence on stability, and thus, on polar low occurrence.
Keywords: polar lows; weather regimes; North Atlantic; climatic projections
1. Introduction
Polar lows (PLs) are severe meso-cyclones forming during winter at high latitudes over ice-free ocean. They are associated with heavy snow falls, strong surface winds, rough seas and very poor visibility (e.g. Ras-mussen and Turner, 2003). The Norwegian and Barents Seas have long been known to be particularly subject to PLs, but with the advent of satellite data, it has been observed that such cyclones form in several regions prone to Cold Air Outbreaks, such as the Labrador Sea. Because of a rather low forecasting ability and their sudden development, PLs pose a significant danger to people and infrastructure in the affected regions (e.g. Rojo et al., 2015). The development and intensification of PLs result from several mechanisms, the two main ones being baroclinic instability and convective development. PLs can be purely baroclinic or purely convective, but most of PLs are hybrids, and convective development dominates over the North Atlantic (Rasmussen and Turner, 2003). Among the environmental variables recognized as ‘key variables’ associated with PL formation (e.g. Businger, 1985; Noer and Ovhed, 2003), the convective heating driven by surface fluxes appears particularly well suited to distinguish between cyclones that will intensify into PL from non-intensifying systems (c.f. Bracegirdle and Gray, 2008; Yanase et al., 2016), and reveals areas where PL can form (Kolstad, 2011; Mallet et al., 2013). This heating can be successfully estimated from the difference of temperature (sometimes potential temper-ature) between the sea surface (SST) and the overlying atmosphere at either 700 hPa as in Bracegirdle and Gray (2008) or 500 hPa as in Noer and Ovhed (2003),
Claud et al. (2007), and Zahn and von Storch (2008a); in this case written as SST-T500.
Because it modifies the spatial and temporal distribu-tions of the above variables, climate change is expected to impact PL occurrence. This kind of impact has already been highlighted for other extreme phenomena, such as heat waves, wind storms, etc. (e.g. Beniston
et al., 2007). An assessment of PL occurrence
differ-ences due to climate change could be useful coastal region development, offshore exploitation strategy, and polar maritime traffic. However, study of the long-term PL frequencies due to climate change is relatively recent, and only a few articles address this issue using different approaches. Kolstad and Bracegirdle (2008) studied the mean evolution of static stability extreme values in a model ensemble. Zahn and von Storch (2008a, 2008b, 2010) and Romero and Emanuel (2016) applied downscaling methods and a PL detection and tracking method to model ensembles, and concluded that the activity would be somewhat reduced; however, in Zahn and von Storch, 2010, the activity was shifted mainly northward, while in Romero and Emanuel, 2016, northeastward. Finally, Woollings et al. (2012) discussed the consequences of a change in the North Atlantic oceanic circulation.
A complementary approach is adopted in this study, which relies on the use of weather regimes (WRs, or regimes, e.g. Cassou et al., 2011). The concept of WRs is based on the representation of the seasonal atmospheric daily to monthly variability as transitions between a limited number of well-defined preferential quasi-stationary states. These states can be determined by statistical classification methods. The application of a cluster analysis to fields representative of the
350 P.-E. Mallet, C. Claud and M. Vicomte
daily wintertime (November to March) tropospheric circulation state (mean sea level pressure or geopo-tential height at 500 hPa, hereafter respectively MSLP and Z500) over the North Atlantic-Europe domain (20∘ –80∘N/90∘W–30∘E), provides four regimes, according to the literature: two regimes, whose pat-terns resemble the positive and negative phases of the North Atlantic Oscillation (NAO), subsequently NAO+ and NAO−, and two regimes corresponding to blocking in the tropospheric meridional flow cir-culation, Scandinavian Blocking (SB), and Atlantic Ridge (AR). Using several PL inventories, Mallet et al. (2013) showed that, depending on geographic location, PLs preferentially develop for specific WRs: over the Norwegian and Barents Seas, a PL formation is close to twice as common in NAO− and AR than in NAO+ and SB. Over the Labrador Sea, most PLs occur during NAO+, while they are almost entirely absent during NAO−. Moreover, WRs for which a maximum versus a minimum of PLs occur appear to correspond to favorable versus less favorable or adverse conditions on key variables for PL development. Also, when PLs form during an adverse regime, the anomalous synoptic circulation pattern weakly projects onto the WR mean pattern, i.e. the regime is then not ‘well’ defined. This occurs typically when stratospheric intrusions may explain a part of PL development quasi-independently from lower-level conditions, because PL development can be forced by inducing spin-up from a conditional neutral atmosphere (Montgomery and Farrell, 1992), or by enhancing existing surface vorticity (Rasmussen and Turner, 2003).
In the present paper, we study PL development through the evolution of WRs with climate change. To do so, we investigate the differences in the link between WRs and the most relevant key variable for PL development, the SST-T500 for present and future cli-mates. Indeed, because of their typically short life span (1 to 2 days) and small size (typically 100–600 km), the representation of PLs in meteorological reanal-ysis datasets remains limited. Using respectively a subjective and an objective identification criterion, both Laffineur et al. (2014) and Zappa et al. (2014) showed that only about 50–55% of observed PLs are represented in ERA-Interim (ERA-I) data, often with a weaker circulation than observed.
2. Data and rationale
Daily mean MSLP fields from the NCEP/NCAR reanal-ysis are used to investigate the contemporary climate. This reanalysis covers the period 1948 to today, on a global grid of 2.5∘ in latitude per 2.5∘ in longitude, and with 17 vertical pressure levels from 1000 to 10 hPa (Kalnay et al., 1996).
To investigate future climate change due to anthro-pogenic greenhouse gas concentration increases, we use the ECHAM5/MPI-OM (European Center Ham-burg Version 5/Max-Planck-Institute – Ocean Model)
general circulation model (Marsland et al., 2003; Roeckner et al., 2003). This model has the advantage of being an atmospheric-oceanic coupled model, and has a relatively high spatial resolution: T63 L31 for the atmospheric model, corresponding to a 1.875∘ horizon-tal resolution and 31 vertical levels; and GR1.5 L40 for the ocean/sea-ice model, i.e. 1.5∘ horizontal resolution and 40 vertical levels. The simulation of future cli-mate is for the most extreme greenhouse gas emission scenario, named A2, (Houghton et al., 2001), and the selected outputs MSLP, SST (or skin temperature over sea ice), T500 and sea-ice cover.
We consider two 30-year periods. The period 1970–99 is selected for the present-day climate and future climate considers the 2070–99 period. WRs are calculated for present-day climate winter months (November– March) on the NCEP/NCAR daily MSLP maps.
To obtain the closest representation of the WRs in the ECHAM5/MPI-OM simulation, the daily anomaly maps of simulated MSLP are directly compared with the centroids of the NCEP/NCAR regimes, as in Goubanova et al. (2010). Each day of the simulation is classified into the WR whose centroid has the highest similarity with the daily MSLP anomaly, according to a spatial correlation measurement. To increase the representation accuracy of WRs, transition days between regimes are not considered, and only those WRs with a persistence of at least 3 days are retained (as in Sanchez-Gomez and Terray, 2005).
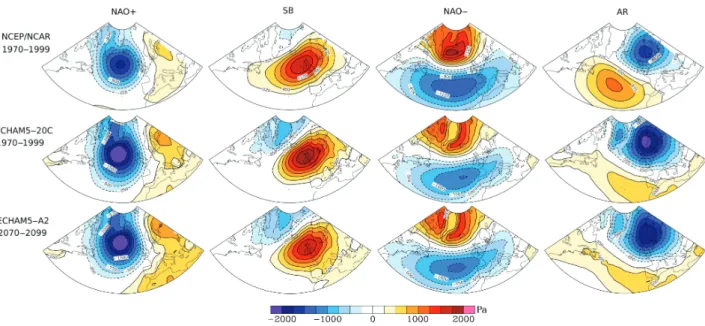
Figure 1 presents the four WR centroids for the present climate using reanalyses (top), from the contem-porary simulations (middle), and for the future climate simulations (bottom). Unsurprisingly, there is no large difference between WR centroid patterns determined from the reanalysis and the simulation. The main differ-ences are in the intensity of patterns, and the importance of the Greenland influence, which is particularly pro-nounced in ECHAM5/MPI-OM, probably due the dif-ferent representations of orography in the model versus the reanalysis.
3. Changes under warmer climate
In this section, we determine how the evolution of large-scale atmospheric variability, as represented by the WRs, impacts the convective tropospheric heating due to surface fluxes during wintertime.
Figure 2 shows the difference of SST-T500 in the simulations between future and present climate. The SST-T500 mean values decrease practically every-where of present-days’ PL occurrence area, making it on average less favorable for PL development. Nega-tive values are found over the central part of the North Atlantic Ocean, and maximum values to the south of Greenland and Iceland, and over the Labrador Sea, with differences around −2.5 to −3 K. The situation is dif-ferent over the Nordic Seas. The Norwegian Sea has a moderate decrease, near −1.5 K, while the Barents and © 2017 The Authors. Atmospheric Science Letters published by John Wiley & Sons Ltd Atmos. Sci. Let. 18: 349–355 (2017)
Figure 1. The four wintertime (NDJFM) MSLP weather regime (WR) centroids over the North Atlantic/Europe region for (top) NCEP/NCAR reanalysis over 1970–1999; (middle) ECHAM5 simulation, run 20C over 1970–1999, obtained by projection of MSLP daily anomalies onto NCEP/NCAR centroids; (bottom) and ECHAM5 simulation, scenario A2 for 2070–2099, obtained by projection of MSLP daily anomalies onto NCEP/NCAR centroids.
60°W 40°W 20°W 20°E 40°E 3 NDJFM 1.5 0 –1.5 –3 0 45°N 60°N degK
Figure 2. SST-T500 wintertime (NDJFM) difference between future and contemporary climates in ECHAM5. Considered areas are represented in red (Labrador Sea), green (Norwegian Sea), and yellow (Barents Sea).
Greenland seas show near zero or positive differences. Note that some areas – mainly the eastern and north-ern Barents Sea, and a part of the sea-ice edge along the eastern Greenland coast – marked by particularly strong increases of SST-T500 on Figure 2, correspond to ice-covered areas in the present-day winter season transitioned to ice-free in the future.
Statistical downscaling is a method used to estimate a local variable from its statistical relation to a large-scale field, i.e. from a global climate model (see Wilby et al., 2004 for more considerations). Over the Nordic and Labrador seas, the statistical relationship between WRs and PL occurrence, as well as SST-T500, have been rather well established (Mallet et al., 2013). It would therefore be possible to assess the change of PL occur-rence under warmer climate by determining WRs. Such climate change would manifest itself as differences in the occurrence of atmospheric circulation regimes
(e.g. Corti et al., 1999; Palmer, 1999). However, to be correct, the statistical downscaling assumes that the link between large-scale and local conditions is still valid under modified climate. Thus, the WRs/SST-T500 link is investigated. To assess which part of the total change in mean SST-T500 can be expressed as a difference in WR occurrence, and which one is due to a change in the link between local SST-T500 values and WRs, we use the linear decomposition proposed by Boé et al. (2006): ΔX = XF− XP=∑ (fkFxFk − fkPxPk)+(f0FYF− f0PYP)
where the total mean change ΔX of the local property, SST-T500, between the present climate (XP) and the
future climate (XF) is written according to the frequency
of occurrence fkP(fkF) for each k regime in the simulation of present (respectively, future) climate, the mean value of the property xP
k(x F
352 P.-E. Mallet, C. Claud and M. Vicomte
Table 1. Weather regime occurrence (%) in the present and future climate simulations of ECHAM5.
NAO+ SB NAO− AR
20C (1970–1999) 9 9 19 10
A2 (2070–2099) 10 10 19 10
Table 2. Influence of the different terms in the mean SST-T500 change between 1970–1999 and 2070–2099 periods for three North Atlantic regions.
Labrador Sea Barents Sea Norwegian Sea
Inter-type −0.063 −0.08 −0.063
Intra-type −2.203 −0.14 −1.318
Mixed term 0.008 0.006 0.005
Total −2.258 −0.214 −1.376
in present (respectively, future) climate, the frequency of occurrence of transition days between regimes fP
0
(f0F) in the simulation in present (respectively future) climate, and the mean value of the property YF(YP) for
transition days in the simulation in present (respectively future) climate.
ΔXcan be rewritten as the sum of three terms:
ΔX = { 4 ∑ k=1 [ fkP(xFk − xPk)]+[f0P(YF− YP] } + { 4 ∑ k=1 [ xkP(fkF− fkP)]+[YP(f0F− f0P] } + { 4 ∑ k=1 ( xFk − xkP) (fkF− fkP)+(YF− YP) (f0F− f0P) }
The first term, above, which corresponds to the total change due to changes within regimes, i.e. of the WRs/local variable relationships, is called ‘intra-type’; the second term corresponds to the total change due to WR occurrence changes or ‘inter-type’. The last, or mixing, term depends on both the occurrence differ-ences and internal changes.
We have found no significant difference of WR occur-rence frequencies in the future (Table 1). The linear decomposition of the SST-T500 mean change has been applied separately to the three areas where a statistical association between WRs and PL occurrence was con-firmed from the analysis of extensive PLs observations in Mallet et al. (2013): the Norwegian Sea, the Barents Sea, and the Labrador Sea (respectively in green, yel-low, and red on Figure 2). Table 2 shows that a strong signal is only found for the intra-type. Thus, we con-clude that the total change in SST-T500 is dominated by a change in the link between local climate conditions and large-scale variability, rather than a change in the occurrence frequency of WRs. To better understand this result, conditions specific to each WR are now studied. Figure 3 compares the SST-T500 winter mean val-ues for days belonging to each WR for the present
climate (left side) and for the future (right side). Over the Labrador Sea, the mean decrease of close to −2 K depends on the regime, but not in a statistically significant way. Notwithstanding, we note that the difference appears more important for NAO+ than for other WRs, up to near 4 K in the southern area. There, the WR approach is not determinant to consider the change in SST-T500 under warmer climate. Over the Norwegian and Barents Seas, the change is better distinguished according to WRs. There is practically no SST-T500 difference during SB, a weak one during NAO+, but a large decrease (1–2 K) during NAO− and AR. Figure 4 compares how much difference the WRs make to SST-T500 for the two periods. The WR-related SST-T500 departure from the mean decreases in future climate in almost all presented cases, which indicates that the large-scale variability has a reduced influence on local SST-T500. The same analysis repeated with standardized anomalies, i.e. by dividing deviation from the mean by local variability during the time slice in question, presents smaller differences between present and future climate anomalies (not shown). Thus, future climate reduced WR influence on SST-T500 seems due, at least in part, to a reduced variability, which is likely associated with sea-ice retreat (e.g. Borodina
et al., 2017).
The distribution of SST-T500 values for the Norwe-gian (right side) and Barents (left side) seas by WR days for the present and future climates is shown in Figure 5. We preferentially consider the highest values because PL development depends on strong thermodynamic fluxes from the sea to the atmosphere. For the Norwe-gian Sea, a decrease is observed for all WRs, but it is weak for SB (close to 0 K for the 95th centile, 0.4 for the 75th, and 0.7 for the mean), while it is notably strong for AR (around 1.5 K). For the Barents Sea, NAO+ shows a very weak decrease (close to 0.5 K for the 95th centile, near zero for the 75th and the mean), NAO− and AR show a mean decrease of 0.5 to 1 K, while an increase of between 0.3–0.5 K is observed for SB. Thus, it appears that the most favorable WRs for PL development in the contemporary period show the greater decrease in the highest SST-T500 values in the future.
4. Summary and conclusions
Because an association between PL occurrence and the large-scale variability of WRs has been statisti-cally established for the present climate over the Nordic and Labrador Seas, we investigate change in PL fre-quency occurrence under warmer climate through the evolution of WRs, and their links with the SST-T500 proxy. This one indicates convective heating by ther-modynamic surface fluxes, which is critical for most of PL developments. Evolution of the larger environmen-tal conditions is assessed using ECHAM5/MPI-OM atmospheric/ocean coupled model in a warmer climate scenario (2070–2099) relative to the present climate run (1970–1999). We found a SST-T500 decrease over the largest part of the North Atlantic area, and © 2017 The Authors. Atmospheric Science Letters published by John Wiley & Sons Ltd Atmos. Sci. Let. 18: 349–355 (2017)
60°W 40°W 20°W 20°E 40°E 45°N 60°N 0 60°W 40°W 20°W 20°E 40°E 45°N 60°N 0 60°W 40°W 20°W 20°E 40°E 45°N 60°N 0 60°W 40°W 20°W 20°E 40°E 45°N 60°N 0 60°W AR NAO– NAO+ 20C A2 SB 40°W 20°W 20°E 40°E 45°N 60°N 0 60°W 40°W 20°W 20°E 40°E 45°N 30 32 34 36 38 40 42 44 46 48 degK 60°N 0 60°W 40°W 20°W 20°E 40°E 45°N 60°N 0 60°W 40°W 20°W 20°E 40°E 45°N 60°N 0
Figure 3. Comparison between wintertime (NDJFM) simulated SST-T500 mean values according to associated WRs for present-day climate (1970–1999, left) and future climate (2070–2099, right).
354 P.-E. Mallet, C. Claud and M. Vicomte
Figure 4. Comparison between WR-related SST-T500 anomalies for present-day climate (1970–1999, blue) and future climate (2070–2099, red).
Figure 5. Comparison between wintertime (NDJFM) SST-T500 daily value distributions over the Norwegian (left) and Barents (right) seas according to associated WRs for the present-day climate (1970–1999, blue) and for future climate (2070–2099, red). The horizontal line within the box corresponds to the mean; bottom and top box bounds show the 25th and 75th percentiles, respectively; bottom and top whisker bounds indicate the 5th and 95th percentiles, respectively.
a more contrasted situation over the Nordic Seas, in good agreement with literature. The occurrence of WRs is not significantly modified. However, the sta-tistical link between WRs and local SST-T500 val-ues changes. The basic hypothesis of statistical down-scaling is thus not valid in this case. Moreover, WRs present a reduced influence on stability, which is due to reduced variability associated with sea-ice retreat (e.g. Borodina et al., 2017). WRs corresponding in contemporary climate to the highest SST-T500 val-ues present the greater decrease in future climate. This is the case for NAO− and AR over the Nordic Seas, and for NAO+ over the southern Labrador Sea. Con-versely, WRs corresponding in present-day climate to lowest SST-T500 values show a weaker decrease, and sometimes an increase. This is the case for NAO+, and
mostly for SB over the Nordic Seas, and to a smaller extent for AR over the Labrador Sea. We confirm pre-vious findings that episodes of high vertical instability occur less often. We conclude that the large-scale pat-terns of variability have a reduced influence on vertical stability, an indicator of the convective activity which is necessary for the development of most of PLs. In order to improve the robustness of our results and complete and refine our diagnostic, similar procedures should be applied to other models and on the other key conditions for PL development, as baroclinicity and upper level cold trough occurrence.
Acknowledgements
Support from the Chaire de Développement Durable of the Ecole Polytechnique and of the European Community 7th framework
© 2017 The Authors. Atmospheric Science Letters published by John Wiley & Sons Ltd Atmos. Sci. Let. 18: 349–355 (2017)
programme (FP7 2007–2013) under grant agreement n.308299 (NACLIM) is gratefully acknowledged. Authors thank C. Cassou for providing input on weather regimes and A. M. Carleton for helping to improve the manuscript.
References
Beniston M, Stephenson DB, Cristensen OB, Ferro CAT, Frei C, Goyette S, Halsnaes K, Holt T, Jylhä K, Koffi B, Palutikof J, Schöll R, Semmler T, Woth K. 2007. Future extreme events in European climate: an exploration of regional climate model projections. Climatic Change
81(1): 71–95.
Boé J, Terray L, Habets F, Martin E. 2006. A simple statistical-dynamical downscaling scheme based on weather types and conditional resampling. Journal of Geophysical Research 111, D23106. https://doi.org/10.1029/2005JD006889.
Borodina A, Fischer EM, Knutti R. 2017. Emergent constraints in cli-mate projections: a case study of changes in high-latitude tempera-ture variability. Journal of Climate 30: 3655–3670. https://doi.org/10 .1175/JCLI-D-16-0662.1.
Businger S. 1985. The synoptic climatology of polar low outbreaks.
Tellus 37A: 419–432.
Bracegirdle TJ, Gray SL. 2008. An objective climatology of the dynam-ical forcing of polar lows in the Nordic seas. International Journal of
Climatology 28: 1903–1919. https://doi.org/10.1002/joc1686.
Cassou C, Minvielle M, Terray L, Périgaud C. 2011. A statistical–dynamical scheme for reconstructing ocean forcing in the Atlantic. Part I: weather regimes as predictors for ocean surface variables. Climate Dynamics 36(1–2): 19–39.
Claud C, Duchiron B, Terray P. 2007. Associations between large-scale atmospheric circulation and polar low developments over the North Atlantic during winter. Journal of Geophysical Research 112, D12101. https://doi.org/10.1029/2006JD008251.
Corti S, Molteni F, Palmer TN. 1999. Signature of recent climate change in frequencies of natural atmospheric circulation regimes. Nature 398: 799–802.
Goubanova K, Li L, Yiou P, Codron F. 2010. Relation between large-scale circulation and European winter temperature: does it hold under warmer climate? Journal of Climate 23: 3752–3760. Houghton JT, Ding Y, Griggs DJ, Noguer M, van der Linden PJ, Dai
X, Maskell K, Johnson C. 2001. Climate Change 2001: The Scientific
Basis. Cambridge University Press: Cambridge.
Kalnay E et al. 1996. The NCEP/NCAR 40-year reanalysis project.
Bulletin of the American Meteorological Society 77: 437–471.
Kolstad EW. 2011. A global climatology of favourable conditions for polar lows. Quarterly Journal of the Royal Meteorological Society
137: 1749–1761. https://doi.org/10.1002/qj.888.
Kolstad E, Bracegirdle T. 2008. Marine cold-air outbreaks in the future: an assessment of IPCC AR4 model results for the northern hemi-sphere. Climate Dynamics 30: 871–885.
Laffineur T, Claud C, Chaboureau J-P, Noer G. 2014. Polar lows over the Nordic seas: improved representation in ERA-interim compared to ERA-40 and the impact on downscaled simulations. Monthly Weather
Review 142(6): 2271–2289.
Mallet P-E, Claud C, Cassou C, Noer G, Kodera K. 2013. Polar lows over the Nordic and Labrador seas: synoptic circulation patterns and associ-ations with North Atlantic-Europe wintertime weather regimes.
Jour-nal of Geophysical Research-Atmospheres 118, 2455–2472. https://
doi.org/10.1002/jgrd.50246.
Marsland SJ, Haak H, Jungclaus JH, Latif M, Röske F. 2003. The max-Planck-institute global ocean/sea ice model with orthogonal curvilinear coordinates. Ocean Modelling 5: 91–127.
Montgomery MT, Farrell BF. 1992. Polar low dynamics. Journal of the
Atmospheric Sciences 49: 2484–2505.
Noer G, Ovhed M. 2003. Forecasting of polar lows in the Norwegian and the Barents Sea. In Proceeding of the 9th meeting of the EGS Polar Lows Working Group: Cambridge.
Palmer TN. 1999. A nonlinear dynamical perspective on climate predic-tion. Journal of Climate 12: 575–591.
Rasmussen EA, Turner J. 2003. Polar Lows: Mesoscale Weather
Systems in the Polar Regions. Cambridge University Press:
New York.
Roeckner E and et al. 2003. The atmospheric general circulation model ECHAM5. Part I: model description Report/MPI für Meteorologie, 349.
Rojo M, Claud C, Mallet P-E, Noer G, Carleton AM, Vicomte M. 2015. Polar low tracks over the Nordic seas: a 14 winter climatological analysis. Tellus 67: 24660. https://doi.org/10.3402/tellusa.v67.24660. Romero R, Emanuel K. 2016. Climate change and hurricane-like extra-tropical cyclones: projections for North-Atlantic polar lows and med-icanes based on CMIP5 models. Journal of Climate 30, 279–299. https://doi.org/10.1175/JCLI-D-16-0255.1.
Sanchez-Gomez E, Terray L. 2005. Large-scale atmospheric dynamics and local intense precipitation episodes. Geophysical Research Letters
32, L24711. https://doi.org/10.1029/2005GL023990.
Wilby R, Charles S, Zorita E, Timbal B, Whetton P, Mearns L. 2004. Guidelines for use of climate scenarios developed from sta-tistical downscaling methods. Data Distribution Center of the IPCC Tech. Rep. 27pp. http://www.ipcc-data.org/guidelines/dgm_no2_v1_ 09_2004.pdf (accessed 04 January 2017).
Woollings T, Harvey B, Zahn M, Shaffrey L. 2012. On the role of the ocean in projected atmospheric stability changes in the Atlantic polar low region. Geophysical Research Letters 39, L24802.
Yanase W, Niino H, Watanabe S, Hodges K, Zahn M, Spengler T, Gurvich IA. 2016. Climatology of polar lows over the sea of Japan using JRA-55 reanalysis. Journal of Climate 29(2), 419–437. https:// doi.org/10.1175/JCLI-D-15-0291.1.
Zahn M, von Storch H. 2008a. A long-term climatology of North Atlantic polar lows. Geophysical Research Letters 35, L22702. https:// doi.org/10.1029/2008GL035769.
Zahn M, von Storch H. 2008b. Tracking polar lows in CLM.
Meteorol-ogische Zeitschrift 17: 445–453.
Zahn M, von Storch H. 2010. Decreased frequency of North Atlantic polar lows associated with future climate warming. Nature 467: 309–312.
Zappa G, Shaffrey L, Hodges K. 2014. Can polar lows be objec-tively identified and tracked in the ECMWF operational analy-sis and the ERA-interim reanalyanaly-sis? Monthly Weather Review 142: 2596–2608.