HAL Id: hal-00301759
https://hal.archives-ouvertes.fr/hal-00301759
Submitted on 9 Sep 2005HAL is a multi-disciplinary open access
archive for the deposit and dissemination of sci-entific research documents, whether they are pub-lished or not. The documents may come from teaching and research institutions in France or abroad, or from public or private research centers.
L’archive ouverte pluridisciplinaire HAL, est destinée au dépôt et à la diffusion de documents scientifiques de niveau recherche, publiés ou non, émanant des établissements d’enseignement et de recherche français ou étrangers, des laboratoires publics ou privés.
Hydrocarbon-like and oxygenated organic aerosols in
Pittsburgh: insights into sources and processes of
organic aerosols
Q. Zhang, D. R. Worsnop, M. R. Canagaratna, J.-L. Jimenez
To cite this version:
Q. Zhang, D. R. Worsnop, M. R. Canagaratna, J.-L. Jimenez. Hydrocarbon-like and oxygenated organic aerosols in Pittsburgh: insights into sources and processes of organic aerosols. Atmospheric Chemistry and Physics Discussions, European Geosciences Union, 2005, 5 (5), pp.8421-8471. �hal-00301759�
ACPD
5, 8421–8471, 2005 Hydrocarbon-like and oxygenated organic aerosols Q. Zhang et al. Title Page Abstract Introduction Conclusions References Tables Figures J I J I Back CloseFull Screen / Esc
Print Version
Interactive Discussion
EGU Atmos. Chem. Phys. Discuss., 5, 8421–8471, 2005
www.atmos-chem-phys.org/acpd/5/8421/ SRef-ID: 1680-7375/acpd/2005-5-8421 European Geosciences Union
Atmospheric Chemistry and Physics Discussions
Hydrocarbon-like and oxygenated organic
aerosols in Pittsburgh: insights into
sources and processes of organic
aerosols
Q. Zhang1, D. R. Worsnop3, M. R. Canagaratna3, and J.-L. Jimenez1,2
1
Cooperative Institute for Research in Environmental Sciences (CIRES), 216 UCB, University of Colorado-Boulder, Boulder, Colorado 80309-0216, USA
2
Department of Chemistry and Biochemistry, 216 UCB, University of Colorado-Boulder, Boulder, Colorado 80309-0216, USA
3
Aerodyne Research Inc., Billerica, Massachusetts 01821-3976, USA
Received: 8 August 2005 – Accepted: 17 August 2005 – Published: 9 September 2005 Correspondence to: J.-L. Jimenez (jose.jimenez@colorado.edu)
ACPD
5, 8421–8471, 2005 Hydrocarbon-like and oxygenated organic aerosols Q. Zhang et al. Title Page Abstract Introduction Conclusions References Tables Figures J I J I Back CloseFull Screen / Esc
Print Version
Interactive Discussion
EGU
Abstract
A recently developed algorithm (Zhang et al., 2005) has been applied to deconvolve the mass spectra of organic aerosols acquired with the Aerosol Mass Spectrometer (AMS) in Pittsburgh during September 2002. The results are used here to characterize the mass concentrations, size distributions, and mass spectra of hydrocarbon-like and
oxy-5
genated organic aerosol (HOA and OOA, respectively). HOA accounts for 34% of the measured organic aerosol mass and OOA accounts for 66%. The mass concentrations of HOA demonstrate a prominent diurnal profile that peaks in the morning during the rush hour and decreases with the rise of the boundary layer. The diurnal profile of OOA is relatively flat and resembles those of SO2−4 and NH+4. The size distribution of HOA
10
shows a distinct ultrafine mode that is commonly associated with fresh emissions while OOA is generally concentrated in the accumulation mode and appears to be mostly internally mixed with the inorganic ions, such as SO2−4 and NH+4. These observations suggest that HOA is likely primary aerosol from local, combustion-related emissions and that OOA is secondary organic aerosol (SOA) influenced by regional
contribu-15
tions. There is strong evidence of the direct correspondence of OOA to SOA during an intense new particle formation and growth event, when condensational growth of OOA was observed. The mass spectrum of OOA of this new particle formation event is very similar to the OOA spectrum of the entire study, which strongly suggests that most OOA during this study is SOA. O3 appears to be a poor indicator for SOA
con-20
centration while SO2−4 is a relatively good surrogate for this dataset. Since the diurnal averages of HOA tightly track those of CO during day time, oxidation/aging of HOA appears to be very small on the time scale of several hours. Based on extracted mass spectra and the likely elemental compositions of major m/z’s, the organic mass to or-ganic carbon ratios (OM:OC) of HOA and OOA are estimated at 1.2 and 2.2 µg/µg C,
25
respectively, leading to an average OM:OC ratio of 1.8 for submicron OA in Pittsburgh during September. The C:O ratio of OOA is estimated at 1:0.8. The carbon contents in HOA and OOA calculated accordingly correlate well to primary and secondary organic
ACPD
5, 8421–8471, 2005 Hydrocarbon-like and oxygenated organic aerosols Q. Zhang et al. Title Page Abstract Introduction Conclusions References Tables Figures J I J I Back CloseFull Screen / Esc
Print Version
Interactive Discussion
EGU carbon, respectively, estimated by the OC/EC tracer technique (assuming POC-to-EC
ratio=1). In addition, the total carbon concentrations calculated from the AMS data agree well with those measured by the Sunset Laboratory Carbon analyzer (r2=0.87; slope=1.01±0.11).
1. Introduction
5
Organic compounds are ubiquitous and abundant in ambient aerosols. They typically account for 20–50% of the fine particle mass (Jacobson et al., 2000; Kanakidou et al., 2005; NARSTO, 2003; Saxena and Hildemann, 1996; Seinfeld and Pankow, 2003) and are often internally mixed in the same particles with inorganic aerosols (Middlebrook et al., 1998, 2003; Murphy et al., 1998). Organic compounds play important roles in the
10
formation, growth, and removal of ambient aerosols (IPCC, 2001). They also signifi-cantly affect the hygroscopicity (Saxena et al., 1995), toxicity (Sheesley et al., 2005), direct radiative properties (Chung and Seinfeld, 2002; Haywood and Boucher, 2000), and indirect effects (Chung and Seinfeld, 2002; Facchini et al., 1999) of atmospheric aerosols and therefore have major implications for climate, visibility, and human health.
15
Elucidating the urban-to-global roles as well as the sources and fate of atmospheric aerosols inherently must rely on a thorough understanding of the chemical and micro-physical properties of particulate organics. However, it is extremely difficult to obtain a complete description of the molecular composition of aerosol organics because of the number, complexity, and extreme range of physical and chemical properties of these
20
compounds. Usually analysis of over a hundred different molecules can only account for 10–20% of the organic mass (NARSTO, 2003; Rogge et al., 1993). For these reasons in order to understand the chemistry of atmospheric organic aerosols, bulk characterization approaches such as those targeting compound classes and/or bulk properties (Fuzzi et al., 2001; Gelencser, 2004; Murphy, 2005) should be developed in
25
addition to compound-specific techniques.
ACPD
5, 8421–8471, 2005 Hydrocarbon-like and oxygenated organic aerosols Q. Zhang et al. Title Page Abstract Introduction Conclusions References Tables Figures J I J I Back CloseFull Screen / Esc
Print Version
Interactive Discussion
EGU (Allen et al., 1994; Blando et al., 1998, 2001; Edney et al., 2003; Laurent and Allen,
2004; Maria et al., 2002; Russell, 2003) and nuclear magnetic resonance (NMR) (Decesari et al., 2005, 2000; Fuzzi et al., 2001), have been applied to characterize the functional group composition of aerosol organics. A major advantage of these techniques is that they characterize ambient aerosols based on the majority of the
or-5
ganic mass, rather than a limited number of molecules (Allen et al., 1994; Blando et al., 1998; Decesari et al., 2000; Fuzzi et al., 2001; Maria et al., 2002). However, in analy-sis of ambient samples, both FTIR and NMR methods rely on assumptions about the relationship between the strength of the electromagnetic interaction and the amount of material that may introduce significant uncertainties in quantification of functional
10
groups (Blando et al., 2001; Fuzzi et al., 2001). In addition, until now neither method has been adapted for real-time sampling, nor are they capable to determine ambient organic aerosols with high time and size resolution.
Mass spectrometry techniques have been widely used in aerosol analysis because of their universal, extremely sensitive, and rapid detection of aerosol components (Jayne
15
et al., 2000; Jimenez, 2005; Johnston, 2000; McKeown et al., 1991; Murphy, 2005; Noble and Prather, 2000; Suess and Prather, 1999). Among these, the Aerodyne Aerosol Mass Spectrometer (AMS) (Jayne et al., 2000; Jimenez et al., 2003) is the most commonly used. It is capable of quantitatively measuring the size-resolved mass concentrations of organic aerosols with a time resolution of minutes (e.g., Allan et
20
al., 2003a; Drewnick et al., 2004a, b; Jimenez et al., 2003; Zhang et al., 2005b). Good correlations between the mass concentrations of organic aerosols measured by an AMS and the organic carbon concentrations measured by thermal-optical Carbon Analyzers have been observed in various locations, including Pittsburgh (Zhang et al., 2005b), Houston (Canagaratna et al., 2005)1, Tokyo (Takegawa et al., 2005), and off
25
the coast of New England (Bates et al., 2005; de Gouw et al., 2005).
The AMS employs thermal vaporization (usually at 600◦C) and 70 eV electron
ioniza-1
Canagaratna, M., Jimenez, J. L., Silva, P., et al.: Time resolved aerosol size and chemical composition measured during the Texas Air Quality Study, in preparation, 2005.
ACPD
5, 8421–8471, 2005 Hydrocarbon-like and oxygenated organic aerosols Q. Zhang et al. Title Page Abstract Introduction Conclusions References Tables Figures J I J I Back CloseFull Screen / Esc
Print Version
Interactive Discussion
EGU tion that generally causes extensive fragmentation of organic molecules (Alfarra, 2004;
Jayne et al., 2000; Jimenez et al., 2003). As a result, in ambient analysis each mass-to-charge ratio (m/z) peak in an AMS mass spectrum may contain contributions from many different molecules. For this reason the AMS does not characterize individual molecules in ambient air, but rather the methodology fits into the group of techniques
5
that characterizes bulk chemistry of organic aerosols.
A recently developed custom principal component analysis technique makes it pos-sible to use an AMS to identify and quantify broad aerosol “classes” that have different temporal and mass spectral signatures (Zhang et al., 2005a). When applied in ur-ban areas, this technique deconvolves and quantifies two types of organic aerosols,
10
hydrocarbon-like and oxygenated (HOA and OOA, respectively), which together ac-count for almost all the organic aerosol mass measured by the AMS (Zhang et al., 2005a). Hydrocarbon-like aerosols are named based on the similarity of their AMS mass spectra to those of hydrocarbons mixtures, while oxygenated organic aerosols are named based on their high oxygen content (Zhang et al., 2005a). More
impor-15
tantly, this technique allows the extraction of mass concentrations, size distributions, and mass spectra of HOA and OOA that are physically and chemically meaningful. As reported by Zhang et al. (2005a), the extracted mass spectrum of HOA is remarkably similar to the spectra of directly sampled vehicle exhaust and lab-generated lubricat-ing oil aerosols, while the spectrum of OOA closely resembles those of highly
pro-20
cessed organic aerosols sampled at rural and remote locations. The OOA spectrum also shows similarity with that of fulvic acid (Alfarra, 2004; Zhang et al., 2005a) – a humic-like substance that is ubiquitous in the environment and has previously been used as an analogue to represent polyacid components found in highly processed and oxidized atmospheric organic aerosols (Decesari et al., 2002).
25
In this paper we report the application of this technique to the AMS data acquired at the US EPA Pittsburgh Supersite and the major findings regarding the time trends, concentrations, and size distributions of HOA and OOA in Pittsburgh. The possible sources and processes of HOA and OOA are discussed based on comparison with
ACPD
5, 8421–8471, 2005 Hydrocarbon-like and oxygenated organic aerosols Q. Zhang et al. Title Page Abstract Introduction Conclusions References Tables Figures J I J I Back CloseFull Screen / Esc
Print Version
Interactive Discussion
EGU gas phase and organic carbon measurements. A detailed analysis on the evolution
of HOA and OOA during an intense new particle formation and growth event is also presented.
2. Experimental and data analysis methods
The AMS data used for this study were acquired during 7–22 September 2002 from
5
the main site of the Pittsburgh Air Quality Study (PAQS). Dates and times are reported in Eastern Standard Time (EST). The local time during this study was Eastern Daylight Saving Time (EDT), which is 1 h ahead of EST. An overview on the sampling location, instrumentation, and the objectives of PAQS is given elsewhere (Wittig et al., 2004). Gas-phase and meteorological variables were measured simultaneously (Wittig et al.,
10
2004). Note that the original CO data of this study period were offset by −0.35 ppm to adjust the average minimum CO concentration during periods of very clean air (e.g., air masses from the north) to ∼0.1 ppm, which is the background concentration of CO in Northern Hemisphere (Finlayson-Pitts and Pitts, 2000). PM2.5 2-h EC and OC were measured in situ using a Sunset Laboratory thermal optical transmittance carbon
15
analyzer (sampling details are given by Polidori et al., 20052).
Detailed information on the AMS operation and data analysis during this study is pre-sented by Zhang et al. (2005b, 2004). The mass concentrations and size distributions of fine particle species (e.g., SO2−4 , NO−3, NH+4, and organics) measured by the AMS during this study compare well with measurements made by collocated instruments,
20
with some systematic differences due to different size cuts (Zhang et al., 2005b). The absolute accuracy of the data reported here is mainly limited by the uncertainties in AMS particle collection efficiency (Zhang et al., 2005b).
2
Polidori, A., Turpin, B. J., Lim, H.-J., Cabada, J. C., Subramanian, R., Robinson, A. L., and Pandis, S. N.: Local and regional secondary organic aerosol: Insights from a year of semi-continuous carbon measurements at Pittsburgh, Aerosol Sci. Tech., in review, 2005.
ACPD
5, 8421–8471, 2005 Hydrocarbon-like and oxygenated organic aerosols Q. Zhang et al. Title Page Abstract Introduction Conclusions References Tables Figures J I J I Back CloseFull Screen / Esc
Print Version
Interactive Discussion
EGU The mass concentrations and mass spectra of HOA and OOA were derived using the
deconvolution procedures described in a separate publication (Zhang et al., 2005a). This technique involves a series of multivariate linear regressions that use mass-to-charge ratios (m/z’s) 57 (mostly C4H+9) and 44 (mostly CO+2), the identified AMS mass spectral tracers for HOA and OOA, respectively, as the initial principal components
5
followed by an iterative algorithm to determine HOA and OOA time series and mass spectra. The time resolution of the HOA and OOA time series are 5–10 min.
Because of the use of a quadrupole mass spectrometer only a subset of m/z’s (16 in total, out of which 8 are mainly organic m/z’s) were scanned for size distributions in this study (Jayne et al., 2000; Jimenez et al., 2003; Zhang et al., 2005b). We are thus
10
unable to derive the size distributions of HOA and OOA using the full mass spectra. Those presented in this study are derived based on the measured size distributions of
m/z’s 57 and 44 because these two m/z’s are the first order AMS tracers for OOA and
HOA, respectively, and correlate closely to the HOA and OOA time series (Zhang et al., 2005a). The size distribution of OOA was derived by normalizing the integrated signals
15
of m/z 44 in 20–1500 nm particles to the estimated concentrations of OOA. The poten-tial for interferences to m/z 44 to cause differences between the real size distribution of OOA and the distribution presented here is low because of the very high correlation of m/z 44 and OOA and the lack of m/z 44 signal in the HOA mass spectrum (Zhang et al., 2005a). However, considering that m/z 57 is present in the OOA mass spectrum
20
at intensity ∼2% of that of m/z 44, which indicates that m/z 57 may have contributions from oxygenated species (e.g., C3H5O+) in addition to hydrocarbons (i.e., C4H+9), we derived the size distribution of HOA by subtracting 2% of the m/z 44 signal from the size distribution of m/z 57 and then normalizing the integrated signals in 20–1500 nm particles to the estimated concentrations of HOA. The presence of oxygenated m/z 57
25
(C3H5O+) when the OOA to HOA ratio is high has been confirmed by recently acquired high m/z resolution AMS data.
Organic mass to organic carbon ratios (OM:OC) of HOA and OOA are estimated based on the extracted mass spectra of the two components (Zhang et al., 2005a) and
ACPD
5, 8421–8471, 2005 Hydrocarbon-like and oxygenated organic aerosols Q. Zhang et al. Title Page Abstract Introduction Conclusions References Tables Figures J I J I Back CloseFull Screen / Esc
Print Version
Interactive Discussion
EGU the likely elemental compositions of the major m/z’s in the corresponding spectrum.
All the data reduction and analysis are performed with Igor Pro 5 (Wavemetrics Inc.).
3. Results and discussion
3.1. Mass concentrations and temporal variations of HOA and OOA 3.1.1. Mass concentrations and diurnal variations of HOA and OOA
5
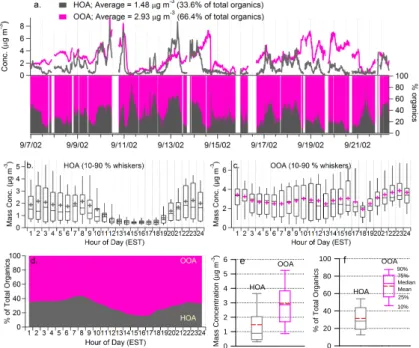
The time series of the mass concentration and the fractional contribution of hydrocarbon-like and oxygenated organic aerosols are shown in Fig. 1 (and see Zhang et al., 2005a). During this study in Pittsburgh the mass concentrations of atmospheric fine particles changed dramatically. Multiday episodes of fine particle pollution are in-terleaved with clean periods following heavy rainfall and/or the arrival of clean air from
10
the north. The time trends of HOA and OOA are very different, except for a few peri-ods when their concentrations appear to co-vary due to the arrival of clean air masses and/or rainfall scavenging. In general, the time series of HOA demonstrates a pro-nounced variation pattern that typically peaks during morning rush hours, when the mixing layer is relatively shallow and primary emissions from traffic are intense. OOA
15
demonstrates a time trend similar to that of sulfate (Fig. 2b), a dominant secondary aerosol species that is strongly influenced by regional accumulation rather than local emissions in Pittsburgh (Zhang et al., 2005b).
The significantly different diurnal patterns of HOA and OOA are evident in Figs. 1b and c. Note that these diurnal averages may be skewed by a few abnormally low/high
20
loading events due to the relatively short duration of this study (16 days). The dip at the 18th hour (between 05:00 to 06:00 p.m.) on the diurnal curve of OOA, for example, is mainly caused by the abrupt drop in the mass concentration associated with a rainfall event in the afternoon of 15 September. HOA demonstrates a clear diurnal pattern that peaks in the morning during the rush hour (08:00–09:00 a.m.), gradually decreases
ACPD
5, 8421–8471, 2005 Hydrocarbon-like and oxygenated organic aerosols Q. Zhang et al. Title Page Abstract Introduction Conclusions References Tables Figures J I J I Back CloseFull Screen / Esc
Print Version
Interactive Discussion
EGU after 08:00 a.m., and reaches its minimum between 03:00–05:00 p.m. In contrast, the
OOA diurnal profile is relatively flat and resembles those of SO2−4 and NH+4 (Zhang et al., 2005b). In addition, while the trend is relatively weak, the mean values of OOA show slight increases in the afternoon between 13:00 to 16:00 EST (Fig. 1c), when photochemistry is relatively intense. As a result, the highest fraction of OOA was
ob-5
served in the afternoon around 15:00–17:00 EST, during which OOA accounts for more than 80% of the total organic mass on average (Fig. 1d).
Table 1 and Figs. 1e and f summarize the statistics of the mass concentrations of HOA and OOA and their fractional contributions to the total organics. OOA dominates organic aerosol mass loading in Pittsburgh, accounting for more than half of the organic
10
mass for ∼85% of the time during this study (Fig. 1a). The average (±1σ) mass concen-tration of OOA is 2.93 (±1.65) µg m−3, roughly twice that of HOA (1.48±1.44 µg m−3; Figs. 1e and f). On average, HOA represents 34% of the organic aerosol mass in Pittsburgh while OOA accounts for 66%. Even during the morning rush hour, the mass loading of OOA is larger than that of HOA on average (Fig. 1d).
15
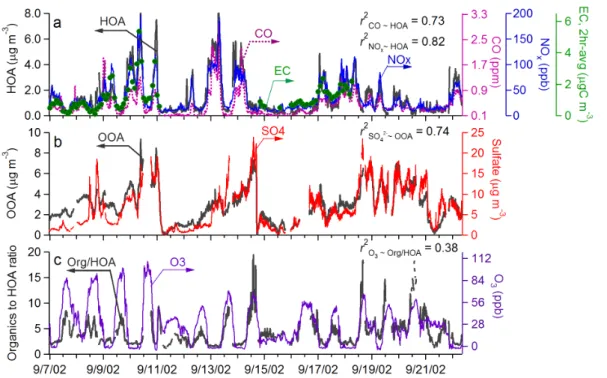
3.1.2. Correlation of HOA and OOA with combustion and secondary aerosol tracers Figure 2a shows the time series of HOA together with three primary combustion emis-sion tracers – CO, NOx, and elemental carbon (EC). Figure 2b shows the time se-ries of OOA and sulfate – a secondary aerosol species that is mainly formed through gas-phase and aqueous-phase oxidation of SO2. The corresponding linear regression
20
scatter plots are shown in Figs. 3a–d.
HOA correlates well with CO (r2=0.73), NOx (r2=0.82), and EC (r2=0.72), all of which demonstrate a pronounced diurnal pattern that peaks in the morning when traf-fic emissions are intense, declines with the rise of the mixed layer depth, and gradually increases after the boundary layer collapses in the evening. Such diurnal behavior
25
is characteristics for air pollutants from local emissions and thus indicates a strong association of HOA to combustion aerosol emitted locally (e.g., from traffic). This hypothesis is consistent with the size distribution of HOA, which constantly shows a
ACPD
5, 8421–8471, 2005 Hydrocarbon-like and oxygenated organic aerosols Q. Zhang et al. Title Page Abstract Introduction Conclusions References Tables Figures J I J I Back CloseFull Screen / Esc
Print Version
Interactive Discussion
EGU prominent ultrafine mode that is common for combustion aerosols (see Sect. 3.2). The
mass spectrum of HOA is also very similar to those of freshly emitted vehicle exhaust aerosols, showing ion series characteristic of hydrocarbons (see Sect. 3.3 and Zhang et al., 2005a).
The time trend of OOA tracks that of SO24(r2=0.74) but correlates very weakly to the
5
combustion tracers (r2<0.1). The good correlation between OOA and SO2−4 suggests similar sources and/or processes of these two aerosol components. SO2−4 is a major fine particulate species in Pittsburgh due to the high SO2 emissions in this geograph-ical region (Wittig et al., 2004; Zhang et al., 2005b). The atmospheric concentration of SO2−4 is strongly influenced by regional accumulation rather than local production
10
since a significant fraction of the fine particles in Pittsburgh are aged over regional scales (Anderson et al., 2004; Tang et al., 2004). For these reasons the rather weak response of the ambient concentrations of OOA and SO2−4 to the daily fluctuation of mixed layer depth is indicative for the regional nature of both components (i.e., sim-ilar levels of SO2−4 and OOA in the morning boundary layer and in air aloft). This is
15
in contrast to HOA, which originates predominantly from local emissions and as ex-pected demonstrates a pronounced diurnal pattern that peaks in the morning when traffic emissions are high and the mixed layer depth is low.
The lack of strong diurnal variations of SO2−4 and OOA might also be the result of their relatively high background concentrations in the region – daily photochemical
pro-20
duction of these two components, which is usually most intense in the afternoon, tends to be dwarfed by the much stronger variations in mass concentrations associated with changes of air mass or rainfall scavenging. Note that in areas where fine particles are more strongly influenced by local photochemistry, such as in Mexico City, photochemi-cal production of oxygenated organics is sufficiently pronounced that a clear increasing
25
trend of OOA is often observed during morning and early afternoon (Dzepina et al., 20053).
3
ACPD
5, 8421–8471, 2005 Hydrocarbon-like and oxygenated organic aerosols Q. Zhang et al. Title Page Abstract Introduction Conclusions References Tables Figures J I J I Back CloseFull Screen / Esc
Print Version
Interactive Discussion
EGU The hypothesis that most OOA in Pittsburgh is not due to local emissions, but rather
due to regional accumulation (likely secondary in origin) is consistent with the size distributions of OOA, which are dominated by the accumulation mode (see Sect. 3.2), and its mass spectrum, which closely resembles those of aged and highly oxidized organic aerosols (see Sect. 3.2 and Zhang et al., 2005a).
5
3.1.3. Correlation of OOA to O3
A previous study in Pittsburgh reported the use of ozone as an indicator for SOA for-mation supported by the observation that increases in the OC-to-EC ratio correlate with ozone increases (Cabada et al., 2004a). However, we found during this study that there is very little correlation between O3and OOA (r2≈0; Fig. 3e). The poor
correla-10
tion between OOA and O3suggests that ozone concentration is a rather poor indicator for SOA concentration, at least during this study.
A possible explanation for the positive correlation of SOA to O3observed by Cabada et al. (2004a) is that the POA/EC ratios used in their EC/OC tracer method were set too high (on average by a factor of ∼2) as they were determined by assuming that ambient
15
organic aerosol that likely contained ∼50% SOA was 100% POA (see Sect. 3.4). This would lead to an overestimation of POA and underestimation of SOA by their tracer method, that would greatly diminish as the boundary layer rises, due to the strong dilution of EC. Since the O3 diurnal profile is anti-correlated to that of EC (due to the strong effect of the boundary layer on both), this would result in an apparent correlation
20
between SOA and O3.
A related effect is illustrated in Fig. 2c where the organics-to-HOA ratio shows a pronounced daytime increase pattern that is similar to ozone (r2=0.38). The organics-to-HOA ratio is presented as a surrogate for the OC-to-EC ratio given the good correla-tion between HOA and EC (Fig. 2a) and between organic mass and OC concentracorrela-tions
25
(r2=0.88) (Zhang et al., 2005b). The observed daytime increase of organics-to-HOA City: The organic component, in preparation, 2005.
ACPD
5, 8421–8471, 2005 Hydrocarbon-like and oxygenated organic aerosols Q. Zhang et al. Title Page Abstract Introduction Conclusions References Tables Figures J I J I Back CloseFull Screen / Esc
Print Version
Interactive Discussion
EGU ratio (as well as OC-to-EC ratio) is mainly driven by the strong diurnal variations in HOA
(and EC) concentrations associated with daily fluctuation of the boundary layer height (Fig. 1b), rather than production of OOA.
Due to the good correlation between SO2−4 and OOA (r2=0.74; Figs. 2b and 3d) as well as the fact that both are in the particle phase and are thus likely exposed to
5
similar microphysical transformations and scavenging processes, SO2−4 concentration is a better indicator for SOA concentration, at least during this study.
3.1.4. Emission ratios of HOA and OOA-to-SO2−4 ratio
We examine here the emission ratios of HOA to primary pollutants for this study. In or-der to compare values on same units, we use a factor of 1.2 µg/µg C to convert primary
10
organic carbon (POC) and a factor of 2.2 µg/µg C to convert secondary organic carbon (SOC) based on the organic mass to organic carbon ratios (OM:OC) of HOA and OOA calculated from their corresponding mass spectra (see Sect. 3.3). The average ratio of HOA to EC is ∼1.41±0.22 µg/µg C during this study. It is similar to the average POA to EC ratio in the Northeast US (=1.4 µg/µg C) (Yu et al., 2004), as well as the
15
value estimated from emission inventory during Pittsburgh summer time (=1.2 µg/µg C (calculated from Cabada et al., 2002).
The emission ratio of HOA to CO for this study, calculated after subtracting the North-ern Hemisphere background of CO (0.1 ppm) from the measured CO concentrations, is ∼4.3 ng m−3/ppbv. (The linear regression slope of HOA vs. CO with the intercept
20
forced through zero is ∼3.7 ng m−3/ppbv). These values are lower than the POA to CO emission ratio in New England (9.4 ng m−3/ppbv) determined based on correlated behavior of total OA with gas-phase tracers (de Gouw et al., 2005) and the POA to CO ratio estimated from the AMS data in Tokyo, Japan (11 ng m−3/ppbv) (Takegawa et al., 2005a2). All of these numbers are larger than the average POA to CO emission
25
ratios measured during a tunnel study in California – ∼1.8 ng m−3/ppbv for diesel trucks and ∼0.8 ng m−3/ppbv for light-duty vehicles (calculated from Kirchstetter et al., 1999). In addition, the emission factor of HOA to NOx of this study (i.e., 42 ng m−3/ppbv) is
ACPD
5, 8421–8471, 2005 Hydrocarbon-like and oxygenated organic aerosols Q. Zhang et al. Title Page Abstract Introduction Conclusions References Tables Figures J I J I Back CloseFull Screen / Esc
Print Version
Interactive Discussion
EGU roughly 3 times the POA to NOxratios of diesel trucks and light-duty vehicles (average
≈16 and 11 ng m−3/ppbv, respectively) from the California tunnel study (calculated from Kirchstetter et al., 1999).
Since sulfate is a better indicator for SOA concentration (see above), we calculate the average mass concentration ratio of OOA to sulfate – 0.38 (dimensionless) during this
5
study (Fig. 3d). The significance of this number is that it provides a first order estimation of the mass concentrations of OOA or SOA based on measured sulfate concentrations in fine particles in the Pittsburgh region during Fall. A survey of the OOA to SO2−4 ratios based on AMS data at many locations in the Northern Hemisphere will be provided in a separate paper.
10
3.2. Size distributions of HOA and OOA
3.2.1. Change of size distributions of HOA and OOA as function of time
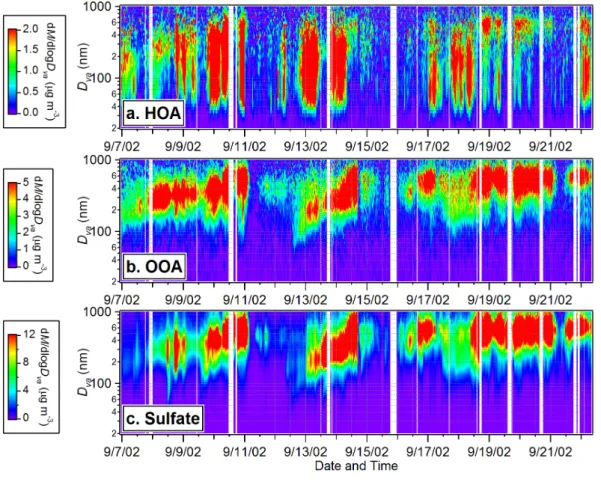
The image plots in Figs. 4a and b provide an overview of the temporal variations of the HOA and OOA size distributions during this study, showing again very different behav-iors for HOA and OOA. OOA mostly resides in the accumulation mode with vacuum
15
aerodynamic diameters (Dv a(DeCarlo et al., 2004) larger than 200 nm while HOA dis-plays a much broader distribution that extends into the ultrafine mode (Dv a<100 nm)).
Typically ∼30% of the HOA mass is associated with ultrafine particles compared to less than 5% of the OOA mass.
The size distribution of OOA tracks the behavior of sulfate (and ammonium)
through-20
out the entire study (Figs. 4b and c) (also see Zhang et al., 2005b and Suppl. Info), echoing the fact that their mass concentrations are highly correlated (Fig. 2; see Sect. 3.1). Simultaneous growth of OOA and SO2−4 size distributions is observed during some periods, e.g., from the afternoon of 12 September to 14 September – a period that follows an intense new particle formation event (see Sect. 3.5 for detailed
discus-25
sion). These observations suggest that oxygenated organics are likely internally mixed with NH+4 and SO2−4 and that both OOA and SO2−4 are formed over similar regional
ACPD
5, 8421–8471, 2005 Hydrocarbon-like and oxygenated organic aerosols Q. Zhang et al. Title Page Abstract Introduction Conclusions References Tables Figures J I J I Back CloseFull Screen / Esc
Print Version
Interactive Discussion
EGU scales. The HOA size distribution pattern is distinctly different from those of OOA and
SO2−4 . It is generally much broader, showing a pronounced ultrafine mode that in-creases at night and in the morning. On average, only ∼50% of the total HOA mass is associated with the accumulation mode.
Figure 5a summarizes the average size distributions of HOA, OOA, and inorganic
5
aerosols species of the entire study that again demonstrate the overall resemblance of OOA to secondary aerosol species (NH+4, SO2−4 , and NO−3). Compared to the size distributions of SO2−4 and NH+4, those of OOA and NO−3 are slightly broader, extend-ing more into the smaller sizes (<300 nm). In the case of nitrate, this likely reflects active gas-particle partitioning due to its semivolatile character and the strong
influ-10
ences of ambient temperature and relative humidity on the partitioning (Seinfeld and Pandis, 1998). Similarly, the broader OOA distribution suggests a stronger influence of local gas-to-particle partitioning on OOA than on NH+4 and SO2−4 formation. This is consistent with the known semivolatile character of some SOA compounds (Sheehan and Bowman, 2001), compared to the non-volatile character of sulfates. Figure 5b
15
shows the fractional contributions of HOA and OOA to total organic mass as a function of aerosol size, from which we estimate that ∼75% of the accumulation mode organic mass is OOA. In contrast, ∼75% of the organic mass in ultrafine aerosols is HOA. 3.2.2. Diurnal variations of the size distributions
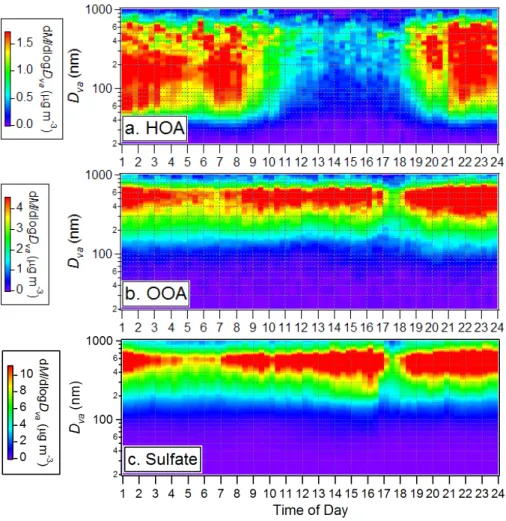
The average diurnal image plots of the HOA, OOA, and sulfate size distributions are
20
shown in Fig. 6. As pointed out in Sect. 3.1, the dip at 17:00∼18:00 EST on the diurnal plots of OOA and sulfate is primarily due to a rainfall event in the afternoon of 15 September. These figures are analogous to Fig. 4, showing that HOA has distinctly different behavior than OOA and SO2−4 and that the highest OOA-to-organics fraction (and the accompanying shift of particles toward larger sizes) preferentially occurs in
25
the afternoon. Figure 7 provides a survey of the average size distributions of HOA and OOA and their relative contributions to the total organic mass during different hours of
ACPD
5, 8421–8471, 2005 Hydrocarbon-like and oxygenated organic aerosols Q. Zhang et al. Title Page Abstract Introduction Conclusions References Tables Figures J I J I Back CloseFull Screen / Esc
Print Version
Interactive Discussion
EGU the day in correspondence to Fig. 6. Even in early afternoon, when the HOA mass
loading is the lowest and its size distribution the narrowest, the ultrafine mode particles are primarily HOA.
3.2.3. Size distributions of HOA and OOA for periods with different HOA & OOA frac-tions
5
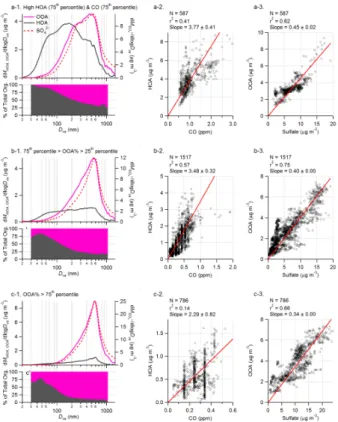
We display in Fig. 8 the average size distributions of HOA and OOA and the correlations of HOA to CO and OOA to SO2−4 during: 1) high HOA and CO periods (i.e., both HOA and CO are in the upper 75th percentile of their absolute concentrations) that represent the situation of intense primary combustion emissions and high loading of fresh organic aerosols; 2) “typical” situation when the fractional contributions of OOA to
10
the total organics (OOA%) are within the 25th – 75th percentile of their absolute values (corresponding to periods when OOA contributes 58%–81% of the total organic mass); and 3) aged aerosol periods when OOA% are in the top 25th percentile of their absolute values (corresponding to periods when OOA contributes more that 81% of the total organic aerosol mass). In general, there is a clear shift of all species (including, SO2−4 ,
15
OOA, and most dramatically HOA) to larger mode size with higher OOA fraction (e.g., Fig. 8a-1 vs. Fig. 8c-1). The size distribution of HOA demonstrates an increasingly prominent accumulation mode with higher OOA fraction. Note that although part of the narrowing of OOA distribution observed could be due to limited transmission of the AMS lens at high particle sizes (Jayne et al., 2000; and see discussions in Zhang et al.,
20
2005b), such effect is expected to be fairly small during this study since the majority of Pittsburgh organic mass is in submicron aerosols (Cabada et al., 2004b).
In addition, there are several trends observed: (1) the size distributions of OOA and SO2−4 are very similar under all situations; (2) HOA always dominates the composition of small particles (Dv a<100 nm), even during very high OOA periods (Fig. 8c-1); (3)
25
the linear regression slope of HOA vs. CO is somewhat lower with higher OOA frac-tion (Figs. 8b-1–8b-3); and (4) the correlafrac-tion of OOA to SO2−4 is always good but the
ACPD
5, 8421–8471, 2005 Hydrocarbon-like and oxygenated organic aerosols Q. Zhang et al. Title Page Abstract Introduction Conclusions References Tables Figures J I J I Back CloseFull Screen / Esc
Print Version
Interactive Discussion
EGU OOA/SO2−4 ratio decreases slightly with high OOA fraction (Figs. 8c-1–8c-3). In
addi-tion, while not shown here, the correlation of OOA with O3does not improve (i.e., r2≈0) at high OOA.
3.3. Mass spectra and estimated elemental compositions of HOA and OOA
Together with the mass concentrations of HOA and OOA, complete mass spectra of
5
these two components were extracted using the deconvolution technique described in Zhang et al. (2005a). Because of the clear separation of the HOA signals from the OOA in measured mass spectra, we are able to estimate the possible elemental composi-tions of each m/z in the HOA and OOA spectra and thus the elemental composition of the organic aerosol. Table 2 lists the estimated molecular compositions of the 14 and
10
16 most abundant m/z’s, accounting for 75% and 67% of the OOA and HOA signals, respectively. The assumed compositions of the major peaks in the spectra were ver-ified by examining preliminary data on the organic mass spectra of ambient aerosols acquired by a high-resolution ToF-AMS (DeCarlo et al., 20054). For m/z’s not listed in the table, we assume that those of HOA have the same average C:H ratio as the
aver-15
age of 16 HOA m/z’s listed in Table 2 (i.e., average molecular composition is (CH2)n) and those of OOA have an average C:H:O ratio same as the average of the major OOA
m/z’s in Table 2 excluding 17, 18, 28 and 44 (i.e., average molecular composition is
(C2H3O)n).
These elemental compositions are first order estimations since we only included C,
20
H, and O atoms. The omission of nitrogen atom may influence the OM:OC estimates since nitrogen-containing organic compounds have been detected in ambient aerosols (Li and Yu, 2004; Zhang and Anastasio, 2003; Zhang et al., 2002a, b). However, the influence is expected to be relatively small because C, H, and O are the three dominant atoms reported in aerosol organic species (Seinfeld and Pandis, 1998). Recent
stud-25
4
DeCarlo, P., Aiken, A., Jimenez, J. L., et al.: A high-resolution aerosol mass spectrometer, in preparation, 2005.
ACPD
5, 8421–8471, 2005 Hydrocarbon-like and oxygenated organic aerosols Q. Zhang et al. Title Page Abstract Introduction Conclusions References Tables Figures J I J I Back CloseFull Screen / Esc
Print Version
Interactive Discussion
EGU ies reported that N atoms typically account for 10% or less of the total organic mass in
atmospheric fine particles and fog waters (e.g., Zhang and Anastasio, 2001; Zhang et al., 2002a). In addition, by using mass spectra to derive the elemental composition of molecules (Table 2) we assume that the elemental composition of the ions is on aver-age the same as the elemental composition of the parent molecules. This assumption
5
could introduce some bias on the estimated elemental composition if certain functional groups or molecular structures have a greater tendency to end up as either ions or neutrals in the fragmentation process.
Figure 9 shows mass spectra of HOA and OOA colored with the contribution of C, H, and O at each m/z. See Zhang et al. (2005a) for detailed discussion on these
10
two mass spectra; only the major points are summarized here: 1) the HOA spectrum demonstrates prominent ion series characteristic of hydrocarbons and shows remark-able similarity to the measured AMS mass spectra of diesel exhaust aerosols and lab-generated lubricating oil and diesel fuel aerosols; 2) the OOA spectrum is domi-nated by m/z 44 (CO+2) and m/z 28 (CO+) and demonstrates close similarity in the
15
overall pattern with those of aged/oxidized organic aerosols in rural and urban areas; and 3) the OOA spectrum is also qualitatively similar to the AMS mass spectrum of Suwannee River fulvic acid (Alfarra, 2004), which is a class of highly oxygenated or-ganic compounds that have been proposed as models of the highly oxidized oror-ganic aerosols that are ubiquitous in the atmosphere (Decesari et al., 2002). In addition,
20
neither HOA nor OOA mass spectrum represents individual species, but rather, they represent mixtures of many individual organic species associated with the same group of sources and atmospheric processes (i.e., urban emissions vs. regional secondary aerosol).
Based on estimated elemental compositions of m/z’s, we calculate that the average
25
molar ratio of C:H:O in OOA is 1:1.6:0.8 and that the average molar ratio of C:H in HOA is 1:1.9. The organic mass to organic carbon ratios (OM:OC) of HOA and OOA are es-timated at 1.2 and 2.2 µg/µg C, respectively. This HOA OM:OC ratio is consistent with the value (1.2 µg/µg C) of hydrocarbons (Turpin and Lim, 2001) – the major
compo-ACPD
5, 8421–8471, 2005 Hydrocarbon-like and oxygenated organic aerosols Q. Zhang et al. Title Page Abstract Introduction Conclusions References Tables Figures J I J I Back CloseFull Screen / Esc
Print Version
Interactive Discussion
EGU nents of urban fresh combustion aerosols. In addition, the OOA OM:OC ratio is close
to the value estimated for nonurban aerosols (2.1±0.2 µg/µg C) (Turpin and Lim, 2001) but is significantly higher than estimates based on functional group measurements by FTIR spectroscopy (Russell, 2003).
The average OM:OC ratio of submicron organic aerosols (OOA plus HOA)
calcu-5
lated with this procedure is ∼1.8, a value that is close to the number determined by comparing organic mass concentration from the AMS and organic carbon concentra-tion from a Sunset labs carbon analyzer (Zhang et al., 2005b). It is also comparable to the number (1.6±0.2) proposed by Turpin and Lim (2001) for urban aerosols. This analysis is summarized in Fig. 10, where the organic carbon contents derived from the
10
HOA and OOA mass spectral analysis show good agreement with the organic carbon (OC) concentrations from the carbon analyzer (r2=0.87 and the linear regression slope =1.01±0.11).
3.4. Comparison with estimates from the EC/OC tracer method
The elemental carbon (EC) / organic carbon (OC) tracer method has been frequently
15
used to estimate the carbon concentrations of primary and secondary organic aerosol (POC and SOC, respectively) (Cabada et al., 2002, 2004a; Castro et al., 1999; Park et al., 2005; Polidori et al., 20052; Turpin and Huntzicker, 1991, 1995). This method derives the POC concentration based on the EC measurements assuming a constant POC to EC ratio (Turpin and Huntzicker, 1991; Turpin and Huntzicker, 1995). SOC
20
is subsequently calculated as the difference between measured total OC and the es-timated POC based on the assumption that SOA is formed through gas to particle conversion that involves no EC emissions. Note that the POC and SOC concentrations thus estimated may contain significant uncertainties due to 1) the operational definition for the OC and EC fractions in thermal-optical analysis (Gelencser, 2004; Turpin et al.,
25
2000); 2) the uncertainties associated with the estimated POC/EC ratios for the aver-age of the combustion emission sources (Turpin and Lim, 2001); and 3) variations in time of the average POC/EC ratios due to factors such as varying fractions of diesel
ACPD
5, 8421–8471, 2005 Hydrocarbon-like and oxygenated organic aerosols Q. Zhang et al. Title Page Abstract Introduction Conclusions References Tables Figures J I J I Back CloseFull Screen / Esc
Print Version
Interactive Discussion
EGU and gasoline vehicles on the road (Harley et al., 2005). Despite these limitations, the
EC/OC method has been applied frequently because of the lack of direct measurement techniques that can distinguish POA from SOA (Kanakidou et al., 2005).
The POC and SOC concentrations during this study are calculated using the PM2.5 EC and OC data from thermal-optical transmittance carbon analysis (Polidori et al.,
5
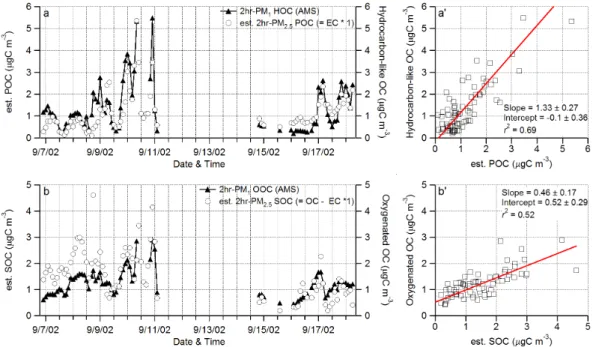
20052): POC=1×EC and SOC=OC–POC. The POC/EC ratio of 1 was estimated based on summertime emission inventories in Pittsburgh (Cabada et al., 2002). Fig-ure 11 compares the POC and SOC estimates to the concentrations of hydrocarbon-like and oxygenated organic carbon (HOC and OOC, respectively) calculated accord-ing to their estimated molecular compositions (see Sect. 3.3). Overall, HOC correlates
10
well to POC (r2=0.69, Figs. 11a and a’) and OOC also shows some correlation to SOC (r2=0.52; Figs. 11b and b’). These correlations are consistent with the diurnal variation patterns, mass spectra, and size distributions of HOA and OOA, which all corroborate the hypothesis that most or all HOA is POA and that most or all OOA is SOA during this study.
15
The linear regression fit to HOC vs. POC has a slope of 1.33±0.27 µg C/µg C) and an intercept of −0.10±0.36 µg C m−3(Fig. 11a). In contrast, the fit to OOC vs. SOC yields slope=0.46±0.17 µg C/µg C with intercept of 0.52±0.29 µg C m−3. The slopes of HOC vs. POC and OOC vs. SOC obtained with the intercept fixed at zero are 1.23±0.22 and 0.74±0.35, respectively. Note that perfect agreement between these two estimates
20
of POC and SOC is not expected because they were calculated by completely di ffer-ent methods under different assumptions. In addition, uncertainties associated with both measurements and data analysis procedures may also contribute to the observed discrepancy. For instance, there appear to be some changes in the correlation pat-terns after 11 to 14 September – a gap of missing POC and SOC data due to a major
25
component failure of the EC/OC analyzer (J. Cabada, Tecnol ´ogico de Monterrey, pers. comm.).
As pointed out at the beginning of this section, the soundness of the OC/EC method for predicting POC and SOC is strongly influenced by the choice of the POC to EC
ACPD
5, 8421–8471, 2005 Hydrocarbon-like and oxygenated organic aerosols Q. Zhang et al. Title Page Abstract Introduction Conclusions References Tables Figures J I J I Back CloseFull Screen / Esc
Print Version
Interactive Discussion
EGU ratio and the validity of the assumption that this ratio is relatively constant during the
time period of interest. To illustrate this first point, we compare in Fig. 12 the fractional distribution of POA and SOA obtained from the AMS data to those obtained from the EC/OC tracer method using different POC to EC ratios: 1) POC/EC=1.2, which is the average HOC to EC ratio calculated from this study; 2) POC/EC=1, which is estimated
5
based on emission inventory for Pittsburgh in the summer (Cabada et al., 2002); and 3) POC/EC=2, which is approximate the average of a range of ratios calculated based on measured OC/EC ratios during periods dominated by primary emissions and with low O3(Cabada et al., 2004a). (POA and SOA are converted from POC and SOC as-suming OM:OC ratios of 1.2 µg m−3/µg C m−3 and 2.2 µg m−3/µg C m−3, respectively;
10
see Sect. 3.3).
As shown in Figs. 2a and 12b, the fractional distribution of POA/SOA calculated from EC/OC measurements agrees very well to that determined from the AMS data when POC/EC=1.2 is used. In comparison, assuming POC/EC=1 yields higher fraction of SOC (Fig. 12c) while assuming POC/EC=2 projected from ambient measurements
15
leads to roughly 50% less SOC and twice more POC (Fig. 12d). Note that POC/EC=2 may be a significant overestimation since fine particles in Pittsburgh are strongly influ-enced by regional sources and thus contain a relatively high background of oxidized organic species (Anderson et al., 2004; Tang et al., 2004; Zhang et al., 2005b). Even during periods with intense primary emissions and reduced mixing (e.g., morning rush
20
hour) OOA contributes more than 50% of the total organic mass on average (Fig. 1). In addition, a low concentration of O3 does not necessarily imply that SOA is also low because O3 is a much shorter-lived photochemical product than SOA. O3 can be titrated away quickly by NO emitted by traffic, while SOA will persist. Figure 3d, for example, shows that the r2 between OOA and O3 is almost zero during this study
25
(see Sect. 3.1.2). In fact, based on the OOA/HOA ratios observed during the morning rush hour (∼1.3:1), we estimate that the POC/EC assumptions projected from ambient measurements in Pittsburgh may be biased high by up to a factor of 2, suggesting that POC/EC∼1 is a better estimate. In addition, these comparisons, together with the good
ACPD
5, 8421–8471, 2005 Hydrocarbon-like and oxygenated organic aerosols Q. Zhang et al. Title Page Abstract Introduction Conclusions References Tables Figures J I J I Back CloseFull Screen / Esc
Print Version
Interactive Discussion
EGU correlation between HOA and EC, also indicate that the EC/OC tracer method is
capa-ble of achieving the correct estimation of POC and SOC as long as the right POC/EC ratio is given. Otherwise, the POC and SOC estimates can have considerable errors if this ratio is not well constrained (as is often the case in practice).
3.5. Sources and processes of HOA and OOA
5
As discussed above, the diurnal variations, size distributions and mass spectra of HOA and OOA and their correlations with combustion and secondary aerosol tracers all suggest that HOA are mainly primary organic aerosols from combustion processes while OOA are mostly produced from secondary processes. In this section, we will examine the evolution of HOA and OOA and gain further insights into the possible
10
sources and processes of these two aerosol types. 3.5.1. HOA aging and processing
Recent studies have suggested that primary organic aerosols may undergo substan-tial photochemical oxidation and might contribute significantly to the oxygenated OA pool in urban particles (Robinson et al., 20055). To evaluate this point, in Fig. 13 we
15
compare the diurnal profiles of HOA and CO under the consideration that CO is a comparatively long-lived tracer of combustion emissions (cf. 1 month lifetime in the tro-posphere (Finlayson-Pitts and Pitts, 2000). On this plot, the y axes of HOA and CO are scaled from zero and 100 ppb (the background level of CO in Northern Hemisphere), respectively, to their morning maxima. The rationale behind this figure is that significant
20
HOA oxidation would appear as a lowering of the HOA/CO ratio during photochemically active periods (e.g., between 13:00–15:00 EST), assuming relatively constant HOA to CO emission ratios throughout the day.
5
Robinson, A. L., Donahue, N. M., and Rogge, W. F.: Photochemical oxidation and changes in molecular composition of organic aerosol in the regional context, J. Geophys. Res., in review, 2005.
ACPD
5, 8421–8471, 2005 Hydrocarbon-like and oxygenated organic aerosols Q. Zhang et al. Title Page Abstract Introduction Conclusions References Tables Figures J I J I Back CloseFull Screen / Esc
Print Version
Interactive Discussion
EGU The synchronous decrease in the concentrations of CO and HOA around 07:00–
08:00 a.m. is primarily the result of atmospheric dilution due to increasing mixed layer height. Overall the diurnal curve of HOA tracks that of CO during the day, suggesting that there is little oxidation of HOA on a time scale of several hours. These observa-tions are consistent with previous field studies which did not observe any appreciable
5
aging of particle-phase alkanes over similar time-scales (Schauer et al., 1996) and with recent laboratory studies which suggest that the time scale for such oxidation is on the order of one week (Molina et al., 2004). Note that small variations in the HOA/CO ratio may reflect differences in diurnal activity cycles of different sources which emit these species in different ratios, such as diesel and gasoline vehicles (Harley et al., 2005).
10
3.5.2. Evolution of OOA during new particle growth
We examine in this section the evolution of OOA in mass concentration and size dis-tributions on 12 September 2002 (Fig. 14) – a day in which an intense new particle formation event started at 08:10 in the morning (see extensive discussion of chemistry and microphysics of new particle growth (Zhang et al., 2004). As shown in Fig. 14a,
15
the time series of HOA and CO track each other, staying flat from 10:00 a.m. to roughly 05:00 p.m., while the OOA concentration increased after ∼10:00 a.m., increasing to-gether with O3. The OOA continued to increase until 08:00 p.m. while O3declined after ∼05:00 p.m., likely as O3 production decreased and was titrated by NO emitted from
traffic, accentuated by reduced vertical mixing in the late afternoon and evening.
20
Figures 14b–e display the image plots that illustrate the evolution of four aerosol pa-rameters: condensational sink (CS, in units of cm−2) and the mass concentrations of SO2−4 , OOA, and HOA during 12 September 2002. CS is a measure of the available surface area for condensation (Pirjola et al., 1999). It was calculated from the number distribution in the mobility diameter range of 3–680 nm as measured by SMPS
assum-25
ing an average molecular weight for the condensing species of 100 g/mol. The image plots of HOA and OOA are relatively noisy because both are calculated from only one
ACPD
5, 8421–8471, 2005 Hydrocarbon-like and oxygenated organic aerosols Q. Zhang et al. Title Page Abstract Introduction Conclusions References Tables Figures J I J I Back CloseFull Screen / Esc
Print Version
Interactive Discussion
EGU the average size distributions of the corresponding parameters during four
consecu-tive periods (I–IV) of this event (Figs. 14b’–e’). Period I (08:10–09:30) corresponds to the initial stage of new particle formation when the nucleation mode particle number increased greatly; Periods II (09:30–11:30) and III (11:30–14:30) represent the growth period when the number of nucleation mode particle number declined while the Aitken
5
mode number increased; and Period IV (14:30–17:05) corresponds to a later period in the event when both the nucleation mode and the Aitken mode numbers were decreas-ing (Zhang et al., 2004). Note that the AMS can only detect particles that have grown into the Aitken mode (>33 nm Dv a) (Zhang et al., 2004).
The evolution patterns of the size distributions of HOA and OOA are substantially
10
different, with ultrafine HOA (<100 nm) decreasing sharply after 09:30 a.m. and ul-trafine OOA increasing throughout the day. This OOA behavior is similar to that of sulfate, except that sulfate also exhibits an intermediate mode (Dv a=∼100–250 nm) at the beginning of the event – during Periods I & II (Figs. 14c–d and 14c’–d’). As dis-cussed in Zhang et al. (2004) the intermediate mode particles that suddenly appeared
15
at around 08:00 a.m. on 12 September were composed of ammonium sulfate and likely were mixed down from the air mass aloft when the mixed layer grew in the morning. We speculate that these particles were the product of nucleation and growth in the previous day from a large SO2-containing air mass. However, although the intermediate mode contained little OOA during period I, an intermediate mode of OOA together with the
20
ultrafine mode for this species gradually emerged after around noon or so (Figs. 14d and d’). By Period IV the size distributions of OOA and SO2−4 are very similar and both show tri-modal characteristics (Figs. 14c, c’, d, and d’), suggesting that the growth of OOA was due to condensation of secondary organics on all the available surface area. Further evidence for this condensation hypothesis is that the growth patterns of
25
OOA and sulfate (Figs. 14c and d) are consistent with the aerosol condensational sink distributions (Fig. 14b). This is seen more clearly in Fig. 15, which shows the size-dependent increase of the OOA concentration follows the average CS distribution during Period IV. In contrast, there is no obvious evidence of condensational growth
ACPD
5, 8421–8471, 2005 Hydrocarbon-like and oxygenated organic aerosols Q. Zhang et al. Title Page Abstract Introduction Conclusions References Tables Figures J I J I Back CloseFull Screen / Esc
Print Version
Interactive Discussion
EGU of the HOA mode on this day (Figs. 14e and e’). These observations provide strong
evidence that the increase in OOA during this event is due to condensation, supporting the hypothesis that photochemically produced secondary organic aerosols played an important role in new particle growth (Zhang et al., 2004). In addition, the mass spec-trum of OOA during new particle formation event is very similar to the OOA specspec-trum
5
derived from analyzing the entire study. This reinforces the link between OOA and SOA for the study as a whole.
Finally we can use the data in Fig. 14a to calculate the relative photochemical pro-duction rates of OOA and O3. Between 10:00 a.m. to 04:00 p.m. on 12 September 2002, OOA and O3 increase with a nearly constant growth rates of ∼0.19 µg m−3h−1
10
for OOA and 5 ppb h−1 for O3, that yield an observed ratio ∼38 ng m−3 OOA/ppb O3. As discussed above the concentrations of OOA and O3 do not correlate for the study as a whole, likely due to the high background of OOA that buries the relatively small local production of OOA. However in the afternoon of 12 September 2002, because of the low background of OOA and intense UV light (Zhang et al., 2004), the increase
15
of OOA due to photochemical production becomes more apparent and correlates to increase of ozone. Although this ratio of observed SOA to O3production efficiencies is only characteristic of the air mass sampled that day it is of great interest to compare it with other studies in the future.
4. Conclusions
20
This paper reports the mass concentrations, size distributions, and temporal variations of hydrocarbon-like and oxygenated organic aerosols in Pittsburgh during September 2002 and discusses the possible sources and processes of these two aerosol compo-nents accordingly. HOA and OOA together capture nearly 100% of the organic aerosol mass with HOA representing 34% of the total on average and OOA representing 66%.
25
The time series of HOA correlates well with those of combustion source tracers, in-cluding NOx, CO, and EC, and demonstrates a well-defined diurnal pattern that peaks
ACPD
5, 8421–8471, 2005 Hydrocarbon-like and oxygenated organic aerosols Q. Zhang et al. Title Page Abstract Introduction Conclusions References Tables Figures J I J I Back CloseFull Screen / Esc
Print Version
Interactive Discussion
EGU during morning rush hours and decreases with the rise of the boundary layer. The
size distribution of HOA constantly shows a prominent ultrafine mode that on aver-age accounts for ∼1/3 of the HOA mass. These observations, together with the mass spectrum of HOA, which is dominated by ion series characteristics for long chain hydro-carbons, indicate a direct correspondence of HOA to primary OA from local emissions
5
(from combustion processes).
The time series and size distribution of OOA are distinctly different from those of HOA, but show close similarity to those of SO2−4 – a major secondary aerosol species in the Pittsburgh region. The diurnal profiles of both OOA and SO2−4 are relatively flat and their size distributions are generally dominated by the accumulation mode. These
10
observations, together with the fact that the mass spectrum of OOA highly resembles those of aged and oxidized OA, suggests the secondary and regional nature of Pitts-burgh OOA. The direct correspondence of OOA to SOA is particularly evident during an intense new particle formation and growth event, when condensational growth of OOA was found to be mainly responsible for the increase of OOA mass. In addition,
accord-15
ing to the observed HOA/CO emission ratios and ambient CO levels, oxidation/aging of HOA appears to be very small on the time scale of several hours.
Based on the mass spectra of HOA and OOA and the likely elemental compositions of major m/z’s, we estimated the carbon contents of HOA and OOA and their average OM:OC ratios, which are 1.2 and 2.2 µg/µg C for HOA and OOA, respectively. The total
20
carbon concentrations (=HOC+OOC) thus calculated agree well with those measured by the Sunset Lab Carbon analyzer (r2=0.87; slope=1.01±0.11). The carbon concen-trations of HOA and OOA correlate well to those in POC and SOC estimated by the OC/EC tracer technique assuming POC-to-EC ratio=1, respectively. In addition, based on the comparisons of the fractional distribution of HOC and OOC to those of POC and
25
SOC estimated from the EC/OC measurement applying different POC to EC ratios, it appears that the EC/OC tracer method is capable to provide correct estimation of POC and SOC, at least in Pittsburgh, as long as the right POC/EC ratio is given.
ACPD
5, 8421–8471, 2005 Hydrocarbon-like and oxygenated organic aerosols Q. Zhang et al. Title Page Abstract Introduction Conclusions References Tables Figures J I J I Back CloseFull Screen / Esc
Print Version
Interactive Discussion
EGU RD832161010, by NSF CAREER grant ATM 0449815, and by NASA Grant NNG04GA67G.
Although this work has been partly funded by EPA, it has not been subjected to the Agency’s review and therefore does not necessarily reflect the views of the Agency and no official en-dorsement should be inferred. The authors thank S. Pandis (CMU) for organizing and directing the PAQS campaign, C. Stanier (U. of Iowa) for particle number distribution data, B. Wittig
5
(CUNY) for gas phase and meteorology data, R. Subramanian (UIUC), J. Cabada-Amaya (Tec-nol ´ogico de Monterrey, Mexico), A. Robinson (CMU), A. Polidori and B. Turpin (Rutgers Univ.) for EC/OC data, and A. Aiken (CU) for high-resolution ToF-AMS data analysis. We also thank M. Hannigan (CU), A. Robinson, and N. Donahue (CMU) for helpful discussions.
Appendix A1
10
The AMS with a quadrupole mass spectrometer (Q-AMS) can only scan a subset of
m/z’s (typically <20) in the particle time-of-flight mode for a given study (Jimenez et al.,
2003), from which the size distributions of bulk organic aerosols are calculated (Allan et al., 2003b). Depending on the selection of the organic m/z’s scanned, the calcu-lated size distribution of bulk organic aerosol may be biased to different degrees. Note
15
that the new time-of-flight AMS (ToF-AMS) acquires the size distribution of each m/z’s simultaneously and therefore can determine organic size distributions with little uncer-tainty (Drewnick et al., 2005). However, this instrument had not yet been developed during this study.
An alternative approach to calculate the size distribution of bulk organic aerosols is
20
to add together those of HOA and OOA since these two components together account for more than 99% of the variance in the measured mass concentrations of organic aerosols in Pittsburgh (Zhang et al., 2005a). We therefore compare in Fig. A1 the average size distribution of organic aerosols for the entire study estimated based on the HOA and OOA size distributions to that based on the 8 organic m/z’s scanned
25
(m/z’s 27, 43, 44, 55, 47, 67, 91, 92) (Zhang et al., 2005b). These 8 m/z’s together account for ∼30%, on average, of the total organic signal.
ACPD
5, 8421–8471, 2005 Hydrocarbon-like and oxygenated organic aerosols Q. Zhang et al. Title Page Abstract Introduction Conclusions References Tables Figures J I J I Back CloseFull Screen / Esc
Print Version
Interactive Discussion
EGU are representative and allow a reasonable reconstruction of the size distributions of
organic aerosols in Pittsburgh. As a result, the organic size distributions reported in previous papers relevant to this study are reasonably accurate (Khlystov et al., 2005; Zhang et al., 2005b, 2004).
References
5
Alfarra, M. R.: Insights into Atmospheric Organic Aerosols Using an Aerosol Mass Spectrome-ter, Ph.D. Dissertation thesis, University of ManchesSpectrome-ter, ManchesSpectrome-ter, 2004.
Allan, J. D., Alfarra, M. R., Bower, K. N., Williams, P. I., Gallagher, M. W., Jimenez, J. L., Mc-Donald, A. G., Nemitz, E., Canagaratna, M. R., Jayne, J. T., Coe, H., and Worsnop, D. R.: Quantitative sampling using an Aerodyne Aerosol Mass Spectrometer. Part 2:
Measure-10
ments of fine particulate chemical composition in two UK Cities, J. Geophys. Res., 108(D3), 4091, doi:10.1029/2002JD002359, 2003a.
Allan, J. D., Jimenez, J. L., Williams, P. I., Alfarra, M. R., Bower, K. N., Jayne, J. T., Coe, H., and Worsnop, D. R.: Quantitative sampling using an Aerodyne Aerosol Mass Spectrometer. Part 1: Techniques of data interpretation and error analysis, J. Geophys. Res., 108(D3), 4090,
15
doi:10.1029/2002JD002358, 2003b.
Allen, D. T., Palen, E. J., Haimov, M. I., Hering, S. V., and Young, J. R.: Fourier-Transform Infrared-Spectroscopy of aerosol collected in a Low-Pressure Impactor (LPI/FTIR) – Method development and field calibration, Aerosol Sci. Technol., 21(4), 325–342, 1994.
Anderson, R. R., Martello, D. V., White, C. M., Crist, K. C., John, K., Modey, W. K., and Eatough,
20
D. J., The regional nature of PM2.5 episodes in the upper Ohio river valley, Air & Waste Manage. Assoc., 54, 971–984, 2004.
Bates, T. S., Quinn, P. K., Coffman, D. J., Johnson, J. E., and Middlebrook, A. M.: The dom-inance of organic aerosols in the Marine Boundary Layer over the Gulf of Maine during NEAQS 2002 and their role in aerosol light scattering, J. Geophys. Res., in press, 2005.
25
Blando, J. D., Porcja, R. J., Li, T. H., Bowman, D., Lioy, P. J., and Turpin, B. J.: Secondary formation and the Smoky Mountain organic aerosol: An examination of aerosol polarity and functional group composition during SEAVS, Environ. Sci. Technol., 32(5), 604–613, 1998. Blando, J. D., Porcja, R. J., and Turpin, B. J.: Issues in the quantitation of functional groups by
ACPD
5, 8421–8471, 2005 Hydrocarbon-like and oxygenated organic aerosols Q. Zhang et al. Title Page Abstract Introduction Conclusions References Tables Figures J I J I Back CloseFull Screen / Esc
Print Version
Interactive Discussion
EGU FTIR spectroscopic analysis of impactor-collected aerosol samples, Aerosol Sci. Technol.,
35(5), 899–908, 2001.
Cabada, J. C., Pandis, S. N., and Robinson, A. L.: Sources of atmospheric carbonaceous particulate matter in Pittsburgh, Pennsylvania, Air & Waste Manage. Assoc., 52(6), 732– 741, 2002.
5
Cabada, J. C., Pandis, S. N., Subramanian, R., Robinson, A. L., Polidori, A., and Turpin, B.: Estimating the secondary organic aerosol contribution to PM2.5using the EC tracer method, Aerosol Sci. Technol., 38(S1), 140–155, 2004a.
Cabada, J. C., Rees, S., Takahama, S., Khlystov, A., Pandis, S. N., Davidson, C. I., and Robin-son, A. L.: Mass size distributions and size resolved chemical composition of fine particulate
10
matter at the Pittsburgh Supersite, Atmos. Environ., 38(20), 3127–3141, 2004b.
Castro, L. M., Pio, C. A., Harrison, R. M., and Smith, D. J. T.: Carbonaceous aerosol in urban and rural European atmospheres: estimation of secondary organic carbon concentrations, Atmos. Environ., 33(17), 2771–2781, 1999.
Chung, S. H. and Seinfeld, J. H.: Global distribution and climate forcing of carbonaceous
15
aerosols, J. Geophys. Res., 107(D19), 4407, doi:10.1029/2001JD001397, 2002.
de Gouw, J. A., Middlebrook, A. M., Warneke, C., Goldan, P. D., Kuster, W. C., Roberts, J. M., Fehsenfeld, F. C., Worsnop, D. R., Canagaratna, M. R., Pszenny, A. A. P., Keene, W. C., Marchewka, M., Bertman, S. B., and Bates, T. S.: Budget of organic carbon in a polluted atmosphere: Results from the New England Air Quality Study in 2002, J. Geophys. Res.,
20
110, D16, D16305, doi:10.1029/2004JD005623, 2005.
DeCarlo, P., Slowik, J. G., Worsnop, D. R., Davidovits, P., and Jimenez, J. L.: Particle morphol-ogy and density characterization by combined mobility and aerodynamic diameter measure-ments. Part 1: Theory, Aerosol Sci. Technol., 38, 1185–1205, 2004.
Decesari, S., Facchini, M. C., Fuzzi, S., McFiggans, G. B., Coe, H., and Bower, K. N.: The
25
water-soluble organic component of size-segregated aerosol, cloud water and wet deposi-tions from Jeju Island during ACE-Asia, Atmos. Environ., 39(2), 211–222, 2005.
Decesari, S., Facchini, M. C., Fuzzi, S., and Tagliavini, E.: Characterization of water-soluble organic compounds in atmospheric aerosol: A new approach, J. Geophys. Res., 105(D1), 1481–1489, 2000.
30
Decesari, S., Facchini, M. C., Matta, E., Mircea, M., Fuzzi, S., Chughtai, A. R., and Smith, D. M.: Water soluble organic compounds formed by oxidation of soot, Atmos. Environ., 36(11), 1827–1832, 2002.