HAL Id: hal-02945295
https://hal.archives-ouvertes.fr/hal-02945295
Submitted on 22 Sep 2020
HAL is a multi-disciplinary open access
archive for the deposit and dissemination of
sci-entific research documents, whether they are
pub-lished or not. The documents may come from
teaching and research institutions in France or
abroad, or from public or private research centers.
L’archive ouverte pluridisciplinaire HAL, est
destinée au dépôt et à la diffusion de documents
scientifiques de niveau recherche, publiés ou non,
émanant des établissements d’enseignement et de
recherche français ou étrangers, des laboratoires
publics ou privés.
New astrometric measurement and reduction of USNO
photographic observations of the main Saturnian
satellites: 1974–1998
Vincent Robert-Pélissier, D. Pascu, V. Lainey, J.-E. Arlot, J.-P. de Cuyper, V.
Dehant, W. Thuillot
To cite this version:
Vincent Robert-Pélissier, D. Pascu, V. Lainey, J.-E. Arlot, J.-P. de Cuyper, et al.. New astrometric
measurement and reduction of USNO photographic observations of the main Saturnian satellites:
1974–1998. Astronomy and Astrophysics - A&A, EDP Sciences, 2016, 596, pp.A37.
�10.1051/0004-6361/201629807�. �hal-02945295�
A&A 596, A37 (2016) DOI:10.1051/0004-6361/201629807 c ESO 2016
Astronomy
&
Astrophysics
New astrometric measurement and reduction of USNO
photographic observations of the main Saturnian satellites:
1974
−
1998
?
V. Robert
1,2, D. Pascu
3,??, V. Lainey
2, J.-E. Arlot
2, J.-P. De Cuyper
4, V. Dehant
4, and W. Thuillot
21 Institut Polytechnique des Sciences Avancées IPSA, 11−15 rue Maurice Grandcoing, 94200 Ivry-sur-Seine, France
e-mail: vincent.robert@obspm.fr
2 Institut de Mécanique Céleste et de Calcul des Éphémérides IMCCE, Observatoire de Paris, PSL Research University, CNRS,
Sorbonne Universités, UPMC Univ. Paris 06, Univ. Lille 1, 77 Av. Denfert-Rochereau, 75014 Paris, France
3 United States Naval Observatory USNO, 3458 Massachusetts Ave NW, Washington, DC 20392, USA 4 Royal Observatory of Belgium ROB, avenue Circulaire 3, 1180 Uccle, Belgique
Received 28 September 2016/ Accepted 12 October 2016
ABSTRACT
Context.Accurate positional measurements of planets and satellites are used to improve our knowledge of their orbits and dynamics, and to infer the accuracy of the planet and satellite ephemerides.
Aims.In the framework of the European FP7 ESPaCE program, we provide the positions of Saturn and its main satellites taken with the US Naval Observatory 26-inch refractor from 1974 to 1998.
Methods. We measured 526 astrophotographic plates with the digitizer of the Royal Observatory of Belgium and reduced them through an optimal process that includes image, instrumental, and spherical corrections using the UCAC4 catalog to provide the most accurate equatorial (RA, Dec) positions.
Results.We compared the observed positions of the satellites with the theoretical positions from INPOP13c and DE432 planetary ephemerides and from NOE-6-2015-SAT and SAT375 satellite ephemerides. The mean post-fit rms residuals in equatorial positions range from ±68 mas for the Titan observations or 400 km at Saturn, to ±100 mas for the Hyperion observations or 600 km at Saturn. The mean post-fit rms intersatellite residuals range from ±46 mas for the Rhea-Titan observations or 280 km at Saturn, to ±72 mas for the Hyperion-Titan observations or 430 km at Saturn.
Key words. astrometry – ephemerides – planets and satellites: individual: Saturn
1. Introduction
The European Satellite Partnership for Computing Ephemerides, the ESPaCE project, aims at strengthening the collaboration and at developing new knowledge, new technology, and products for the scientific community in the domains of the develop-ment of ephemerides and reference systems for natural satel-lites and spacecraft. Several European research centers involved in space sciences and dynamics were associated. The activity is focused on extracting and analyzing astrometric data from ground-based and spacecraft measurements that will be com-bined to build new ephemerides. It is intended to provide new dynamical models for natural satellites, a characterization of their rotation properties, and to improve spacecraft orbit de-termination from space science. Since we have demonstrated that a precise digitization and a new astrometric reduction of old photographic plates could provide very accurate positions (Robert 2011; Robert et al. 2011), the project leaders chose to
? Full Table 1 is only available at the CDS via
anony-mous ftp to cdsarc.u-strasbg.fr (130.79.128.5) or via
http://cdsarc.u-strasbg.fr/viz-bin/qcat?J/A+A/596/A37, at the Natural Satellites DataBase and Natural Satellites Data Center services of IMCCE via http://nsdb.imcce.fr/ or
http://www.imcce.fr/nsdc/ ?? USNO retired.
consider such observations as a significant task for the ESPaCE program.
Recently, Desmars et al. (2009)have shown that astromet-ric data spread over a long time span were better than more accurate astrometric data spread over a short interval of time for dynamical and ephemeris purposes. The extrapolation of the ephemerides for space missions are more reliable. Simi-larly,Arlot et al. (2012)have shown the benefit of using old ob-servations and how new reductions and future reductions with the Gaia catalog (Robin et al. 2012) will be useful. In view of this, we first obtained the large photographic plate archive of the Martian satellites taken at the US Naval Observatory (USNO) from 1967 to 1997 for remeasurement and reanalysis. Thanks to the accurate and dense star catalog used, and most important, thanks to the digitization of the photographic plates and the new astrometric treatment, we demonstrated that we were able to provide accurate positions for Mars and its satel-lites (Robert et al. 2014, 2015), and that astrometric data de-rived from photographic plates can compete with those of old spacecraft.
The success of this work and the new value of old photo-graphic observations motivated us to study other planetary sys-tems with such material. We have therefore obtained the large photographic plate archive of the Saturnian satellites taken at
USNO from 1974 to 1998 and decided to reanalyze the complete series.
2. Historical context
In the early 1970s, as NASA was planning the “Grand Tour” of the outer planets, it was quickly determined that the ex-isting ephemerides of the planetary satellites were not accu-rate enough for the reconnaissance of the Voyager probes with these bodies. NASA approached the USNO because of its in-stitutional expertise in satellite studies for help in improving the orbits of the satellites. The Working Group of Outer Planet Satellites was formed under the leadership of USNO and NASA (Seidelmann 1977, 1979). Experts in the observation and dynam-ics of planetary satellites participated in workshops of the Work-ing Group and included representatives from USNO, Green-wich Observatory in the UK, the Bureau des Longitudes (BDL) in Paris, the Jet Propulsion Laboratory (JPL), the University of Texas (McDonald Observatory), the University of Virginia (McCormick Observatory), the Harvard-Smithsonian Observa-tory, and the Lowell Observatory. The bulk of the photographic observations of the main satellites were made at USNO and the McCormick observatories, while the fainter satellites were observed at the McDonald observatory. Mutual event observa-tions of the Galilean satellites were made principally by Lowell, Harvard-Smithsonian, and BDL staff. Theoretical studies and the adjustments of the satellite orbits to the observations were prin-cipally made at JPL and BDL. The final satellite orbits were of unprecedented accuracy and indispensable to the success of the Voyager Mission.
3. USNO photographic observations
Extensive and intensive visual micrometer observations of the Saturnian satellites were made from the late 19th century to the mid-20th century with the Alvan Clark great refractors. This in-cluded the observations by Hermann and Georg Struve with the Pulkovo 30-inch refractor and the observations of Barnard with the Yerkes 40-inch refractor. The most extensive series of vi-sual observations of Saturn’s satellites were made at USNO with the Clark 26-inch − the first of the great refractors, however. This series began shortly after the construction of the 26-inch in 1872 and ended in 1947(Hammond 1911a,b; Hall & Burton 1929, 1961).
The first long-focus photographic observations of the Satur-nian satellites were made in 1926 byAlden & O’Connell (1928) with the photographic refractor of the Yale Southern Station at Johannesburg, South Africa.Struve (1928)compared the Alden and O’Connell photographic observations to his own microm-eter observations and concluded that the photographic observa-tions were superior in accuracy, efficiency in observation, and reduction, and they served as a permanent record for future use. The Johannesburg series was continuous until 1935 and re-sumed in 1945 for three years. A shorter series was taken with the Thaw refractor of the Allegheny Observatory in Pittsburgh, Pennsylvania, from 1940 to 1947. This shorter series was taken to augment the South African series. Garcia (1972) discussed this combined set of photographic observations. However, these photographic observations had a major deficiency: the images of Mimas and Enceladus could not be measured. For this reason, USNO continued micrometer observations of the satellites until 1947.
The second and third of the extensive and intensive series of long-focus photographic observations were made concurrently
at USNO and Pulkovo from the mid-1970s until the end of the century. The USNO photographic observations, taken with the 26-inch refractor, ended in 1999 when Kodak ceased mak-ing the necessary plates, while Pulkovo continued their pho-tographic program for a few more years using ORWO plates (Kiseleva & Khrutskaya 2007; Kiseleva et al. 2015).
Mimas, the innermost of Saturn’s main satellites, had a poor observational history owing to its proximity to the rings and to its faintness. Enceladus, somewhat brighter and farther from the planet, was easier to observe. Since neither of these two could be measured on the Johannesburg or Allegheny plates, how-ever, it was made a priority of the USNO observational pro-gram to obtain photographic positions for these two satellites. It was quickly determined that a 60-s exposure with 103aG or 103aJ plates could record measurable images of Mimas at full aperture when the seeing and transparency were good, but only near elongation. Furthermore, under the finest seeing and trans-parency conditions, measurable images of Hyperion were ob-tained as well. It is not clear why the USNO visual refractor was successful in obtaining images of Mimas and Enceladus but the Allegheny’s Thaw refractor and Yale’s Johannesburg refractor were not. Both of these telescopes were photographic refractors with longer focal lengths. It may be that the emulsions of that period tended to bloom more easily than modern emulsions, or possibly the early plates were not anti-halation backed.
A second priority of the photographic program was to obtain photographic astrometric equatorial positions for Saturn. While meridian circle observations of the planets had improved in ac-curacy by obtaining their positions from the measurement of its satellites, the errors were still too high and only worked reason-ably well for Jupiter and the Galilean moons. Meridian observa-tions can only be made once in a night and during a shortened apparition (when observing the satellites). Photographic obser-vations, however, can be made for a longer interval, and multiple observations can be made each night. It was therefore reasonable to expect that photographic observations would be a major im-provement. To accomplish this, an accurate star catalog was nec-essary. It was expected that the AGK3(Heckmann 1975)would serve that purpose.
Photographic observations of the satellites I−VIII of Saturn were begun at USNO in 1974, on the recommendation of the Working Group, to address the shortcomings of the satellite ephemerides. All plates in the series were taken with the USNO 26-inch refractor. Kodak 103aG, 5 × 7 × 0.06 inch glass plates (anti-halation backed) were used in combination with a Schott GG14 (yellow) filter for observations made from 1975 to 1999. The 1974 series were taken on both 103aG and 103aJ plates. The GG14 filter was 5 × 7 inch × 3 mm, polished optically flat and parallel. Placed immediately in front of the GG14 was a clear glass plate, 5 × 7 × 0.06 inch, with a small partially transpar-ent metallic Inconel filter, elliptical in shape, placed in its ctranspar-enter by evaporation. The purpose of the small Inconel filter was to reduce the light of the planet to about tenth magnitude, prevent-ing bloomprevent-ing of the planetary image and yieldprevent-ing a measurable image of the rings (see Figs.1and 2). A measurable image of the rings was sought to provide positions of the planet to com-pare with that determined from the satellites. A cartridge plate holder was fabricated in which the combination filter was fixed in the frame above the plate holder. In the observations, with the shutter closed and the plate holder in its cartridge fixed to the right of the focal plane, the Inconel filter was placed over the planet and the plate holder slid out of its cartridge and into the fo-cal plane. The shutter was then opened and the exposure begun. The plate holder could be moved incrementally in the x-direction
V. Robert et al.: USNO astrometric observations of Saturn
permitting several exposures on the plate. In this arrangement, the small Inconel filter was kept close to the emulsion (about 2 mm) to reduce its penumbra and minimize the diffracted light around the edge of the filter. Two to three exposures were taken per plate. When Mimas was the target, 60-s exposures were taken at full aperture. When the equatorial position of Saturn was the intent, 30-s exposures were taken with the aperture di-aphragmed to 16 inches. The purpose of the reduced aperture was to increase the f-ratio, increasing the “coma-free” field, and thus, increasing the available catalog stars used in the plate re-duction to the plate corners. Finally, a trail of a nearby star was recorded on each plate, and occasional grating scale plates of the Pleiades and Praesepe clusters were taken for calibration(Pascu 1977, 1979).
The observations were continued until January 1999, when Kodak stopped the manufacture of photographic plates used in astrometry. Plates were taken at all oppositions except that of 1995 because of poor weather. In summary, 676 multiple expo-sure plates were taken on 177 nights over 25 yr and 24 appari-tions. The plates taken from 1974 to 1980 were measured with the USNO automatic measuring machine and reduced with the stars of the AGK3 catalog(Pascu & Schmidt 1990). The root-mean square (rms) of the intersatellite observations ranged from ±70 mas for the Rhea-Titan observations to ±150 mas for the Mimas-Titan observations. The equatorial RA and Dec of Saturn were determined with a rms of ±250 mas, due mainly to the er-rors in the AGK3 catalog. These observations have been used in support of all reconnaissance probes to the Saturn system, as well as theoretical developments by dynamicists. TableA.1 sum-marizes the exposure data for the twenty-four oppositions in the series.
New developments in the past 20 yr make the USNO plate archive valuable for reassessment. First, the plates from 1981 to 1998 have never been measured. Second, the new plate digitizer of the Royal Observatory of Belgium(de Cuyper et al. 2011)can make measurements of unprecedented accuracy. Third, the new star catalogs have improved tremendously in precision and den-sity(Zacharias et al. 2013). The measurement and reduction of the entire twenty-four opposition USNO archive of plates of the Saturn system will be invaluable to the study of the motions and dynamics of that system(Lainey et al. 2015).
4. Measurement and reduction
Five hundred twenty-six plates were selected and transmitted to the ROB to be digitized(de Cuyper et al. 2011; Robert et al. 2011). Each plate contains two to three exposures shifted in the RA direction. The exposure times of the photographic plates are 20−90 s. The field of view is 57 arcmin on the x-axis and 43 arcmin on the y-axis. We were able to make measurements for 1269 positions of Saturn, 257 positions of Mimas, 342 po-sitions of Enceladus, 531 popo-sitions of Tethys, 639 popo-sitions of Dione, 1126 positions of Rhea, 1185 positions of Titan, 101 po-sitions of Hyperion, and 992 popo-sitions of Iapetus.
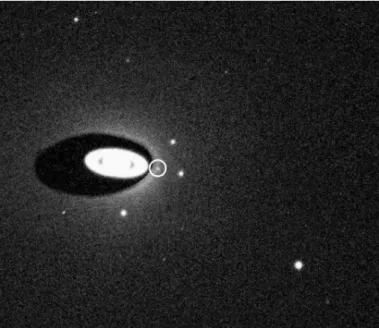
Figure1shows the center of the digitized (positive) USNO Saturnian plate No. 02013, which is a typical digitized image. This 60-s exposure of the Saturn system was taken with the USNO 26-inch refractor on 24 January 1975. A Kodak 103aG plate, in combination with a Schott GG14 filter, was used to limit the bandwidth of the exposure to the visual focal properties of the 26-inch lens. The small, partially transparent Inconel filter covers the planet, reducing its light and providing a measurable image of Saturn and the rings. The shadow of the Inconel filter is clearly seen around Saturn. The satellites visible in this exposure
Fig. 1.Center of the digitization (positive) of the USNO 26-inch Sat-urnian plate No. 02013. Brighter images are the satellites. From left to right: Iapetus, Rhea, Mimas (displayed in the white circle), Dione, Tethys, and Titan. The dark shape around Saturn is the shadow of the small Inconel filter. Enceladus is close to Saturn, and behind the filter. North is up, east to the left.
Fig. 2.Center of the digitization (positive) of the USNO 26-inch Sat-urnian plate No. 04017. From left to right: Dione, Mimas (displayed in the white circle), Rhea, and Titan. North is up, east to the left.
are, from left to right, Iapetus, Rhea, Mimas, Dione, Tethys, and Titan. Enceladus is behind the Inconel filter. North is up, east to the left.
Figure2shows the center of the digitized (positive) USNO Saturnian plate No. 04017, which is a typical digitized image. This 60-s exposure of the Saturn system was taken with the USNO 26-inch refractor on 16 March 1977. The plate/filter com-bination is the same as for Fig.1. The satellites visible in this exposure are, from left to right, Dione, Mimas, Rhea, and Titan. North is up, east to the left.
Measurement and reduction techniques were the same as de-scribed in Robert et al. (2014) with small differences because
the planet positions were determined by using the method de-scribed inPeng (2005). We fitted an ellipse to the edge of the outer rings by least squares to measure its geometric center. Mea-sured (x, y) plate positions were corrected for instrumental and spherical effects. The observations contain two to fifteen UCAC4 reference stars(Zacharias et al. 2013), and the reductions were performed using suitable four constant functional models to pro-vide equatorial (RA, Dec) astrometric positions of the planet and its satellites. Scale ρ, orientation θ, and offsets ∆x and∆y were
modeled for the determination of the tangential (X, Y) coordi-nates. All our observations were equatorial (RA, Dec) astromet-ric positions obtained from tangential (X, Y) coordinates by us-ing the gnomonic inverse projection and determined in an ICRS geocentric reference frame to be easily compared with the most recent ephemerides.
5. Positioning results
We used our data to fit the numerical integration of the last IMCCE NOE-6-2015-SAT satellite ephemerides (Lainey et al. 2015). We rejected observations for which the astrometric cal-ibration was not reliable, which mainly occurred when the shape of the reference stars due to errors in the guiding or their faint-ness did not allow for a precise measurement. We then focused on individual observations for which the residuals of the satel-lites were independently lower than the 3σ value of their rms residuals in right ascension and declination, before final adjust-ment. Positions for Saturn were derived indirectly from the four bright moons.
We compared the positions of Saturn and its main satel-lites with their theoretical computed positions given by the INPOP13c planetary ephemeris(Fienga et al. 2014) and NOE-6-2015-SAT satellite ephemerides. This concerns 1055 positions of Saturn, 123 positions of Mimas, 285 positions of Enceladus, 389 positions of Tethys, 524 positions of Dione, 849 positions of Rhea, 968 positions of Titan, 29 positions of Hyperion, and 779 positions of Iapetus. In the list available in electronic form at the CDS and IMCCE, the corresponding geocentric observed positions refer to the ICRF, and the mean time of observation is given in Barycentric Dynamical Time TDB. Starting from the lefthand column, we provide the object name, the mean TDB date of observation in Julian Days, the geocentric observed right ascension, and declination in degrees. Table1gives an extract of this list. The distributions of the (O−C)s and residuals in equa-torial right ascension and declination are provided in Figs.3−7, and Table2. They show the difference of (RA, Dec) coordinates for individual planet and satellites, hence the observed positions versus positions calculated from INPOP13c ephemeris.
Offsets for each night of a single opposition set are small, but biases can occur in both the RA and Dec coordinates. We conclude that the exposure timing can be ruled out. The dome clock was calibrated each night to the USNO masterclock, and the camera shutter could be opened and closed on integral sec-onds with a precision of 0.2−0.3 s. The time of mid-exposure thus has a precision better than 0.5 second. We have already discussed the impact of local systematic errors of the reference star catalogs(Robert 2011; Robert et al. 2011, 2014, 2015): the epoch differences between the plates and the central epoch of the reference stars are up to about 20 yr, and their expected system-atic errors are about 10−50 mas. Observations of each opposi-tion span one to six months, that is to say, from 1◦to 6◦ along the path of Saturn. The sets of reference stars are different, and with about two to fifteen stars per field, the astrometric reduction may be affected by catalog errors of individual reference stars.
Table 1. Extract from the astrometric positions list of Saturn and its main satellites.
Object Date (TDB) RA (deg) Dec (deg)
Saturn 2 442 130.511344 88.568329 22.635496 Mimas 2 442 130.511344 88.561443 22.632991 Enceladus 2 442 130.511344 88.557874 22.633639 Tethys 2 442 130.511344 88.560271 22.639330 Dione 2 442 130.511344 88.551249 22.633259 Rhea 2 450 362.642617 4.027505 −1.095570 Titan 2 450 362.642617 4.106022 −1.101121 Hyperion 2 450 362.642617 4.008639 −1.090307 Iapetus 2 450 362.642617 3.902936 −1.114601
Notes. The full table is available at the CDS and IMCCE.
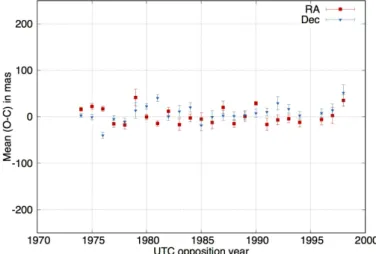
Fig. 3. Equatorial mean (O−C)s for Saturn positions according to INPOP13c ephemerides. The x-axis shows the UTC year of opposition and y-axis the mean (O−C) with errors. Red squares and blue triangles denote RA and Dec coordinates, respectively.
Offsets for each opposition set, visible in Figs.4and6, are small and can be modeled with a 14.7 ± 0.004-yr periodic sig-nal of 5.2 ± 1.8 mas of magnitude. This periodicity corresponds to both the favorable opposition period of Saturn and the edge-wise presentation of the rings. Because this effect is similar to that we found with the analysis of the USNO Martian obser-vations(Robert et al. 2015), however, this second case can be ruled out. We conclude that when the planet crosses the ecliptic plane, its relative distance to Earth is either minimum or max-imum, and the offset is zero. This indicates that the eccentric-ity and inclination of the orbit of Saturn introduces a height effect as well. We also conclude that any mismodeling of in-strumental and spherical corrections, and in particular, of the total and differential atmospheric refraction, can be ruled out because the offsets at minimum and maximum distances are zero, so that no effect remains. Moreover, the signal is elimi-nated while dealing with intersatellite residuals. We fitted a pe-riodic signal with the residuals according to DE432 ephemeris (Folkner 2014)and the amplitude slightly changed to 4.2 mas, but observations used for the fit of the numerical integrations leading to INPOP13c and DE432 are quite similar. We also fit-ted a periodic signal according to older ephemerides for which observations used for the fit and numerical integrations are sig-nificantly different. The amplitude of the fitted signal according to DE200 ephemeris(Standish 1982) and VSOP87 ephemeris (Bretagnon & Francou 1988)changed to 38.8 mas and 37.6 mas,
V. Robert et al.: USNO astrometric observations of Saturn
Table 2. Details of the equatorial mean (O−C)s for Saturn and mean residuals for the satellites in mas, according to NOE-6-2015-SAT and INPOP13c ephemerides.
∆α cos δ SEM∆α cos δ σ∆α cos δ ∆δ SEM∆δ σ∆δ
+/− +/− +/− +/− Saturn 0.5 2.0 63.5 2.2 2.0 64.3 Mimas 1.7 9.3 102.7 −1.0 8.8 97.9 Enceladus 6.9 6.0 101.5 −1.1 5.6 93.8 Tethys 1.8 4.0 79.1 4.1 4.0 78.2 Dione 2.1 3.3 75.5 4.1 3.3 75.6 Rhea 3.5 2.5 72.1 0.8 2.5 72.1 Titan 1.5 2.1 66.6 1.0 2.2 69.0 Hyperion −9.8 21.0 113.0 −0.2 17.0 91.7 Iapetus 7.4 2.8 77.0 −8.8 2.4 67.6
Fig. 4.Equatorial mean residuals according to NOE-6-2015-SAT and INPOP13c ephemerides. The x-axis shows the UTC year of opposition and y-axis the RA and Dec mean residuals with errors. Purple squares denote Tethys, green triangles Dione, blue circles Rhea, and yellow crosses Titan.
respectively. This confirms that adjustment and weighting of the planetary ephemeris used could explain the difference in the magnitude of the effect.
The average residual values for the observations made from 1974 to 1998 are very low in RA and Dec coordinates. We can see that the satellite variances in RA are higher than those in Dec, since their apparent motion is essentially in RA. To estimate the influence of the planetary ephemeris on the results, we computed
Fig. 5. Equatorial residuals according to NOE-6-2015-SAT and INPOP13c ephemerides. The x-axis shows the RA residuals and y-axis the Dec residuals. Purple squares denote Tethys, green triangles Dione, blue circles Rhea, and yellow crosses Titan.
the difference between observed positions and positions calcu-lated from DE432 ephemeris and from older planetary models and, in particular, from DE421 (Folkner et al. 2009), DE200, INPOP08(Fienga et al. 2009), and VSOP87 ephemerides. More precisely, data from the Cassini mission were introduced for the fit of DE421 and INPOP08, and it allowed us to cor-rect the planet positions for important biases in the RA co-ordinate that are mainly due to imprecisions in its longitude, in its distances from Earth, and in its geocentric angular po-sitions. Differences with DE200 and VSOP87 will let us ap-preciate such improvements. Table A.2 shows the difference between the observed positions and positions calculated from the corresponding ephemerides. The mean difference between INPOP13c, INPOP08, DE432, and DE421 for Saturn is sup-posed to be smaller than 3 mas (Fienga et al. 2014), and we may deduce from our results that this value is realistic for both coordinates. As we determined with the analysis of the USNO Martian observations, however, these average (O−C) values are minimized over our time span because a large number of obser-vations were taken between successive oppositions of Saturn and the periodic evolution alternates between minimum and maxi-mum values. Even though the differences between the most re-cent planetary ephemerides are small, we estimate from the am-plitude of the periodic signals we fitted that the mean external error of DE432 is 4.2 mas, and 5.2 mas for INPOP13c. We have
Fig. 6.Equatorial mean residuals according to NOE-6-2015-SAT and INPOP13c ephemerides. The x-axis shows the UTC year of opposition and y-axis the RA and Dec mean residuals with errors. Orange squares denote Mimas, blue triangles Enceladus, black circles Hyperion, and yellow crosses Iapetus.
already discussed the impact of accidental observational errors and mismodeling, and we assume that no observational effect remains at the level of 1 mas(Kaplan et al. 1989; Robert 2011). As we concluded before, such a signal may be introduced by the use of the planetary model itself. Because only differences be-tween planetary models are evaluated in corresponding papers, we have no information about their external errors that are gen-erally estimated separately by comparison between observations that were not used for the fit and the theories. We there see from old observations that the mean external error of recent planetary ephemerides for Saturn could reach 5 mas, that is to say, twice the internal accuracy officially provided. We previously found such a bias with the Martian system(Robert et al. 2015). Com-parisons with old observations indicate that the external error of recent planetary ephemerides for Mars reaches 10 mas. Further investigations are planned as well to confirm a preliminary re-sult that indicates that the external error of most recent planetary models for Jupiter is up to 20 mas.
We also note that the amplitude of the fitted signal accord-ing to DE200 and VSOP87 ephemerides reached 38.7 mas and 37.6 mas, respectively. The main difference between DE200 and VSOP87 theories and planetary ephemerides built afterward is the introduction of data from the Cassini mission for the fit of Saturn. This permitted us to significantly improve our knowledge
Fig. 7. Equatorial residuals according to NOE-6-2015-SAT and INPOP13c ephemerides. The x-axis shows the RA residuals and y-axis the Dec residuals. Orange squares denote Mimas, blue triangles Ence-ladus, black circles Hyperion, and yellow crosses Iapetus.
of its orbit. Our results, and especially the biases in the RA co-ordinates visible for these two models in TableA.2, are in agree-ment with the difference of 100 mas between fits with and with-out the Cassini data estimated byFienga et al. (2009).
We finally compared the observed positions of the main Sat-urnian satellites with their theoretical positions given by the most recent SAT375 JPL ephemerides (Jacobson 2015). Results are quite similar to those given by NOE-6-2015-SAT model within 3 mas difference for all satellites except for Hyperion (15 mas difference in declination), which is consistent with the expected values. Table3 shows the difference between the observed po-sitions and popo-sitions calculated from SAT375 ephemerides. It also shows the difference with NOE-6-2011-SAT ephemerides (Lainey et al. 2012)for which Cassini data were not introduced. The key point is that the NOE-6-2015-SAT/INPOP13c rms (O−C) for all observations of Saturn is 63.9 mas. The NOE-6-2015-SAT/INPOP13c rms residual for all observations is 100.3 mas for Mimas, 97.6 mas for Enceladus, 78.6 mas for Tethys, 75.5 mas for Dione, 72.1 mas for Rhea, 67.8 mas for Titan, 102.3 mas for Hyperion, and 72.3 mas for Iapetus. These average rms (O−C)s and residuals correspond to our observation accuracies over twenty-four oppositions in the se-ries.Pascu & Schmidt (1990)previously measured and reduced exposures of Saturn and satellites taken from 1974 to 1980, mainly to estimate the precision of new photographic techniques. Photographic observations were compared to DE125 ephemeris (Standish 1985), and the external error in right ascension was ±200 mas, and in declination ±270 mas. These results were in agreement with what was expected, and the error due to the ref-erence stars in the budget could explain the orders of magnitude. Moreover, a systematic error in declination was noted. Because no error due to the photographic observations could be found, it was suggested that it was introduced by the use of DE125 model itself, and in more detail, because of the biased visual transit circle observations that were used for its fit. The main counter-parts of the errors were corrected with DE200 ephemerides and the introduction of other observations for the fit of Saturn, but biases in right ascensions remained this time, as we can see in TableA.2. These remaining errors were corrected with DE421 and INPOP08 ephemerides afterward.
V. Robert et al.: USNO astrometric observations of Saturn
Table 3. Details of the equatorial (O−C)s in mas according to SAT375, NOE-6-2011-SAT, and INPOP13c ephemerides.
(O−C)α cos δ SEMα cos δ σα cos δ (O−C)δ SEMδ σδ
+/− +/− +/− +/− SAT375 Mimas 1.7 9.3 103.1 −0.1 8.8 98.1 Enceladus 6.4 6.0 101.5 −1.3 5.6 93.8 Tethys 1.0 4.0 78.7 4.4 3.9 77.7 Dione 2.0 3.3 75.4 4.0 3.3 75.5 Rhea 3.3 2.5 72.0 0.7 2.5 72.0 Titan 3.4 2.1 66.5 1.4 2.2 68.9 Hyperion −13.8 20.6 113.0 14.8 17.7 96.8 Iapetus 6.9 2.7 76.2 −8.7 2.4 67.6 NOE-6-2011-SAT Mimas 1.3 9.2 102.2 −2.5 8.8 98.0 Enceladus 7.5 6.0 101.3 −1.3 5.6 93.7 Tethys 2.7 4.1 80.1 5.0 4.0 78.3 Dione 2.7 3.3 75.7 5.2 3.3 76.0 Rhea 3.8 2.5 72.8 0.5 2.5 71.9 Titan 2.4 2.2 67.3 1.7 2.2 68.6 Hyperion −7.7 21.2 114.0 0.3 17.1 92.0 Iapetus −5.3 2.7 75.7 −11.5 2.5 69.8 6. Intersatellite observations
With Fig. 8 we investigate the effect of the signal-to-noise ra-tio (S/N) on the precision of the observations. The mean (satel-lite − Titan) rms residuals in (∆α cos δ, ∆δ) coordinates are plot-ted against the (satellite – Titan)∆V magnitude difference as a measure of S/N. The solid line fitted to our data demonstrates the decline in positional precision with the faintness of the satel-lite images. While in general, the fainter satelsatel-lites have less well determined orbits than the bright ones, the residuals have Gaussian distributions and are not systematic. They therefore represent observational error, including unmodeled representa-tional errors (such as seeing), measuring errors, plate modeling errors, and catalog reference star errors. We compared our re-sults to the dashed line that is taken from an earlier analysis by Pascu (1994). In that analysis, the plate material from 1974 to 1980 was measured with the USNO automatic measuring ma-chine and reduced with stars from the AGK3 catalog. The rms residuals of these observations resulted from orbital adjustments at the British Almanac Office. The question arises as to what caused the difference in the slope of the relation. Assuming the quality of the early plates to be the same as that of the entire archive, we can draw some conclusions. Since the plates are the same, the difference in slope is not due to representational errors. Moreover, since the lines cross at the magnitude of Titan, cata-log errors and plate modeling errors are probably not the cause. Our interpretation is that the scanning of the images and their centroiding is much superior in the measurement of faint images than with the older automatic measuring machines.
With Fig.9we investigate the astrometric limitation in exter-nal precision due to the atmosphere.Lindegren (1980)discussed the wave-front distortion due to the atmospheric turbulence and its influence on astrometry. He concluded that the mean error of the measured angle θ (radians) between two objects near the zenith is given in arcsec by
m.e = 1.3 θ0.25T−0.5
where T 300θ is the exposure time in seconds. We plotted rms residuals in the (satellite – Titan) separations against the separa-tions for Tethys, Dione and Rhea for the 50−60 s exposures. For
Fig. 8.rms residuals in separation from Titan according to NOE-6-2015-SAT ephemerides, with regard to the exposure time. The x-axis shows the mean rms residuals in separation and y-axis the difference in V-magnitude from Titan. Purple squares denote 30−35 s exposures, green circles 40−45 s exposures, and blue triangles 50−60 s exposures. Orange triangles denote previous measurements made byPascu (1994).
comparison, we also plotted Lindegren’s function above. The curves for all three satellites are nearly coincident, but about 15 mas above the Lindegren function. There appears to be an excess variance in the separations. An obvious source of such an error is the motion of the satellites relative to the sidereal rate during these unguided exposures. This may result in a systematic magnitude error in the (satellite – Titan) separations since Titan is about 2 mag brighter than the other three. However, this would manifest itself as an accidental error because of the multiple con-figurations of each satellite relative to Titan. On the other hand, the Lindegren function, which is referenced to the zenith, would not apply exactly to these observations, which were made on the ecliptic and at times at large zenith distances. This is more likely the source of the small excess error in the observations, and we conclude that we have reached the limit in precision for these
Fig. 9.Mean rms residuals in separation from Titan according to NOE-6-2015-SAT ephemerides, for the 50−60 s exposures. The x-axis shows the satellite-Titan separation and the y-axis the mean rms residuals in separation. Purple squares denote Tethys, green triangles Dione, and blue circles Rhea. Atmospheric limitation is given byLindegren (1980).
observations based on the UCAC4, but we expect a significant improvement when we reduce these observations anew with the Gaiacatalog.
7. Summary and future work
We analyzed a full series of astrophotographic plates of the main Saturnian satellites (I−VIII) taken at USNO from 1974 to 1998. We distinguished two main factors that contributed to the in-crease in precision: the digitization, and the new astrometric re-duction. The digitization of the photographic plates now makes it possible to measure images with a high accuracy and to iden-tify all the available stars, including those that are not detected by eye. In addition, a new astrometric reduction with an accurate and dense star catalog makes it possible to correct for all in-strumental and spherical effects, and to decrease the number of unknown parameters. Thus, we were able to provide astrometric (RA, Dec) positions of the satellites, allowing us to deduce po-sitions of Saturn indirectly, with overall rms residuals of about 73 mas for the four brightest main satellites, and 93 mas for the four faintest main satellites.
These results confirm the high value in continuing the reduc-tion of old observareduc-tions, and photographic plates in particular. We also look forward to the arrival of the complete Gaia ref-erence star catalog and its proper motions especially, because new reductions will yield increased accuracy by eliminating any errors caused by reference star positions. We expect significant improvement in the equatorial positions.
Because most of the observatories and national archives have old and useful observations, we have started to establish contacts for scientific purposes, and more particularly, to improve the dy-namics of the planetary systems with old data, in the framework of the FP7 ESPaCE program. We now continue in the framework of the NAROO project1. A new sub-micrometric digitizer will be set up in Paris at the end of 2016, with a new center of digitiza-tion and analysis of old observadigitiza-tions. It is intended to digitize old astrophotographic plates with high accuracy, reanalyze the
1 See the NAROO webpage of IMCCE and Paris Observatory at http://nsdb.imcce.fr/naroo/
observations, produce new (RA, Dec) astrometric positions of the objects, and provide a free database for the community. Our main goal is to provide accurate positions of the planets, satel-lites, asteroids and comets over one century.
Acknowledgements. The research leading to these results has received funding from the European Community’s Seventh Framework Program (FP7/2007−2013) under grant agreement No. 263466 for the FP7-ESPaCE pro-gram, the International Space Science Institute ISSI, and the CNRS/INSU/CNES “Programme National de Planétologie” PNP and “Gravitation, Références, As-tronomie, Métrologie” GRAM programs. The authors are indebted to all partici-pants of the Encelade WG.
References
Alden, R. L., & O’Connell, W. 1928,AJ, 38, 53
Arlot, J.-E., Desmars, J., Lainey, V., & Robert, V. 2012,Planet. Space Sci., 73, 66
Bretagnon, P., & Francou, G. 1988,A&A, 202, 309
de Cuyper, J.-P., de Decker, G., Winter, L., & Zacharias, N. 2011, in ASP Data Analysis Software and Systems XX, eds. I. N. Evans, A. Accomazzi, D. J. Mink, & A. H. Rots,ASP Conf. Ser., 442, 301
Desmars, J., Arlot, S., Arlot, J.-E., Lainey, V., & Vienne, A. 2009,A&A, 499, 321
Fienga, A., Laskar, J., Morley, T., et al. 2009,A&A, 507, 1675
Fienga, A., Manche, H., Laskar, J., Gastineau, M., & Verna, A. 2014, IMCCE, Observatoire de Paris [arXiv:1405.0484]
Folkner, W. M. 2014, Jet Propulsion Laboratory Memorandum 392R-14-003 Folkner, W. M., Williams, J. G., & Boggs, D. H. 2009,Interplanetary Network
Progress Report, 178, 1
Garcia, H. A. 1972,AJ, 77, 684
Hall, Jr., A., & Burton, H. E. 1929,Publications of the US Naval Observatory, Second Series, XII, 92
Hall, Jr., A., & Burton, H. E. 1961,Publications of the US Naval Observatory, Second Series, Part III, XVII
Hammond, J. C. 1911a,Publications of the US Naval Observatory, Second Series, VI, A15
Hammond, J. C. 1911b,AJ, 26, 175
Heckmann, O. 1975, AGK 3, Star catalogue of positions and proper motions north of −2.5 deg declination (Hamburg-Bergedorf: Hamburger Sternwarte) Jacobson, R. A. 2015, NASA NAIF Generic Kernels
Kaplan, G. H., Hughes, J. A., Seidelmann, P. K., Smith, C. A., & Yallop, B. D. 1989,AJ, 97, 1197
Kiseleva, T. P., & Khrutskaya, E. V. 2007,Sol. Syst. Res., 41, 72
Kiseleva, T. P., Vasil’eva, T. A., Izmailov, I. S., & Roshchina, E. A. 2015,Sol. Syst. Res., 49, 72
Lainey, V., Karatekin, Ö., Desmars, J., et al. 2012,ApJ, 752, 14
Lainey, V., Jacobson, R. A., Tajeddine, R., et al. 2015, ArXiv e-prints [arXiv:1510.05870]
Lindegren, L. 1980,A&A, 89, 41
Pascu, D. 1977, in Planetary Satellites, ed. J. A. Burns,IAU Colloq. 28, 63
Pascu, D. 1979, in Natural and Artificial Satellite Motion, eds. P. E. Nacozy, & S. Ferraz-Mello, 17
Pascu, D. 1994, in Galactic and Solar System Optical Astrometry, eds. L. V. Morrison, & G. F. Gilmore, 304
Pascu, D., & Schmidt, R. E. 1990,AJ, 99, 1974
Peng, Q. Y. 2005,MNRAS, 359, 1597
Robert, V. 2011, Ph.D. Thesis, Observatoire de Paris
Robert, V., de Cuyper, J.-P., Arlot, J.-E., et al. 2011,MNRAS, 415, 701
Robert, V., Lainey, V., Pascu, D., et al. 2014,A&A, 572, A104
Robert, V., Lainey, V., Pascu, D., et al. 2015,A&A, 582, A36
Robin, A. C., Luri, X., Reylé, C., et al. 2012,A&A, 543, A100
Seidelmann, P. K. 1977, in Planetary Satellites, ed. J. A. Burns,IAU Colloq. 28, 533
Seidelmann, P. K. 1979, in Natural and Artificial Satellite Motion, eds. P. E. Nacozy, & S. Ferraz-Mello, 3
Standish, Jr., E. M. 1982,A&A, 114, 297
Standish, Jr., E. M. 1985, Jet Propulsion Laboratory Memorandum, 314.6 Struve, G. 1928,AJ, 39, 9
V. Robert et al.: USNO astrometric observations of Saturn
Appendix A: Additional tables
Table A.1. Raw statistics of the USNO Saturnian photographic plates that were digitized at the ROB.
Series Opposition Month Emulsion Exp. time (s) Observations
01 1974 2−3 103aG-103aJ 30−90 80 02 1975 1, 3−4 103aG 30−90 78 03 1976 2−3 103aG 30−90 114 04 1977 2−4 103aG 30−60 148 05 1978 3−4 103aG 30−90 63 06 1979 3−4 103aG 21−60 20 07 1980 12 (1979), 1−6 103aG 20−80 129 08 1981 1−3, 5−6 103aG 30−60 66 09 1982 4−6 103aG 30−60 57 10 1983 3−6 103aG 30−63 36 11 1984 4−6 103aG 30−60 54 12 1985 5−8 103aG 30−60 48 13 1986 5−6 103aG 30−60 93 14 1987 6−8 103aG 30−90 57 15 1988 6−8 103aG 30−60 99 16 1989 6−9 103aG 30−90 47 17 1990 7−8, 10 103aG 25−60 30 18 1991 7−10 103aG 30−90 36 19 1992 7, 9−10 103aG 35−80 32 20 1993 7−10 103aG 40−60 54 21 1994 10−11 103aG 30−60 24 22 1996 10 103aG 30−60 27 23 1997 11−12 103aG 30−60 27 24 1998 10 103aG 30 3 Total 1422 A37, page 9 of10
Table A.2. Details of the equatorial mean (O−C)s for Saturn and mean residuals for the satellites, in mas, according to NOE-6-2015-SAT and DE432, DE421, DE200, INPOP08, and VSOP87 ephemerides.
∆α cos δ SEM∆α cos δ σ∆α cos δ ∆δ SEM∆δ σ∆δ
+/− +/− +/− +/− DE432 Saturn 1.0 2.0 63.5 2.2 2.0 64.3 Mimas 2.3 9.3 102.8 −0.9 8.8 97.9 Enceladus 7.5 6.0 101.6 −1.1 5.6 93.8 Tethys 2.4 4.0 79.1 4.1 4.0 78.2 Dione 2.7 3.3 75.5 4.1 3.3 75.6 Rhea 4.0 2.5 72.1 0.8 2.5 72.1 Titan 2.0 2.1 66.6 1.1 2.2 69.0 Hyperion −9.2 21.0 113.1 −0.4 17.0 91.8 Iapetus 8.0 2.8 77.0 −8.8 2.4 67.7 DE421 Saturn 1.0 2.0 63.5 2.1 2.0 64.2 Mimas 2.2 9.3 102.8 −1.0 8.8 97.9 Enceladus 7.5 6.0 101.5 −1.1 5.6 93.7 Tethys 2.3 4.0 79.1 4.0 4.0 78.1 Dione 2.6 3.3 75.5 4.1 3.3 75.6 Rhea 4.0 2.5 72.1 0.7 2.5 72.1 Titan 2.0 2.1 66.6 1.0 2.2 68.9 Hyperion −9.2 21.0 113.0 0.1 17.0 91.6 Iapetus 7.9 2.8 77.0 −8.8 2.4 67.6 DE200 Saturn −131.3 3.0 97.2 23.9 2.3 76.3 Mimas −100.1 9.4 104.4 19.2 8.7 97.0 Enceladus −80.7 6.4 108.9 13.2 5.7 96.2 Tethys −102.0 4.8 94.7 18.5 4.2 82.5 Dione −102.9 4.1 93.0 23.8 3.6 83.2 Rhea −107.4 3.2 94.1 18.6 2.8 82.8 Titan −109.9 2.6 82.3 21.3 2.6 80.5 Hyperion −78.6 23.2 120.8 7.9 19.7 102.3 Iapetus −97.0 3.2 89.9 13.7 2.7 74.7 INPOP08 Saturn 0.9 2.0 63.6 0.9 2.0 64.1 Mimas 2.0 9.3 102.8 −2.5 8.8 98.1 Enceladus 7.3 6.0 101.6 −2.0 5.6 93.8 Tethys 2.2 4.0 79.2 2.8 4.0 78.1 Dione 2.6 3.3 75.6 2.9 3.3 75.5 Rhea 3.9 2.5 72.2 −0.5 2.5 72.0 Titan 1.9 2.1 66.6 −0.3 2.2 68.8 Hyperion −9.3 21.0 112.6 −1.5 17.0 91.3 Iapetus 7.8 2.8 77.0 −9.8 2.4 67.7 VSOP87 Saturn −130.9 2.7 87.1 21.9 2.2 72.7 Mimas −98.4 8.7 96.7 18.7 8.7 96.6 Enceladus −88.5 6.1 103.8 11.9 5.6 94.6 Tethys −111.0 4.6 90.5 16.2 4.1 80.5 Dione −127.6 3.8 86.9 21.3 3.5 80.5 Rhea −110.8 3.0 86.9 17.4 2.7 79.9 Titan −112.2 2.4 75.8 20.2 2.5 77.3 Hyperion −84.7 22.7 118.2 9.4 18.9 98.1 Iapetus −99.5 2.9 81.8 12.0 2.6 71.4