HAL Id: tel-01480310
https://tel.archives-ouvertes.fr/tel-01480310
Submitted on 1 Mar 2017
HAL is a multi-disciplinary open access archive for the deposit and dissemination of sci-entific research documents, whether they are pub-lished or not. The documents may come from teaching and research institutions in France or abroad, or from public or private research centers.
L’archive ouverte pluridisciplinaire HAL, est destinée au dépôt et à la diffusion de documents scientifiques de niveau recherche, publiés ou non, émanant des établissements d’enseignement et de recherche français ou étrangers, des laboratoires publics ou privés.
Summer climate and heatwaves in Europe
Annemiek Stegehuis
To cite this version:
Annemiek Stegehuis. Summer climate and heatwaves in Europe. Biodiversity and Ecology. Université Paris Saclay (COmUE), 2016. English. �NNT : 2016SACLV052�. �tel-01480310�
NTT:2016SACLV052
T
HÈSE DED
OCTORATDE
L
’U
NIVERSITÉP
ARIS-S
ACLAYPRÉPARÉE À
L
’U
NIVERSITÉV
ERSAILLESS
AINT-Q
UENTIN ENY
VELINESE
COLED
OCTORALEN
O. 129
SCIENCES DE L’ENVIRONNEMENT D’ILE-DE-FRANCE
MÉTÉOROLOGIE,OCÉANOGRAPHIE ET PHYSIQUE DE L’ENVIRONNEMENT
PAR
A
NNEMIEK
I
RENE
S
TEGEHUIS
S
UMMER CLIMATE AND
HEATWAVES IN
E
UROPE
THÈSE PRÉSENTÉE ET SOUTENUE AU LSCE,LE 7JUILLET 2016
PhD director : Robert Vautard Directeur de recherche (LSCE/CNRS)
PhD co-director : Philippe Ciais Directeur de recherche (LSCE/CEA)
PhD co-director : Adriaan J. Teuling Assistant Professor (Wageningen University)
President of the jury : Philippe Bousquet Professeur (UVSQ/IPSL)
Reporters : Bart J. J. M. van den Hurk Directeur de recherche (KNMI)
Jesus Fernandez Assistant Professor (Universidad de Cantabria)
Acknowledgments
Merci pour toutes ces belles années !
Contents
Acknowledgments i Contents iii Abstract vii Introduction 1 I General introduction 51 European summer climate . . . 6
1.1 Oceanic influence . . . 6
1.2 Large scale circulation . . . 8
1.2.1 North Atlantic Oscillation . . . 8
1.2.2 Principal summer weather regimes . . . 8
1.2.3 Weather regimes associated with warm summer temperature anomalies . . . 10
1.3 Land-atmosphere interactions influencing the summer climate . . . 10
1.3.1 Soil moisture-temperature feedback . . . 11
1.3.2 Soil moisture-precipitation feedback . . . 12
1.3.3 Regions for strong land-atmosphere feedbacks . . . 13
1.3.4 Influence of vegetation . . . 14
2 Heatwaves . . . 16
2.1 Characteristics of the 2003 heatwave . . . 16
2.2 Mechanisms behind the 2003 heatwave . . . 16
2.3 Consequences of the 2003 heatwave . . . 18
3 Impact of elevated temperatures and drought on vegetation . . . 18
II Uncertainties in the future climate 21 1 Introduction . . . 22
iv CONTENTS
2 The European climate under a 2◦C global warming . . . . 24
2.1 Introduction . . . 24
2.2 Methods . . . 24
2.3 Results and discussion . . . 24
2.3.1 Temperature and precipitation change . . . 24
2.3.2 Land heat fluxes and radiation . . . 26
2.4 Summary and conclusion . . . 27
3 Future European temperature change uncertainties reduced by using land heat flux observations . . . 28
4 Discussion and additional results . . . 33
4.1 Model ensemble . . . 33
4.2 Uncertainty reduction method . . . 33
4.3 The choice for the 2◦C limit . . . 35
5 Summary and conclusions . . . 35
III Atmospheric processes 39 1 Introduction . . . 40
2 WRF model description . . . 41
2.1 Microphysics . . . 41
2.2 Planetary Boundary Layer . . . 42
2.3 Surface Layer . . . 43
2.4 Radiation . . . 43
2.5 Convection . . . 43
2.6 Land surface . . . 44
3 An observation-constrained multi-physics WRF ensemble for simulating Euro-pean mega heat waves . . . 44
4 Discussion and additional results . . . 68
4.1 The importance of the convection scheme . . . 68
4.2 What triggers convection? . . . 70
5 Summary and conclusions . . . 71
IV The influence of soil moisture on summer temperatures 73 1 Introduction . . . 74
2 Methods . . . 75
2.1 Model description . . . 75
2.2 Control simulation . . . 75
2.3 Attribution of temperature anomalies . . . 75
3 Summer warming induced by early summer soil moisture changes in Europe . 77 3.1 Abstract . . . 77
3.2 Main text . . . 77
4 Discussion and conclusions . . . 82
V Drought impacts on European forest species 87 1 Introduction . . . 87
2 Drought and heat stress on 5 main European forest tree species . . . 88
2.1 Picea sp. . . . 88
CONTENTS v
2.3 Fagus sylvatica . . . 93
2.4 Quercus robur & petraea . . . . 95
2.5 Quercus ilex . . . . 96
3 Model description . . . 99
3.1 ORCHIDEE . . . 99
3.2 ORCHIDEE-CAN . . . 100
3.2.1 From PFT to species . . . 100
3.2.2 Carbon allocation and canopy structure . . . 100
3.2.3 Hydraulic architecture . . . 100 4 Results . . . 100 4.1 Puéchabon . . . 101 4.1.1 GPP . . . 101 4.1.2 Soil hydraulics . . . 102 4.1.3 Transpiration . . . 105 4.2 Other sites . . . 106 4.2.1 Brasschaat . . . 107 4.2.2 Tharandt . . . 109
4.2.3 Hesse & Collelongo . . . 110
5 Discussion . . . 111
5.1 Site-specific characteristics . . . 112
5.2 Plant hydraulics . . . 112
5.3 Other processes . . . 112
6 Summary and concluding remarks . . . 114
VI Discussion & concluding remarks 117 1 Climate models in general . . . 118
2 Regarding the future climate . . . 119
3 Impact studies . . . 121
Bibliography 123
Annexes 153
Abstract
Titre: Le climat estival et des vagues de chaleur en Europe
Mots clés: Vagues de chaleur en Europe, Modélisation la méthode, Forets en Europe,
Sécheresse
Résumé:
L'objectif de ce travail de thèse est de contribuer à la compréhension des rôles joués par les interactions sol-atmosphère et par la circulation à grande-échelle dans la formation d’anomalies de températures estivales en Europe. Cela constitue un double défi du fait de la rareté des observations d’une part et des incertitudes liées aux paramétrisations des modèles atmosphériques et de leurs schémas de surface d’autre part. Ce travail est centré sur 4 sujets principaux: 1) Comment les interactions sur les processus sol-atmosphère liés à l’eau du sol disponible pour les plantes et aux flux d’énergie échangés entre la surface et l’atmosphère influencent-elles les projections climatiques de température d’été et leurs incertitudes dans le climat européen? 2) Comment les paramétrisations atmosphériques influencent les simulations des vagues de chaleur extrêmes en Europe? 3) Quelle importance joue l’humidité du sol comparée aux circulations atmosphériques sur les anomalies de température estivales? Et 4) Quels sont les impacts des sécheresses et de la chaleur sur la végétation?
1) Comment les interactions sol-atmosphère
influencent-elles les projections climatiques et leurs incertitudes?
Il existe des incertitudes considérables dans la
simulation du climat actuel en Europe, qui peuvent se propager dans la simulation du climat futur et de sa sensibilité à l’augmentation des forçages anthropiques. Cela soulève plusieurs questions, dont deux sont traitées dans ce chapitre, présentés dans deux parties différentes. Premièrement je discute des incertitudes dans les projections climatiques Européennes pour un échauffement global moyen de 2˚C. Je présente les incertitudes dans le climat futur liée pour différents horizons temporels. Un accent particulier est mis sur les températures estivales et les flux d’énergie échangés entre la surface et l’atmosphère. Cette étude fait partie du projet Européen IMPACT2C et les résultats sont publiés par Vautard et al. (2014). Je ne montre que les résultats du travail personnel accompli dans cette étude. L’article complet se trouve dans l’Annexe A. Deuxièmement j’examine le lien heuristique entre les incertitudes des simulations des flux d’énergie échangés entre la surface et l’atmosphère pour l’actuel et les incertitudes de température dans un climat futur.
Les rétroactions entre surface et atmosphère jouent un rôle important dans la genèse de vagues de chaleur et de sécheresses en l’été dans le climat tempéré en Europe. Cela peut également être analysé dans un ensemble de sorties de
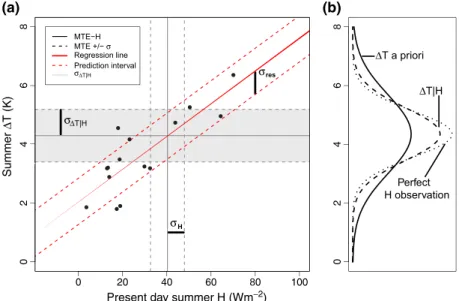
modèles où les rétroactions plus fortes donnent lieu à des températures plus élevées. Stegehuis et al. (2013b) ont montré que, en utilisant un ensemble de modèles, les flux de chaleur sensible les plus importants sont associés à des températures estivales plus élevées (Fig. II.I). Ensuite, nous avons mis en évidence de grandes différences dans la répartition des flux d’énergie échangés entre la surface et l’atmosphère entre différents modèles, ce qui conduit à des incertitudes dans les simulations pour le climat actuel. Cependant, comment ces différences se traduisent en différences pour le climat futur reste mal connu.
Les incertitudes dans des simulations du climat sont mieux représentées dans des ensembles de modèles que dans chaque modèle pris individuellement. Dirmeyer et al. (2006) ont montré que rétroactions entre terre et atmosphère sont relativement mal représentées dans chaque modèle, alors que la moyenne de l’ensemble montre de meilleures performances. Ceci est en partie dû à la rareté des observations spatialement explicites à long terme pour certaines des variables importantes dans les rétroactions entre surface et atmosphère, tels que les flux de chaleur sensible et latente. Récemment, certains produits satellitaires sont devenus disponibles comme GLEAM (Miralles et al. 2011). Un autre produit, basé sur une combinaison de mesures de télédétection et des données de tours à flux du réseau FLUXNET est le ‘Model Tree Ensemble’ de Jung et al. (2010), utilisé dans l’étude présentée au Chapitre 2. Cependant, en utilisant ce type de produit dérivé des observations, on doit toujours garder à l’esprit que les données ont également des incertitudes systématiques. Mueller et al. (2011) ont montré que la dispersion des produits de flux de chaleur latente dérivés d’observations est comparable à celle des flux simulés avec des ensembles de modèles de surface.
En raison de la meilleure représentation des ensembles de modèles par rapport à celle de modèles individuels, plusieurs ensembles de modèles, régionaux et globaux, ont été réalisés par différents groupes de recherche. Un exemple d’un ensemble avec des modèles climatiques régionaux (RCM) européen est celui du projet FP6-ENSEMBLES (Hewitt et al., 2004; Van der Linden et al., 2009). Dans cette étude j’ai utilisé 15 RCMs, conduits par 6 modèles climatiques globaux, du 4ème rapport du GIEC, pour le
scénario A1B.
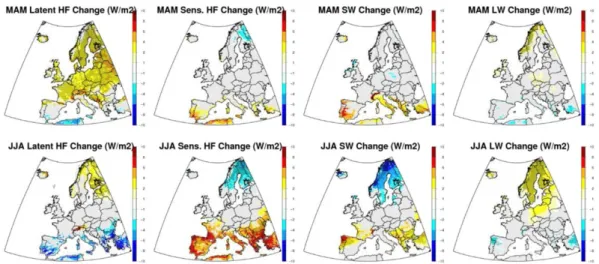
En ce qui concerne la première question posée, nous avons d’abord constaté que les expériences de simulation européennes ont un réchauffement moyen qui est supérieur à la moyenne mondiale, dépassant 2°C au niveau régional. Le réchauffement est le plus grand en Scandinavie, la région méditerranéenne, la péninsule ibérique et les Alpes. Les iles britanniques subissent un réchauffement plus faible. Les flux de chaleur sensible plus élevés confirment ce plus fort réchauffement dans le sud, associé à une diminution des flux de chaleur latente et une augmentation des flux de chaleur sensible dans les régions du sud pendant l’été. Dans la région où le régime d’évapotranspiration est limité par l’énergie (Seneviratne et al., 2010), Scandinavie, les températures plus élevées conduisent à l’augmentation du flux de chaleur latente pendant l’été, alors que le flux de chaleur sensible est diminué. Cela peut être dû à la formation des nuages qui diminue le rayonnement solaire et améliore le rayonnement des ondes longues.
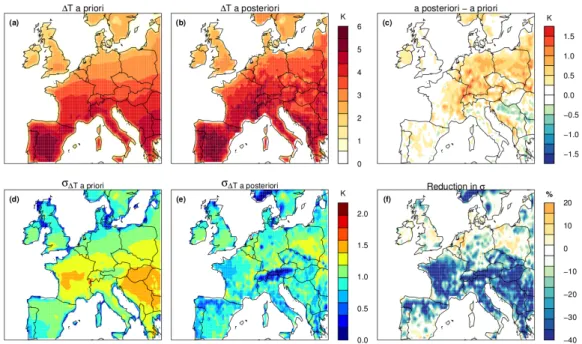
En ce qui concerne la deuxième question posée, utilisant des observations de flux de chaleur sensible de Jung et al. (2009), nous avons pu réduire l’écart inter-modèles des RCMs sur la prédiction du changement de température d’été en Europe jusqu’à 40%. Les réductions d’incertitude les plus importantes ont été trouvé
sur la France et les Balkans, des régions déjà mentionnées pour leur importance des rétroactions entre terre et atmosphère (e.g. Seneviratne et al., 2006a). Dans le sud et le nord de l’Europe, d’autres variables observées pourraient être utilisées pour réduire l’incertitude dans les projections de température, par exemple les rétroactions entre les précipitations et la température (Quesada et al., 2012) ou la rétroaction neige-albédo-température (Hall & Qu, 2006).
2) Dans le chapitre 2 l’accent était mis sur les
rétroactions entre surface et atmosphère dans des simulations de RCMs et leur influence sur les températures estivales futures. Ce chapitre se concentre sur les processus atmosphériques (physique et microphysique des nuages, convection, transfert radiatif) dans un modèle RCM très largement utilisé (WRF) et leurs impacts sur les simulations des températures estivales pendant les vagues de chaleur en Europe. L’objectif principal est d’essayer de répondre à la question de savoir si et comment différentes formulations physiques différentes disponibles pour le modèle WRF influencent la simulation des vagues de chaleurs et l’incertitude des températures d’été en Europe.
Il n’est pas évident à priori que les RCMs peuvent représenter les vagues de chaleur extrêmes dans les régions où les observations sont rares (Perkins et al., 2013). Même si la physique était exactement connue, des incertitudes sont liées au manque de données, par exemple de réseaux d’observations de stations météorologiques. peuvent conduire à une sous-estimation des températures maximales (Halenka et al., 2006), soit trop peu de vagues de chaleurs simulées. Cependant, Vautard et al. (2013) ont constaté que la fréquence et l’amplitude des vagues de chaleur sont souvent surestimées dans les RCMs en Europe, en particulier dans la région méditerranéenne. Toutefois ils ont montré un
grand écart entre les modèles. La source d’une telle surestimation n’est pas évidente. Parmi les différents modèles, le choix d’un jeu de paramétrisations des processus physiques conduit à des résultats différents (Bellprat et al., 2012). Une autre source d’incertitude dans les RCMs peut aussi découler des forçages. En outre, la dynamique créée par les modèles, pourrait être une source de différenciation par la variabilité naturelle chaotique, provoqué par l’instabilité de l’atmosphère (Lorenz, 1963).
Dans une étude sur les phénomènes climatiques extrêmes, Good et al. (2006) ont constaté que les projections des modèles sont nécessairement limitées par des incertitudes, en particulier en raison de la paramétrisation des processus physiques dans les modèles atmosphériques. Des ensembles ‘multi-physiques’ ont été construits pour estimer cette incertitude (Awan et al., 2011). Avec cette approche, un seul modèle est utilisé, mais des physiques différentes sont testées pour trouver les combinaisons les plus réalistes. Bien que cette méthode ne soit pas vraiment nouvelle (Fernandez et al., 2007; Awan et al., 2011 ; Evans et al., 2012, Garcia-Diez et al., 2013 ; Mooney et al., 2013), elle n’a pas encore été utilisée pour analyser les vagues de chaleur. Pourtant, cela peut être d’une grande importance en ce qui concerne leurs conséquences et leur fréquence et gravité plus élevées attendu dans le climat futur de l’Europe.
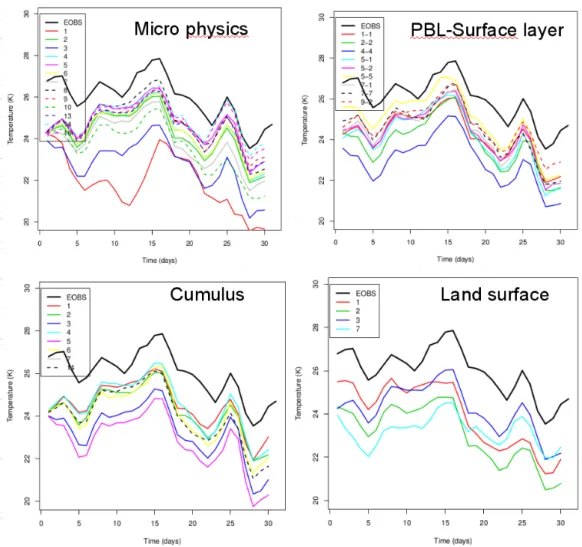
Dans le chapitre 3 j’ai utilisé le modèle ‘Weather and Research Forecast’ (WRF) (Skamarock et al., 2008) et j’ai testé 216 combinaisons différentes de la paramétrisation des processus physiques atmosphériques. Ils se composent de 3 physiques de rayonnement, 4 physiques de convection, 3 microphysiques et 6 physiques de couche limite planétaire. J’ai simulé les vagues de chaleur de 2003 et 2010, et l’été plus humide de 2007. Pour mettre l’accent sur la physique seulement, j’ai guidé les simulations au-dessus
de la couche limite atmosphérique avec des observations. Bien que les interactions surface-atmosphère jouent également un rôle important dans les canicules d’été (voir Chapitre 2), seules les physiques de l’atmosphère ont été testées en raison du choix limité entre différents schémas de surface dans le modèle WRF au moment de l’étude. Les 216 simulations ont été évaluées par rapport à différents jeux d’observations.
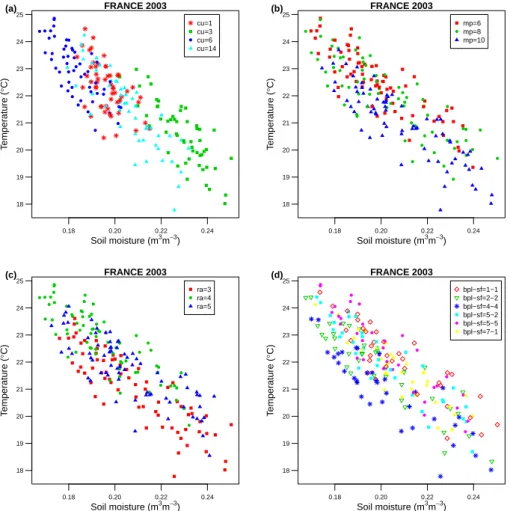
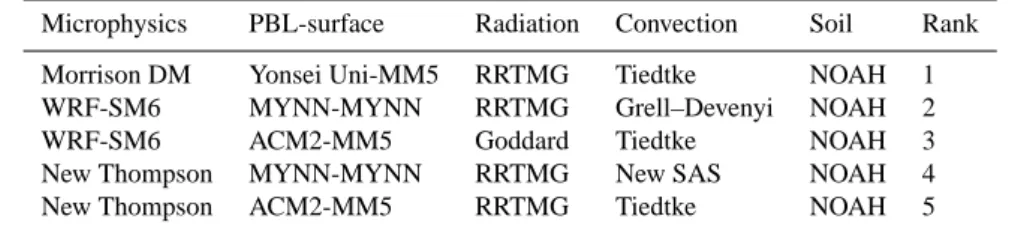
J’ai trouvé un fort écart de la température, la précipitation et le rayonnement simulé avec les observations, même si les simulations ont été guidées. Les différences de température entre modèle et observations étaient localement jusqu’à 10˚C, avec les plus grandes incertitudes en Europe centrale, probablement en raison de représentations différentes des interactions surface-atmosphère (Stegehuis et al., 2013a). Les températures moyennes et maximales ont été systématiquement sous-estimées quelle que soit la paramétrisation des processus physiques atmosphériques utilisée. Les précipitations et le rayonnement solaire incident ont été, la plupart de temps, surestimés. J’ai montré que la convection domine la dispersion de l’ensemble de simulations de WRF avec différentes physiques, probablement en induisant des incertitudes dans les nuages que affectent à la fois l’énergie de surface et le budget de l’eau avant et pendant les vagues de chaleur. Un petit ensemble a été sélectionné, qui produit le meilleur accord avec les données d’observation. Nous suggérons que cet ensemble de configurations pourrait être utilisé pour d’autres recherches sur les vagues de chaleur et les températures estivales en Europe avec le modèle WRF.
3) Les résultats des chapitres 2 et 3 ont permis de
montrer que les températures estivales en Europe sont contrôlées par les interactions surface-atmosphère et par la circulation de l’surface-atmosphère (physique). Pour les vagues de chaleur, la circulation atmosphérique doit favoriser le
transport de l’air chaud vers le continent. Le sol doit favoriser une rétroaction entre la baisse de l’humidité du sol et l’augmentation des températures, à travers la dissipation d’énergie par les flux de chaleur sensible. Bien que des études antérieures ont établi l’importance de ces deux processus (Black et al., 2004 ; Miralles et al., 2014), elles n’ont pas cherché à séparer quantitativement leur contribution individuelle a des anomalies de température d’été pour les vagues de chaleur. Dans cette étude, j’ai choisi d’étudier l’effet de humidité du sol au début de l’été seulement sur la production d’anomalies de température en été, car l’humidité du sol plus tard dans la saison estivale est aussi dépendent de la circulation atmosphérique, donc moins formellement séparable.
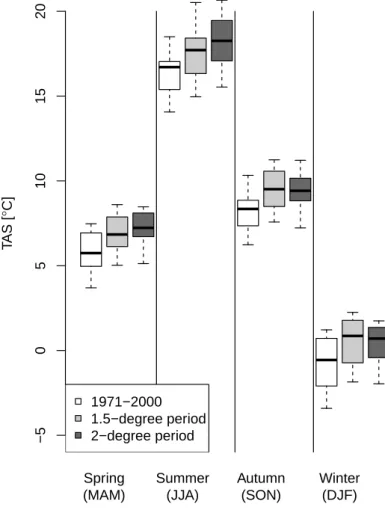
L’augmentation de la température prédite en Europe à la fin de ce siècle est estimée entre 2˚C et 5˚C, selon le scénario et la région (van der Linden & Mitchell, 2009 ; Boberg & Christensen, 2012 ; Stegehuis et al., 2013a). Cette augmentation devrait être plus forte en Europe du Sud (up to 5˚C), que dans la partie nord (Fig. 3, Stegehuis et al., 2013a). En outre, une plus grande variabilité des températures est attendue, notamment en Europe centrale. Cette augmentation globale de la température sur le continent Européen pourrait conduire à plus de dessèchement du sol et plus de variabilité, créant des situations favorables pour des rétroactions positives entre le sol et la température. Une compréhension plus précise, et la quantification du rôle de l’humidité du sol et de ses tendances au cours des dernières années, pourraient donc être critiques dans la compréhension de la variabilité des températures estivales et événements canicule dans le climat futur.
Les régimes de circulation atmosphérique associés au développement des canicules sont les deux régimes de Blocage Atmosphérique et
des différents régimes de circulation ont changé au cours du siècle dernier (Horton et al., 2015 ; Coumou et al., 2015 ; Alvarez-Castro et al., 2016). Bien que l’impact de ces régimes aient été étudiés (van Haren et al., 2015), il y a encore beaucoup d’incertitude quant à savoir si et comment ils peuvent changer dans le climat futur (Cattiaux et al., 2012). Néanmoins, une meilleure compréhension de leur contribution aux vagues de chaleur en été est utile pour prédire le changement climatique.
Dans le chapitre 3, j’avais sélectionné un nombre limité de configurations de paramétrisations des processus physiques atmosphériques dans le RCM WRF qui sont capables de simuler les vagues de chaleur observées de 2003 et 2010, ainsi que l’année d’été relativement humide de 2007. Bien que le chapitre 4 ne traite pas uniquement des vagues de chaleur, ces configurations seront choisies pour créer un ensemble d’étés basés sur différentes initialisations de l’humidité du sol au début de l’été et différents régimes atmosphériques. Toutes ces conditions initiales sont réalistes, comme les valeurs choisies sont celles des années d’été modélisées de 1980-2011.
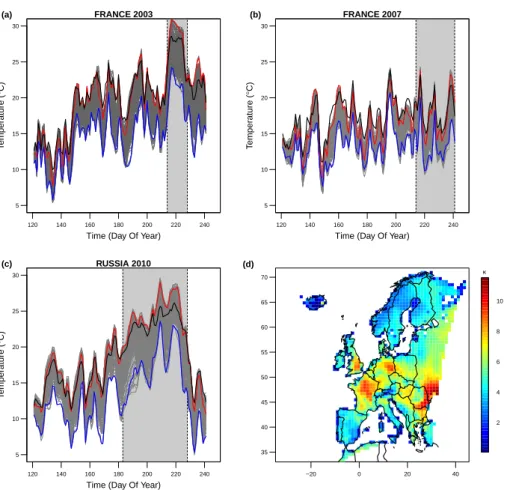
Nous avons constaté que la contribution de l’humidité du sol au début de l’été dans les vagues de chaleur de 2003 et 2010 a été importante et a contribué à environ 1˚C au maximum. Cependant, le conditionnement par le régime de circulation atmosphérique (facteur de grande échelle) explique statistiquement la plus grande partie des anomalies de température, avec une contribution maximum de 3˚C en 2003 et jusqu’à 6˚C en 2010. Un résultat intéressant est que la contribution de l’humidité du sol initiale a augmenté en importance au cours des trois dernières décennies en Europe centrale, en France et dans certaines parties de la Russie, alors que celle des régimes de temps est restée à peu près stable. Ces régions coïncident avec les
régions avec une tendance négative significative de l’humidité du sol dans les simulations du modèle WRF. L’influence des régimes de temps sur les anomalies de température d’été n’a augmenté au cours des trois dernières décennies qu’en l’Europe de l’Est.
4) Dans les chapitres précédents l’accent a été
mis sur le climat de l’été et les vagues de chaleur en Europe, en analysant les processus atmosphériques et les rétroactions surface-atmosphère. Un aspect important dans les rétroactions liées aux processus de surface est la végétation, qui peut soit avoir un effet modérateur ou un effet d’amplification sur les anomalies de température régionales. Ceci dépend en grande partie du type de végétation et sur la disponibilité de l’humidité du sol qui influence l’état de la végétation couplé à l’état de l’atmosphère par les flux de chaleur sensible et latente. L’impact des étés chauds et des vagues de chaleur sur l’état hydrique et le fonctionnement de la végétation est donc un aspect important dans la compréhension du climat, jusqu’ici peu ou pas abordé dans les RCMs qui ont des schémas de surface assez simples (pas de phénologie, pas de physiologie, pas de mortalité ou dépérissement de la végétation).
Les forêts peuvent émettre plus de chaleur latente dans l’atmosphère, et plus longtemps durant les vagues de chaleur, en raison de la profondeur de l’enracinement, et donc un meilleur accès à l’eau souterraine, conduisant à plus d’évapotranspiration que les prairies pendant le développement des vagues de chaleur. L’albédo plus faible des forêts peut en revanche provoquer un effet de réchauffement radiatif (Naudts et al., 2016). L’effet d’albédo semble dominer l’effet de l’évaporation pendant le début des vagues de chaleur (Teuling et al., 2010). Cet équilibre peut cependant être inversé pendant le développement ultérieur des vagues de chaleur ou lorsque la
plupart des arbres ferment leurs stomates à cause du stress hydrique. Pour séparer ces effets, les connaissances sur la réaction de la végétation au cours du stress de l’eau est cruciale.
Pour les effets du climat sur la végétation sur des plus grandes échelles, les modèles de végétation peuvent être utilisés couplés à des modèles atmosphériques. La plupart de ces modèles ne distinguent pas entre des espèces différentes, mais utilisent des ‘groupes fonctionnels’ (PFT). Cependant, une nouvelle version d’ORCHIDEE (Krinner et al., 2005) inclut les caractéristiques des espèces de la plupart des essences d’arbre européennes. Cette version, ORCHIDEE-CAN (Naudts et al., 2015), a en outre une description explicite des potentiels d’eau dans le continuum sol-plante-atmosphère, que peut mieux représenter en principe le stress hydrique des plantes pendant les périodes chaudes et sèches. Dans le chapitre 5, je présente d’abord une revue de littérature sur les effets de la sécheresse et de la chaleur sur le stress hydrique de la végétation. Cette revue est concentrée sur cinq espèces d’arbres en Europe. En outre, je présente des résultats préliminaires de l’évaluation du modèle de la végétation ORCHIDEE-CAN pour simuler la baisse de transpiration et de photosynthèse du couvert végétal pendant des épisodes de sécheresse. Les données d’évaluation sont celles de tours à flux (Baldocchi et al., 1996) pour 5 sites en Europe. Le site sur lequel j’ai essayé de calibrer le modèle ORCHIDEE-CAN pour
Quercus ilex (chêne vert) est celui de Puéchabon,
soumis à un fort stress hydrique du sol au printemps et en été. J’ai montré qu’ORCHIDEE-CAN ne permet pas de simuler la baisse de photosynthèse (GPP) et de transpiration de ce site. La GPP de la végétation est restée trop
élevée pendant l’été, probablement causée par des niveaux d’humidité du sol trop élevé. Par contre, pour les espèces tempérées Fagus
sylvatica, Picea sp., Pinus sylvestris et Quercus robur et petraea la simulation de GPP a été
beaucoup mieux représenté, bien que ces espèces n’aient pas subi beaucoup de stress hydriques pendant les années observées. Certains processus à l’échelle de l’arbre ou du couvert ne sont pas représentés dans le modèle de la végétation, ce qui peut entrainer des différences entre la production primaire modélisé et observé.
Pour simuler l’impact du stress hydrique sur la végétation de l’augmentation prévue de la fréquence et de la gravité des vagues de chaleur, certaines adaptations du modèle que ORCHIDEE-CAN doivent être apportées. Tout d’abord, les processus spécifiques qui agissent le plus fortement en période de sécheresse doivent être ajoutés. Un exemple est la résistance entre le sol et la racine. Outre ces processus spécifiques à la sécheresse, il serait également nécessaire d’introduire des effets décalés. La perte de conductivité (hydraulic failure) n’est pas reproduite par ORCHIDEE-CAN pour le moment. En réalité, la mortalité des arbres peut se produire même plusieurs années après un événement de sécheresse extrême. Une solution relativement simple serait d’ajouter une forme de mortalité lorsque l’embolie devient trop importante, si ce processus peut être reproduit dans le modèle utilisé. Le temps n’a pas permis de déboucher sur un résultat finalisé, c’est à dire une version satisfaisante d’ORCHIDEE-CAN capable de reproduire la baisse de potentiel hydrique du sol, et celle des différents organes de la plante.
Title: Summer climate and heatwaves in Europe
Keywords: Heatwaves, Europe, Modeling, Forest, Summer climate
Abstract:
Through this work I aimed to improve the understanding of the role of land-atmosphere feedbacks and large-scale circulation that lead to warm summer temperatures in Europe. This is challenging due to the scarcity of observations and the uncertainties of parameterized atmospheric processes. I focused on four main issues: 1) How do land-atmosphere feedbacks affect climate projections and their uncertainties? 2) How do different physical parameterizations affect the simulation of extreme heatwaves? 3) How large are the roles of soil moisture and atmospheric circulation in the development of European summer temperature anomalies? And 4) What are the impacts of heat and drought stress on vegetation?
Regarding the first question I found that the different partitioning of land heat fluxes between models leads to spatially different warming over Europe in the future. The uncertainty of future climate change was especially high in central Europe, largely due to the uncertainty in heat flux partitioning, while in Southern Europe the models mostly agreed. The use of observation-based sensible heat fluxes allowed to reduce this climate change uncertainty regionally up to 40%. While studying different atmospheric parameterizations for the extreme heatwaves of 2003 and 2010, I found a large temperature spread between the simulations. Compared to observations, temperature was mostly underestimated. Shortwave radiation and precipitation were generally overestimated. I selected a reduced model ensemble of well
performing configurations compared to observations, to perform future studies on warm summer temperatures over Europe.
The best physics configuration was consequently used to quantify the role of early summer soil moisture and large-scale drivers on summer temperature anomalies. The contribution of soil moisture was up to maximum 1ºC during the heatwaves of 2003 and 2010. The contribution of large-scale drivers was larger, reaching up to 3ºC in 2003 and up to 6ºC in 2010. However, the contribution of early summer soil moisture to the temperature anomalies has been increasing over the last decades over parts of central Europe and Russia, corresponding to the regions with a significant negative trend of soil moisture. Large-scale drivers showed an increasing importance in the Eastern European region.
Lastly, I studied the impacts of drought and heat stress on several European forest tree species. I found an overestimation of modeled GPP at a local scale in the Mediterranean region during summer with ORCHIDEE. This indicates that the vegetation model does not well reproduce the complicated consequences of drought stress. To model future, possibly more severe impacts of drought, the model may need to be adapted with drought-specific processes and lagged effects.
Introduction
The European summer climate is characterized by a large variability, both in space and time. Although our understanding of this climate variability has been increasing, some im-portant questions are still unanswered. One example is the question of whether European summer conditions can be predicted in advance, over time periods of weeks or even decades. Such a prediction could bring enormous benefits in many different sectors, but requires de-tailed and precise knowledge on underlying mechanisms. Local observations are adequate for understanding processes at local scales. However, some of the processes and feedbacks occur at larger regional or continental scales for which models may be a more suitable tool.
The first numerical climate models only calculated the large-scale circulation patterns on a global scale. Nowadays climate models exist on both regional and global scale and con-tain numerous routines and parameterizations to describe the current state of the land and the atmosphere. Their increasing complexity and resolution are advantageous in that more processes can be described, but the uncertainty of these processes might lead to error com-pensations, which may lead to ’the right temperature for the wrong reason’. Such model deficiencies often become apparent when looking at interannual variability. This is problem-atic in current-climate simulations, but might be even more of an issue for the simulation of the future climate, as interannual variability is expected to increase (Schär et al., 2004).
The last decades have shown extreme examples out of the historical range of variability, in the form of extreme warm and dry summers such as in 2003 in Western Europe and in 2010 in Russia (Luterbacher et al., 2004; Barriopedro et al., 2011). While warm weather does bring advantages, these events were characterized by high financial costs, increased mortality rates and decreased ecosystem productivity (Ciais et al., 2005; García-Herrera et al., 2010).
The importance of the ability of models to correctly simulate interannual variability and extreme events such as heatwaves has not been recognized for some time, and there was more focus on obtaining the right climatology. Now both our knowledge on climatic processes and computing capacity have increased, more effort has been invested in the representation of the above mentioned issues, especially after the two heatwave episodes.
Two processes central for European heatwaves are large-scale atmospheric circulation and land-atmosphere coupling on a local to regional scale. Warm dry air imported from Eastern or Southern Europe has the potential to reduce precipitation and increase clear sky conditions. This increases evaporative demand resulting in enhanced soil drying. Reduced soil moisture alters the partitioning of land heat fluxes and favors sensible over latent heat flux which can result in a positive feedback loop promoting high temperatures. However, large-scale observations of the most important variables of these processes, such as soil moisture and land heat fluxes, are scarce. This limits their precise understanding and thus the simulation of heatwave events.
Through this work, I aim to improve the understanding of the role of land-atmosphere feedbacks and large-scale circulation that lead to warm summer temperatures in Europe. This is challenging due to the scarcity of observations and the uncertainties of parameterized atmospheric processes. I will first focus on some important variables of the energy budget and land-atmosphere feedbacks, and study how these, and their uncertainties, affect climate projections. A second step is to evaluate different models to simulate the extreme heatwaves we have witnessed in 2003 in Europe and 2010 in Russia. I will pay special attention to different atmospheric physics to find the uncertainty that physical formulations can induce. After the evaluation of the models, I will study the specific mechanisms leading to higher summer temperatures, with a direct focus on soil moisture legacy effects and atmospheric circulation patterns and try to separate their importance.
An important part of land-atmosphere feedbacks during summer is the vegetation cover-ing the land surface. It can either have an amplifycover-ing or a moderatcover-ing effect on the climate, depending largely on the availability of soil moisture which influences the status of the veg-etation, and the vegetation type. Forests were found to have an amplifying effect on high temperatures at the beginning of a heatwave, while grasslands have a moderating effect (Teuling et al., 2010). The lower albedo and evapotranspiration rates of forest were respon-sible for these differences. On longer time scales however, this effect may be reversed due to the higher capacity of trees to store water and extract it from the soil. To better understand the influence of vegetation on climate, we also need to study how climate influences vege-tation. Here too, models are a very suitable tool for investigating the impacts of climate on vegetation as the processes involved can act over large scales.
A large uncertainty from the modeling of forests is upscaling of processes from single trees and leaves to whole forest ecosystems. In addition, not all processes on leaf level might be known, inducing more uncertainty. A start to answer the full question about the impact of future heatwaves is the evaluation of vegetation models on the simulation of current sum-mer stress. I will use a recently developed vegetation model with a specific description of water potentials in the soil-plant-atmosphere continuum, and asses its capability to simulate summer stress at different sites in Europe. This model could then be used to upscale to the whole European region. Besides this first/limited model assessment, I will discuss different drought-affected processes on tree-level described in the literature.
To summarize, the research questions addressed in this work are:
1) How do the important land-atmosphere processes in regional climate models lead to different summer temperatures? How do their uncertainties affect future summer temper-atures predictions? And how can present-day observations be used to reduce a part of the
CONTENTS 3
uncertainty in these temperature projections?
2) Can current regional climate models correctly simulate heatwaves in Europe? How do different atmospheric parameterizations influence the simulation of heatwaves? And can we design a model ensemble that can correctly simulate European heatwaves?
3) How large is the role of atmospheric circulation and soil moisture feedbacks in the development of European summer temperatures? Can we quantify and separate their impor-tance? And is the importance of land-atmosphere feedbacks becoming more important?
4) Can a state of the art vegetation model correctly simulate summer stress in forests? What are some of the missing processes? And can the model simulate extreme stresses as have been experienced in 2003, with a focus on green oak ecosystems in the Mediterranean region?
CHAPTER
I
General introduction
6 CHAPTER I. GENERAL INTRODUCTION
1
European summer climate
Europe can be separated in broadly four climatic zones: a boreal climate in the north, a Mediterranean climate in the south, a continental climate in the central east and a mar-itime or oceanic climate central west. In the Alps and the Pyrenees some regions have an alpine climate. These different climates are characterized by different annual and seasonal temperature and precipitation values. The Mediterranean climate has hot and dry summers but milder and wet winters (Fig. I.1). The former is partially due to the sinking air from the Hadley cells, whilst the latter is partially caused by the Mediterranean Sea that moderates the temperatures during the winter and storms that form over the Atlantic Ocean. The maritime or oceanic temperate climate in Europe is characterized by warm summers and mild winters (Fig. I.1). The annual temperature range is relatively small as it is moderated by the relative warm water from the ocean North Atlantic drift. Precipitation occurs the whole year round. The continental climate of Eastern Europe has warm to hot summers and cold winters (Fig. I.1). Most winter precipitation falls in the form of snow. The attenuating effect of the Atlantic Ocean does not apply in this part of Europe. The boreal climate is characterized by long and cold winters while the summers are short and cool. Winter temperatures can drop to -40◦C. The average summer temperature is approximately 10◦C (Fig. I.1). Precipitation is usually low. To better understand model processes and the different drivers for interannual summer variability, it is important to identify these different climatic zones and to understand what drives the differences between the varying temperatures.
In the next sections I will discuss the influences of the Atlantic Ocean and large-scale cir-culation on the European summer climate. This is followed by a section on land-atmosphere feedbacks and their importance on the summer climate. Heatwaves will be discussed in sec-tion 1.2, and the last part is a concise descripsec-tion on the influence of summer climate on vegetation.
Besides the influences of the ocean and land-atmosphere feedbacks, the land itself can also play a role in the local or regional climate. For example, at high altitudes in mountainous areas the climate is colder even in low latitudes. Snow albedo feedbacks can play a role here. Furthermore, a difference between a north- or south-facing slope can cause a significant difference in local temperatures. Orography also has an influence on precipitation. As air is pushed up against a mountain slope, it loses heat with altitude and might precipitate mostly on one side of the mountain, while the other side remains much drier throughout the year. This however, will not be discussed in further detail.
1.1 Oceanic influence
The ocean generally has a moderating effect on the European climate through the north-ward transport of warm tropical water by the thermohaline circulation and the Gulf Stream. Besides these currents, the Atlantic Multidecadal Oscillation (AMO) also exerts an influence. This is a mode of variability of sea surface temperatures (SST) in the North Atlantic, which is detrended for climate change. The AMO is characterized by cold and warm phases, with a cool phase from 1905 to 1925 and from 1965 to 1990 and a warm phase between 1931-1960 (Sutton and Hodson, 2005). Besides its effects on the winter weather, Sutton and Hodson (2005) have shown its influence on Europe’s summer climate. They found that dur-ing the warm phases, a relatively low pressure area is formed west of the British Isles. This
1. EUROPEAN SUMMER CLIMATE 7 Winter (a) Summer (b) −5 0 5 10 15 20 25 C Winter (a) Summer (b) 0 1 2 3 4 5 mm
Figure I.1: European winter and summer climatology. a) DJF temperature; b) JJA temper-ature; c) DJF precipitation; and d) JJA precipitation. Data is from E-OBS (Haylock et al., 2008).
8 CHAPTER I. GENERAL INTRODUCTION
is linked with reduced precipitation over Western Europe and increased temperatures over central Europe (Sutton and Hodson, 2005). Confirming these result, Mariotti and Dell’Aquila (2012) find a positive correlation between the AMO index and air temperature patterns that is, besides over Western Europe, extending over the Mediterranean during summer. However, these temperature differences might also be related to dimming and brightening as described by Wild et al. (2005).
1.2 Large scale circulation
1.2.1 North Atlantic Oscillation
The variability of the European climate is strongly influenced by large scale atmospheric patterns. The main mode of variability over Europe and the North Atlantic Ocean is the North Atlantic Oscillation (NAO). This index is based on the average difference in surface sea-level pressure between the Icelandic low and the Subtropical (Azores) High, describing the largest fluctuations of the North Atlantic flow. It has a large influence on Europe especially during the winter. The positive phase of the NAO (NAO+) is characterized by a strengthening of both the
Icelandic low and the Azores High. This pattern increases the strength of westerlies, trans-porting humid and relatively warm air towards Northern Europe and generating warmer and more humid winter weather than normal in temperate Northern Europe (Bladé et al., 2012; Gimeno et al., 2003). In contrary, Southern Europe experiences drier winters. During sum-mer, this region experiences drought conditions due to reduced precipitation in the preceding months (López-Moreno and Vicente-Serrano, 2008). As a result, Roig et al. (2009) was able to link tree-ring width with NAO indices in the Iberian Peninsula. Also Gouveia et al. (2008) found reduced vegetation activity after a winter characterized by NAO+in Southern Europe.
Another consequence of the reduced winter and spring precipitation in Southern Europe is a possible enhancement of land-atmosphere coupling, that may favor even drier conditions due to different positive feedback loops (further discussed in section 3.3) (Wang et al., 2011).
During the negative phase of the NAO (NAO−), the westerlies are reduced and an opposite effect on the weather is observed over Europe. Mediterranean winters are wetter and warmer than average, while in Northern Europe it is drier and colder. The extreme cold weather in March 2013 was characterized by NAO−. Opposite from the NAO+, the NAO− reduces
precipitation over northern Europe, causing summers to be drier on average (López-Moreno and Vicente-Serrano, 2008). The NAO index however, is based on the data of a few stations only (Lisbon, the Azores or Gibraltar and Reykjavik), and might therefore not observe all movement of the action centers entirely (Roig et al., 2009).
1.2.2 Principal summer weather regimes
During the summer, the main atmospheric weather regimes or circulation patterns are studied in detail by Cassou et al. (2005). They revealed four main states of the atmosphere by analyzing the geopotential height anomalies at 500 hPa (Fig. I.2). Both the NAO+ and
NAO− patterns were observed together with the Atlantic Low and the Atlantic Ridge. The Atlantic Low exhibits a negative pressure anomaly above the North Atlantic Ocean and a weak positive anomaly above Europe. The Atlantic ridge is characterized by a negative anomaly above Scandinavia and Greenland, while an anticyclonic pattern is located over the North
1. EUROPEAN SUMMER CLIMATE 9
Figure I.2: (a-d) Four main atmospheric circulation patterns over the North Atlantic-European sector from 1950 to 2003 at Z500 (m). The figure is taken from Cassou et al. (2005).
10 CHAPTER I. GENERAL INTRODUCTION
Atlantic Ocean east from Western Europe. Only Blocking and the Atlantic Low will be further discussed, as they are associated with warm European summer temperatures.
1.2.3 Weather regimes associated with warm summer temperature anomalies
1.2.3.1 Blocking One of the two patterns associated with exceptional warm weather in Europe summers is a Blocking pattern. The anticyclonic conditions over northern Europe, associated with Atmospheric Blocking, transports air from the east into Europe. This air has had sufficient time over land to warm up, and therefore transports warmer air especially into central and northern Europe. Because of the strength of the positive pressure anomaly, local convective instabilities are suppressed, diminishing wind strengths and increasing drought and cloudless skies even more (Cassou et al., 2005). Warm and dry conditions are especially found over the British Isles, central Europe and a part of the Baltic (Linderholm et al., 2009; Bladé et al., 2012). In the Mediterranean region this circulation pattern has less effect because the high pressures zone is too far north (Bladé et al., 2012; Mariotti and Dell’Aquila, 2012). However, on general wetter conditions can be found (Linderholm et al., 2009). The extreme heatwave in August 2003 and exceptionally warm July 2013 were characterized with an atmospheric Blocking pattern.
1.2.3.2 Atlantic Low The Atlantic Low is the second pattern that has been related with warm summer temperatures and heatwaves in Europe. It has most influence over the south-ern regions. Warm air from northsouth-ern Africa and the Mediterranean basin is transported north-wards (Cassou et al., 2005). The recent extreme hot summer in southern Europe of 2015 is characterized by an Atlantic Low pressure regime.
1.3 Land-atmosphere interactions influencing the summer climate
The influence the land surface has on climate is mostly through the effect of soil moisture controlling the partitioning of the land heat fluxes. Wet soils have the potential for evapora-tion and high evaporative fracevapora-tions (ratio of latent heat flux to net radiaevapora-tion), while sensible heat flux dominates over dry soils. Budyko defined two evapotranspiration regimes; a soil moisture limited and an energy limited regime (Fig. I.3). In the former regime, enough energy is available for evapotranspiration but due to a dry soil, there is very limited wa-ter accessible for latent heat flux. This regime prevails in the Mediwa-terranean region during summer. In the energy limited regime however, soil moisture is plenty while the energy to evaporate the moisture is limited. This situation occurs in Northern Europe. Both regimes are quite stable and the land surface has very limited ability to influence the atmosphere (Schär et al., 1999; Seneviratne et al., 2010). In between these regions both an energy- or a soil moisture limited situation can be found, where wet soils may lead to increased evapotranspi-ration and relative low temperatures, whilst dry soils might favor higher temperatures with less precipitation. This can lead to the large interannual summer variability found in Europe. The coming two sections (I.3.1 and I.3.2) describe soil moisture-temperature feedbacks and soil moisture-precipitation feedbacks in more detail. This is followed by a section where regions of strong land-atmosphere coupling are discussed. I.3.4 describes the role of vegeta-tion in land-atmosphere feedbacks.
1. EUROPEAN SUMMER CLIMATE 11
EF=λE/Rn
Soil moisture content
θWILT θCRIT
0
DRY TRANSITIONAL WET
SOIL MOISTURE LIMITED ENERGY LIMITED
EFmax
Figure I.3: Definition evapotranspiration regimes. This definition follow the framework de-scribed in section I.3. EF denotes the evaporative fraction, and EFmax its maximal value. The dotted lines indicate possible pathways, as changes in EF are not necessarily linear. Adapted from Seneviratne et al. (2010).
1.3.1 Soil moisture-temperature feedback
Soil moisture has the potential to influence temperature through the partitioning of land heat fluxes in latent, sensible and ground heat flux. The latter accounts only for a very small percentage and does not exert a strong influence on air temperature. The two remaining heat fluxes can affect temperature through multiple positive and negative feedback loops.
A very direct consequence of enhanced sensible heat flux is its immediate effect on tem-perature. Besides that, a lower Bowen ratio due to drier soils leads to a drier atmosphere and reduced cloudiness increasing the net radiation. Intensified radiation and a drier atmosphere raise the atmospheric demand and consequently induce more evapotranspiration and even drier soils. A reduced convection may furthermore lead to a development of anticyclonic circulation conditions in the upper air (Zampieri et al., 2009). Also, in the beginning of a warm period, when soil moisture is still available, an increased atmospheric demand and an increased latent heat flux may lead to more relative humidity and thus a stabilizing situation. The positive feedback loops described above act mostly non-linearly, and a higher impacts of soil moisture on temperatures are found during dry conditions on temperature maxima (or a decrease of temperatures with initial wetter soil conditions) (Jaeger and Seneviratne, 2011). Ford and Quiring (2014) and Mueller and Seneviratne (2012) find similar results in that soil moisture has most impact on extreme warm temperatures. The latter find a higher probability on hot days after dry soil conditions, e.g. > 70% in the Iberian Peninsula, South America and Eastern Australia; > 60% in most of North US and Eastern Europe, while it decreased till < 30-40% after wet soil conditions. Quesada et al. (2012) and Hirschi et al. (2011) find similar results from observations over Europe, and Lorenz et al. (2015) find a stronger impact for soil moisture variability on the warmest temperatures.
During the 2003 heatwave a positive coupling between soil moisture and temperature is found through reduced evaporation, a drier atmosphere and reduced cloud cover by Stéfanon et al. (2014). They find that this feedback contributed up to 20% of the extreme tempera-tures in Eastern France and Western Germany, while its contribution reached up to 40% over Western France and Northern Spain. However, although these processes can account for an important part to the temperature anomalies during the hot summer of 2003, the authors note that the initial cause of the extreme event was a Blocking situation over Europe.
12 CHAPTER I. GENERAL INTRODUCTION
While these feedbacks are mostly local and on shorter time scales, non-local impacts with longer timescales are also possible. A well described mechanism is the impact of reduced winter and spring precipitation in southern European on elevated summer temperatures in Europe (Vautard et al., 2007; Zampieri et al., 2009; Quesada et al., 2012). A probable under-lying process is the local inhibition of convective cloud formation and increased sensible heat flux due to reduced precipitation. These warm and dry air masses can be advected over cen-tral Europe due to southerly flows. The reduced cloudiness associated with these air masses increases atmospheric demand of soil moisture, reducing the water reservoir, enhancing sen-sible heat flux and higher temperatures (Zampieri et al., 2009).
A negative feedback loop can occur when latent heat flux is favored over sensible heat flux by wetter initial soils. This might occur when temperatures start rising in the beginning of the summer. The higher temperatures increase latent heat flux, which leads to an increased atmospheric humidity. This in turn enhances cloud formation by lowering the dew point, leading to reduced net radiation and decreased temperatures, reduced atmospheric demand and thus relatively more soil moisture. The soil albedo may also play a role as it usually bears higher values with a lower soil humidity. With an increase in longwave radiation due to dry and warm soil, they can lead to a reduction of net radiation and consequently lower temperatures (Eltahir, 1998). A last negative coupling may be through a destabilization of the atmosphere due to very strong thermal activity. This can result in cloud formation when the PBL reaches the lifting condensation level (Boé, 2013).
1.3.2 Soil moisture-precipitation feedback
Soil moisture can influence precipitation in different ways. The most direct mechanism might be moisture recycling, in which regional evaporated soil moisture contributes to pre-cipitation. Comparing different studies Eltahir and Bras (1996) find that 10% of the precipi-tation may be derived from regional recycled water over Eurasia, while in the tropics this can be 25%-60% (Spracklen et al., 2012). Two important processes that determine the magnitude that soil moisture has on precipitation are: 1) the amount of soil moisture that is evaporated; and 2) the amount of evaporation that is precipitated. While the former is relatively easy to measure, the latter is harder to quantify. It is mostly considered that the effect of soil moisture on evaporation is larger than the effect of evaporation on precipitation (Wei and Dirmeyer, 2012; Boé, 2013). Another direct mechanism is the influence of soil moisture on the inten-sity of precipitation. Lorenz et al. (2015) showed that in mid-latitudes, and especially in the Mediterranean, soil moisture variability increases heavy precipitation events both in amount of rainfall and in duration.
Besides this direct soil moisture-precipitation feedback, three indirect feedbacks have been described through the modification of soil moisture on boundary layer stability and on the potential for convective precipitation by Schär et al. (1999). 1) Starting with dry soils, an increase of the Bowen ratio and a deepening of the daytime PBL is expected. This causes an increased entrainment of dry air. The changes in PBL and entrainment together induce a decrease in the density of water vapor and in the moist static energy (MSE) that can lead to reduced potential for convective rainfall. 2) An increase of longwave radiation due to dry soils and an increase in albedo induces a decrease in net radiation. This decreases the total turbulent energy flux transferred to the PBL that decreases the MSE. The decrease in MSE in a deeper PBL with increased entrainment causes again a reduced potential for convective
1. EUROPEAN SUMMER CLIMATE 13
precipitation (Schär et al., 1999). 3) The level of free convection decreases due to dry soils, also stabilizing the atmosphere and reducing the potential for convective rainfall. These processes remain positive feedback mechanisms when starting with wet soils instead of the dry case examples, thus enhancing the potential for convective precipitation (Schär et al., 1999).
The indirect mechanisms have been subject of many modeling and observational studies. Findell et al. (2011); Guillod et al. (2014) found for example that previous wetter conditions enhance the probability of afternoon rainfall in Mexico and eastern US. In central and south-western US however, where a soil moisture limited regime prevails, soil moisture is the driver for positive feedbacks on precipitation. Rios-Entenza and Miguez-Macho (2014) find a large impact of evapotranspiration on precipitation in the Iberian Peninsula, especially when there is the potential for convection. The feedback mechanisms are thus also dependent on large-scale circulation patterns (Ford et al., 2015a; Guillod et al., 2015; Boé, 2013). Soil moisture may exert an influence on the persistence of certain large-scale circulation patterns, however, this has so far only been demonstrated for SST anomalies (Guemas et al., 2010).
Some studies also mention negative feedbacks mechanisms between soil moisture and precipitation. Boé (2013) find a weak but negative feedback during warm conditions with a Blocking pattern. They assign this to a destabilization of the atmosphere over drier soils. Likewise Taylor et al. (2011); Taylor (2015); Ford et al. (2015b); Guillod et al. (2015) find that convective precipitation initiation has a preference over dry soils. During the 2003 heat-wave many studies have investigated the soil moisture-temperature feedbacks, but Zaitchik et al. (2006) studied the soil moisture-precipitation feedback in detail during this event. They find evidence for a negative feedback due to a reduced local production of MSE (the second indirect mechanism) only during April.
Non-local feedback also occur, where the advection of evaporated soil moisture affects neighboring regions Beljaars et al. (1996); Rowntree and Bolton (1983). The latter found that moister or drier air was advected from central Europe into Scandinavia and from south-ern Europe into North Africa. This has also been shown to occur for soil moisture-temperature coupling during hot European summers, where reduced southern European precipitation dur-ing winter and sprdur-ing induces warmer conditions over Europe (Zampieri et al., 2009). While there is substantial evidence for soil moisture-precipitation feedbacks, precaution has to be taken with the interpretation of results. Different observation-based data sets and different convection parameterizations in climate models can change the sign and the magnitude of the feedbacks (Hohenegger et al., 2009; Guillod et al., 2014).
1.3.3 Regions for strong land-atmosphere feedbacks
Regions of strong soil moisture-temperature and -precipitation feedbacks, as discussed in the previous sections, have been studied extensively in the Global Land-Atmosphere Coupling Experiment (GLACE) (Koster et al., 2004). These so called ’hot spots’ are mostly identified for their strong feedbacks between soil moisture and precipitation. Although when soil moisture has a substantial influence on precipitation and thus on the atmosphere, we can assume that it is similar for temperature.
Simulations with varying and climatologically prescribed soil moisture performed with an AGCM ensemble (GLACE), showed that strongest land-atmosphere feedback strength was
14 CHAPTER I. GENERAL INTRODUCTION
over the Great Plains in Northern US, the Sahel, equatorial Africa and India. Less coupling strength was found over parts of the Amazon, Eastern China and some parts over Russia and Canada. Using GCMs over Europe Koster et al. (2004) did not find land-atmosphere coupling strength, besides a very small region north of Portugal and around Poland. Using the absolute values of precipitation instead of its natural logarithm, as was done in Koster et al. (2004), Koster et al. (2006) found that hot spots occurred with a very similar pattern but with a decreased magnitude, indicating some form of robustness. Using only the eight best perform-ing models for summer precipitation, they found that the magnitude of couplperform-ing with soil moisture increased in most areas, including a small region in South-East Europe. With these same eight models, Seneviratne et al. (2006a) obtained an estimate of seasonal forecasting potential by combining the coupling strength with soil moisture memory. While the coupling strength is not enormously high, some hot spots in Europe appear: in the Mediterranean regions, the southern part of France and in Eastern Europe around the Danube. Including more detailed analysis on the surface heat fluxes, Dirmeyer (2011) found positive coupling over almost the entire Mediterranean area, while there is a negative coupling over Northern Europe and over the Alps. The latter is probably related to late snow melt.
Using a regional climate model over Europe, Seneviratne et al. (2006b) found different feedback hot spots than were found by Koster et al. (2006). While Koster et al. (2006) did not find any sign of strong land-atmosphere coupling over Europe, Seneviratne et al. (2006b) find that in the present climate strong coupling is found over the Mediterranean region, which is more similar to Dirmeyer (2011), although the regions found by the latter is extended more west-ward. They assign the changes to the different models, a different spatial resolution and a different representation of SSTs. In the future the coupling hot spots might change. These ’new’ hot spots might occur more north and east-ward, extending over central and Eastern Europe (Seneviratne et al., 2006b).
The difference in coupling strength between the separate models is mostly caused by the different sensitivities of evaporation rate to soil moisture. Models with a stronger correlation between these variables show stronger feedback strength (Guo et al., 2006). The ensemble model mean of the coupling strength is shown to be fairly well simulated (Dirmeyer et al., 2006). However, interpretations of single models must be done with care, because their skill in correctly simulating the relation between land and atmosphere is limited. Comparing certain model variables such as latent heat flux and surface soil moisture with observations, Dirmeyer et al. (2006) find large biases.
1.3.4 Influence of vegetation
A very clear example of vegetation-atmosphere feedbacks is the work of Aleina et al. (2013). They model a world starting with different vegetation fractions and different initial deep soil moisture conditions. They find three stable equilibria: a warm desert without veg-etation, a cold desert with little vegetation and a temperate vegetated state. The vegetated state can only be reached when starting with a sufficient initial vegetation fraction and suf-ficient initial deep soil moisture. Whenever the initial vegetation fraction is too small, the generated water cycle is not strong enough to maintain the vegetation, and thus the water cycle, alive (Aleina et al., 2013). This extreme case is very unlikely to happen on a global scale, but it illustrates the importance of impact of vegetation on the water cycle on longer time scales. Some ecosystems seem to have multiple alternative stable states, and the loss
1. EUROPEAN SUMMER CLIMATE 15
of only a small fraction of vegetation may shift the system from a vegetated to a desert state (Scheffer et al., 2001). This is also shown by some modeling studies (Wang and Eltahir, 2000; Baudena et al., 2008).
Other feedback mechanisms between vegetation and atmosphere occur on much shorter time-, and smaller spatial-scales. A well-studied topic is the difference between forests and croplands in their effects on temperature. Intuitively forests may seem to better moderate temperatures, but in reality this is not always the case (Teuling et al., 2010). Two processes that can explain differences between the two vegetation types are the albedo and evapotran-spiration. While evapotranspiration is mostly found to have a mitigating effect on temper-ature, as explained in section I.1.3.1, the lower albedo of forests might increase local and regional temperatures (Teuling et al., 2010).
Stéfanon et al. (2012) presented the mitigating effect of evapotranspiration in June 2003, which was increased due to enhanced spring greening. During August however, the vege-tation stress and early leaf fall reduced evapotranspiration, thereby increasing sensible over latent heat flux and amplifying the already above average temperatures Lorenz et al. (2013). Detto et al. (2006) found similar mitigating results for Sardinia, where the natural woody vegetation evaporated more and longer during drought periods than grasses. Vegetation is also found to enhance evapotranspiration and accordingly the water cycle in the semi-arid regions of Northern China (Jiang and Liang, 2013). Although the enhanced evapotranspi-ration may have a moderating effect on temperature, the faster depletion of the soil water reservoir (Zhang and Schilling, 2006) may lead to enhanced sensible heat flux during long-term droughts. Although Baudena et al. (2008) find that natural vegetation can balance these effects through the adaptation to lower soil moisture.
The negative effect of albedo is especially pronounced over the boreal regions, where a decrease in albedo occurs by forests that cover the snow layer. This induces a rise in tem-perature (Snyder and Liess, 2014; Bonan, 2008). Furthermore, forests usually have a lower albedo than grass or crop land, retaining more sunlight energy that also increases the tem-perature (Jackson et al., 2008; Naudts et al., 2016). This effect is also found by Teuling et al. (2010) during the heatwave of 2003. The air temperature over grasslands was found to be cooler than over forests due to a lower Bowen ratio. However, the different rooting depths between trees and grasses or crops may inverse these effects during periods of prolonged drought.
Other than the non-local effects found for both soil temperature and soil moisture-precipitation feedbacks, the effects of the biosphere on the atmosphere seem to be only local (Pitman et al., 2009). Also Lorenz et al. (2013) found that vegetation only has a minor effect on mean spring and summer climate in Europe.
In the future, reforestation has the potential to reduce global warming till approximately 2050. Increased CO2 concentrations can cause an increase in leaf area index which enhances
evapotranspiration. However, at the end of the 21st century the cooling by evapotranspiration becomes less important due to CO2fertilization (Pitman and Narisma, 2005). Similar results
are found over central Europe by Wramneby et al. (2010), although in Southern Europe increased droughts may limit plant growth, reducing evapotranspiration and consequently increase temperatures. Vilà-Guerau De Arellano et al. (2012) emphasizes the CO2fertilization
16 CHAPTER I. GENERAL INTRODUCTION
formation.
2
Heatwaves
The processes described in the previous sections lead to interannual and seasonal variabil-ity and extreme events such as heatwaves. While definitions vary, heatwaves are usually de-scribed as prolonged periods of extreme high temperatures relative to the usual weather. The World Meteorological Organization defines a heatwave as a period of at least five consecutive days with a daily maximum temperature that exceeds the average maximum temperature of the period 1961-1990 by 5◦C.
Although all heatwaves are characterized by above normal temperatures, they differ tem-porally and spatially. Consequently it is impossible to describe one mechanism that describes all heatwaves. For this reason I will discuss the recent 2003 European heatwave as an il-lustrative example, describe its characteristics, possible mechanisms and consequences. This specific heatwave is selected as it is very well described in literature and because of the vary-ing processes that resulted to the anomalous hot temperatures.
2.1 Characteristics of the 2003 heatwave
The European heatwave in 2003 broke many temperature records, both in June and Au-gust. Exceptionally warm periods with daily maxima well over 40◦C were marked across Spain and Portugal, 36-38◦C over Southern and central France and 32-36◦C over Northern France (García-Herrera et al., 2010). The monthly average of temperature anomalies were +2◦C, +4.2◦C, +2◦C and +3.8◦C from May to August, respectively (Black et al., 2004). The temperature anomaly of early August was up to 8.5◦C (Zaitchik et al., 2006). The summer mean exceeded the climatological mean by approximately 3◦C in some regions,
correspond-ing to five standard deviations (Schär et al., 2004). Most exceptional temperatures were recorded in France and Switzerland (Black et al., 2004), with 40-60 hot days, which is 5 to 6 times the long term average (Fischer et al., 2007a). The rareness of the temperatures over Switzerland are shown in their very long return period of 46 000 year (Schär et al., 2004). This summer was likely the warmest in the last 500 years (Luterbacher et al., 2004).
2.2 Mechanisms behind the 2003 heatwave
The main mechanisms of the heatwave were the winter and spring precipitation deficit, an atmospheric Blocking pattern which caused anticyclonic conditions, warm SSTs and land-atmosphere interactions. Teleconnections are also mentioned in several studies, but will not be discussed in detail. For a comprehensive overview I refer to García-Herrera et al. (2010).
Precipitation deficit Over large parts of Europe, the average precipitation was more than 50% lower in the preceding winter and spring months compared with the long-term av-erage (Fischer et al., 2007a). This deficit probably amplified the evolution of the temperature anomalies during spring and summer (Loew et al., 2009). The cause of the anomalous rainfall might have been anomalous 500 hPa geopotential heights (García-Herrera et al., 2010).