Correlations to Cathode Surface Activity and Stability
The MIT Faculty has made this article openly available. Please share
how this access benefits you. Your story matters.
Citation Cai, Zhuhua, Markus Kubicek, Jürgen Fleig, and Bilge Yildiz. “ Chemical Heterogeneities on La 0.6 Sr 0.4 CoO 3−δ Thin Films— Correlations to Cathode Surface Activity and Stability .” Chemistry of Materials 24, no. 6 (March 27, 2012): 1116–1127.
As Published http://dx.doi.org/10.1021/cm203501u Publisher American Chemical Society (ACS)
Version Author's final manuscript
Citable link http://hdl.handle.net/1721.1/86171
Terms of Use Article is made available in accordance with the publisher's policy and may be subject to US copyright law. Please refer to the publisher's site for terms of use.
Chemical Heterogeneities on La0.6Sr0.4CoO3-δ Thin Films -
Correlations to Cathode Surface Activity and Stability
Journal: Chemistry of Materials Manuscript ID: cm-2011-03501u.R1 Manuscript Type: Article
Date Submitted by the
Author: 29-Jan-2012
Complete List of Authors: Cai, Zhuhua; Massachusetts Institute of Technology,
Kubicek, Markus; Vienna University of Technology, Institute of Chemical Technologies and Analytics
Fleig, Jőrgen; Vienna University of Technology, Institute of Chemical Technologies and Analytics
Yildiz, Bilge; Massachusetts Institute of Technology, Department of Nuclear Science and Engineering
Chemical Heterogeneities on La
0.6Sr
0.4CoO
3-δThin Films -
Correlations to Cathode Surface Activity and Stability
Zhuhua Cai1, Markus Kubicek2, Jürgen Fleig2 and Bilge Yildiz1*
1. Laboratory for Electrochemical Interfaces, Department of Nuclear Science and Engineering, Massachusetts Institute of Technology, 77 Massachusetts Avenue, Cambridge, MA 02139, USA
2. Institute of Chemical Technologies and Analytics, Vienna University of Technology, Getreidemarkt 9, 1060 Vienna, Austria
Keywords: La0.6Sr0.4CoO3-δ, Surface Segregation, Phase Separation, Cathode Activity
Abstract
La0.6Sr0.4CoO3-δ (LSC) thin film cathodes synthesized by pulsed laser deposition at 450 C (LSC_450C) and 650 C (LSC_650C) exhibit different electrochemical performance. The origin of the differences in the oxygen reduction activity and stability of these cathodes is investigated on the basis of their surface chemistry and their surface atomic and electronic structure. Angle resolved X-ray Photoelectron Spectroscopy and Nanoprobe Auger Electron Spectroscopy are used to identify the surface cation content, chemical bonding environment, and the spatial heterogeneities with nanoscale resolution. The higher electrochemical activity of LSC_450C is attributed to the more stoichiometric cation content on the surface and the more uniform lateral and depth distribution of constituent cations. The poorly crystalline atomic structure of the LSC_450C was found to prohibit the extensive segregation and phase separation on the surface because of the more favorable elastic and electrostatic interactions of Sr in the bulk. Upon annealing in air at 600C, the surface of the LSC_650C undergoes a structural change from a Sr-rich LSC state to an SrO/Sr(OH)2-rich phase-separated state. The
partial blockage of the surface with the heterogeneously distributed SrO/Sr(OH)2-rich phases, 3 4 5 6 7 8 9 10 11 12 13 14 15 16 17 18 19 20 21 22 23 24 25 26 27 28 29 30 31 32 33 34 35 36 37 38 39 40 41 42 43 44 45 46 47 48 49 50 51 52 53 54 55 56 57 58 59 60
the decrease in oxygen vacancy content, and the deterioration of the electron transfer properties as evidenced from the Co oxidation state near the surface are found responsible for the severe electrochemical deactivation of the LSC_650C. These results are important for advancing our ability to tailor the electrochemical performance of solid oxide fuel cell cathodes by understanding the relation of surface chemistry and structure to the oxygen reduction activity and stability, and the dependence of cation segregation on its driving forces including material microstructure.
Corresponding author email: [email protected]
1. Introduction
Attaining highly active cathode surfaces in oxygen reduction kinetics is a necessary enabler for efficient and durable functionality of solid oxide fuel cells at reduced temperatures (from above 800 C to 700-500 C). Strontium doped lanthanum cobaltite, La1-xSrxCoO3-δ, has been studied widely as a promising candidate for cathode materials1-4 for this purpose. On
the basis of electrochemical and surface chemical studies on model dense thin film electrodes, oxygen reduction reaction (ORR) kinetics5-7 on strontium doped lanthanum cobaltite is
generally agreed to be limited by the surface exchange process.8-11 Januschewsky et al.
recently reported pulsed laser deposited (PLD) LSC thin film cathodes on yttria-stabilized zirconia (YSZ) that are very highly active to ORR at 600C when deposited at low temperatures of 340-510 C.12 These poorly crystalline amorphous-like films show a much better ORR activity compared to the crystalline LSC films that were deposited at the more conventional and elevated temperatures (of nearly 630 C) in PLD. Furthermore, these LSC thin film cathodes that are grown at lower temperatures are significantly more stable than the high temperature-grown ones that show severe degradation of electrochemical kinetics during
3 4 5 6 7 8 9 10 11 12 13 14 15 16 17 18 19 20 21 22 23 24 25 26 27 28 29 30 31 32 33 34 35 36 37 38 39 40 41 42 43 44 45 46 47 48 49 50 51 52 53 54 55 56 57 58 59 60
surface exchange reactions on LSC, a likely mechanism for the superior activity of the low-temperature-deposited LSC films is the existence of a more favorable surface structure or chemistry. By using secondary ion mass spectrometry (SIMS) and inductively coupled plasma optical emission spectrometry (ICP-OES), Kubicek et al 13 has shown that the surface cation
chemistries of the LSC films, especially their Sr content, differ as a function of the deposition temperature. It is also deduced recently from ICP-OES measurements that the films deposited at the lower tempeartures have nano-porosity (likely due to their poorly crystalline nature) at a scale not clearly visible by scanning electron microscopy. However, the relation of the cation chemistry, binding environment and surface structure to the electrochemical activity and stability of these LSC thin film cathodes has not yet been defined in a complete form. In addition to the Sr-content, it is important to understand the structure of the LSC surfaces with varying levels of Sr because the ORR activity of the surface can directly depend on the atomic structure that a given cation composition exists in.14 As a follow-on work to reference 13, this
paper presents new findings on: i) the effects of the synthesis and annealing temperatures and oxygen pressure on the surface cation chemistry of LSC thin films, ii) the possible atomic structures that these surface chemistries exist in, iii) the atomic-level mechanisms that drive the varying levels of cation segregation on the surfaces, and iv) the relation of the resulting surface chemistry and structure to the electrochemical activity and stability.
The activation and deactivation of the ORR kinetics can be in general described by the inherent electronic structure on a defect-free cathode surface.15,16 However, surface chemistry
of the SOFC cathodes is complex, associated with an anion sublattice and two cation sublattices, and the oxygen vacancies also play an important role on the surface activity. Furthermore, the surface is not static, the corresponding structure and surface chemistry (i.e. cation concentration and oxygen nonstoichiometry) are driven dynamically by the surrounding chemical environment, temperature and oxygen partial pressure (Po2).17-24 For
example, on the surface of La1-xSrxMnO3, a widely studied perovskite type oxide cathode, the 3 4 5 6 7 8 9 10 11 12 13 14 15 16 17 18 19 20 21 22 23 24 25 26 27 28 29 30 31 32 33 34 35 36 37 38 39 40 41 42 43 44 45 46 47 48 49 50 51 52 53 54 55 56 57 58 59 60
concentration of Sr dopant cation was shown to increase with decreasing Po217and increasing
temperature (> 500C),18 and the electron transfer ease (measured by tunneling conductance on the surface) was found to decrease with increasing Sr.18 On another well-studied
perovskite, SrTiO3, the surface composition and structure was drastically altered in both
oxidizing (800-1000C, 200 Torr O2) and reducing conditions (1000C, 10-8 Torr O2) in comparison with the original stoichiometric surfaces.25 Cation segregation is observed also on
oxide systems other than perovskite oxides, such as the fluorite structured gadolina doped ceria and yttria stabilized zirconia.26-31 These results in general have to be interpreted in terms
of cation segregation, which in some cases are initiated on the perovskite lattice by simply replacing La with Sr to a larger extent than the bulk nominal Sr content. In other cases, this is followed by solid-state reactions at elevated temperatures, which cause the formation of new chemical phases on the surface that can also influence the region beneath.
In general, a unified theory that explains the origin of cation segregation on these complex oxide systems does not yet exist. However, the possible driving forces of segregation originate from the elastic and chemical interactions of the dopant with the surrounding lattice, the latter including electrostatic and polarization effects. The specific mechanisms that manifest these interactions are related to: i) the size mismatch between the dopant and host cations and the related elastic energy minimization by pushing the dopant to free surfaces or interfaces,32-35 ii) the space-charge theory that predicts the existence of interfacial segregation
even without an ionic size mismatch36 predominantly due to electrostatics, and iii) the point
defect interactions, such as the strong association of oxygen vacancies and dopant cations, which can drive the dopants to interfaces where vacancies are in abundance.27 Regardless of
the specific driving mechanism, the segregating cation has to diffuse to the energetically preferred interface. Therefore, segregation is kinetically feasible at relatively high temperatures where the cation mobility is significant. This point is of importance to the LSC 3 4 5 6 7 8 9 10 11 12 13 14 15 16 17 18 19 20 21 22 23 24 25 26 27 28 29 30 31 32 33 34 35 36 37 38 39 40 41 42 43 44 45 46 47 48 49 50 51 52 53 54 55 56 57 58 59 60
thin films that are deposited at the lower temperatures in this work, as will be discussed later in the Results and Discussion.
Upon Sr segregation on perovskite surfaces, as on LSC, the surface can evolve and form different atomic structures. In the simplest case, Sr replaces La on the surface17,37 while
retaining a perovskite-terminated structure. Surface phase separations in the form of a separated oxide layer of SrO,22,38 and Ruddlesden Popper phases, for example (La,Sr)2MnO4
on (La,Sr)MnO339 are also possible. The nucleation and growth of these three general forms
of Sr-enriched phases are driven by the thermodynamic conditions of temperature and oxygen pressure. The activation or deactivation of ORR kinetics has most often been connected to the Sr-enriched surface “composition”, but not to the “structure” that the Sr enrichment can exist in. Furthermore, the transitions between such possible surface phases and their impact on the surface activity have not been shown directly and consistently. For example, even on the same electrode composition, La0.6Sr0.4Co0.8Fe0.2O3-δ, some studies have reported that the
surface Sr species can block active surface sites,40 while others reported that the surface Sr
enrichment due to cathodic polarization can activate the ORR kinetics.9 Jiang et al21,22
proposed that the SrO-enriched surfaces of (La,Sr)MnO3 (LSM) blocks the ORR activity, but
the cathodic polarization can dissolve the segregated SrO species back into the lattice and enhance the oxygen dissociative adsorption on LSM surface. Contrary to this argument, Wagner et al 41 reported a strong enhancement of the oxygen surface exchange rate on both
undoped and Fe-doped SrTiO3 single crystals coated with alkaline earth oxide (CaO, SrO,
BaO) surface layers with physical vapor deposition. Mutoro et al 42 also demonstrated that a
small amount of secondary phase containing SrO deposited (not inherently segregated) onto LSC film surfaces can activate the electrode. However, the physical origin behind these empirical observations is not understood. It is clear from the motivating evidence summarized above that the structure of surface Sr segregation, not only the composition, on cathodes is important in determining the ORR activity; however this is still an open question.
3 4 5 6 7 8 9 10 11 12 13 14 15 16 17 18 19 20 21 22 23 24 25 26 27 28 29 30 31 32 33 34 35 36 37 38 39 40 41 42 43 44 45 46 47 48 49 50 51 52 53 54 55 56 57 58 59 60
In this paper, the aim is to uncover the origin of the differences in the LSC electrode activity and stability induced by the synthesis and annealing temperatures. For this purpose, we systematically assessed the segregation of constituent cations, their bonding environments and the heterogeneities of the surface microstructure and microchemistry arising from the cation segregation. The information on the cation bonding states and the surface microstructure may connect the segregation to particular phase changes on the surface. Angle resolved x-ray photoelectron spectroscopy was used for identifying the cation chemistry with a depth resolution from the surface. The lateral spatial distribution of cations on the nanoscale was investigated using nanoprobe Auger electron spectroscopy. A clear correlation of the cation segregation levels, Sr bonding environments, and surface microstructures to the electrochemical activity and stability has been revealed. The inherent atomic structure of the LSC films was found to strongly affect the cation segregation tendencies near the surfaces. A structural change of the surface due to SrO/Sr(OH)2-rich phase separation and the
accompanying degradation of the LSC film defect chemistry and electronic structure near the surface were found responsible for the significant electrochemical deactivation of the LSC electrodes over time at elevated temperatures.
2. Experimental
The LSC films were deposited on single-crystalline (100)-oriented 5mm×5mm×0.5mm YSZ substrates (9.5 mol% Y2O3, CrysTech GmbH, Germany) by pulsed laser deposition
(PLD) with 50 ns laser pulses supplied by an excimer laser (Lambda Physics, COMPexPro 201) working at 248 nm and a pulse frequency of 5 Hz.12,13 The provided fluence on the target
surface was about 1.5 J cm-2, which resulted in a deposition rate of about 3.6 nm/min. A
constant flow of oxygen was provided during the deposition at an oxygen pressure of 0.4 3 4 5 6 7 8 9 10 11 12 13 14 15 16 17 18 19 20 21 22 23 24 25 26 27 28 29 30 31 32 33 34 35 36 37 38 39 40 41 42 43 44 45 46 47 48 49 50 51 52 53 54 55 56 57 58 59 60
mbar. In this work, the measurements were performed on 200 nm thick LSC films grown at 450C and at 650C, hereafter denoted as the LSC_450C and the LSC_650C, respectively. The bulk composition of these films was measured by ICP-OES, and was found very close to the nominal values (fractions of La, Sr and Co as ~0.3, 0.2, and 0.5).13
A Veeco/Digital Instrument Nanoscope IV was used to perform tapping mode atomic force microscopy (AFM) for characterizing the surface morphology. A Physical Electronics Model 700 Scanning Nanoprobe Auger Electron Spectroscopy (NAES) is used to identify the surface cation content with the ability to detect lateral heterogeneities in cation compositions with high spatial resolution. Incident electrons of 10 keV and 10 nA were used for both SEM imaging and the Auger electron excitation. The La MNN, Sr LMM, and Co LMM Auger emissions were measured for quantifying the surface cation composition of the LSC films. The smoothing and differentiation of the AES spectra collected were carried out using the Savitsky–Golay algorithm.38 Quantification of the AES differential spectra is performed using
peak-to-peak intensities of the tight-scans of the noted emissions from the constituent cations. The sampling depth of these AES electrons are ~ 8.0 nm for Sr LMM, ~ 4.0 nm for La MNN, and ~ 4.5 nm for Co LMM. We used the standard sensitivity factors for the chemical quantification with AES, and the sensitivity factors for these emissions in the LSC films may vary from the provided standards. Therefore, rather than the absolute values of the surface chemical content, the qualitative trends should be taken into account in our AES results as a function of deposition and annealing temperatures.
Angle resolved X-ray Photoelectron Spectroscopy (XPS) is used to identify the cation chemistries with near-surface depth resolution on LSC films as a function of growth temperature and annealing time. The Omicron EA 125 hemispherical analyzer and Omicron DAR 400 Mg/Al dual anode non-monochromated X-ray source were used for XPS measurements. The Sr 3d, La 4d, La 3d and Co 2p photoelectron were analyzed. CasaXPS 2.3.15 software was used for spectral analysis and compositional quantification, Mg K- x-3 4 5 6 7 8 9 10 11 12 13 14 15 16 17 18 19 20 21 22 23 24 25 26 27 28 29 30 31 32 33 34 35 36 37 38 39 40 41 42 43 44 45 46 47 48 49 50 51 52 53 54 55 56 57 58 59 60
ray (1253.6 eV) operated at 300 W was used in the XPS measurements reported here. While most samples were examined in their as-deposited or as-annealed conditions, when we attempted to compare the association of Sr with carbon and with the Co oxidation state on the surface, the carbon contamination was removed from the surfaces of the air-exposed LSC films prior to the analysis. This was done by heating the samples in oxygen pressure of 5×10⁻⁵
mbar at 400 C for 1.5 hours in the UHV chamber. A resolution of ~ 1.0 eV at full width at half-maximum (FWHM) is attained. For the excitation energy of 1253.6 eV, the sampling depths of these photoelectrons at normal emission are ~ 6 nm for Sr 3d and La 4d, ~ 3 nm for La 3d and ~ 3 nm for Co 2p.43 The ratio of Sr/(Sr+La) was computed using the Sr 3d and La
4d emissions, La/Co was computed using the La 3d and Co 2p emissions, and both of these ratios were then used to compute the (Sr+La)/Co. By using photoelectrons with similar attenuation depths in the calculation of Sr/(Sr+La) and La/Co, possible quantitative errors caused by different attenuation depths was minimized. These spectra were measured at different emission angles, 0, 60 and 80, between the sample surface normal and the detector position. The measurements at larger emission angles are more surface sensitive than those at the small angles. At 60, approximately 65% of the Sr 3d and La 4d signals, 90% of the La 3d signal, and 85% of the Co 2p signal emanate from the top 1 nm from the surface of the LSC films. To deduce differences in the chemical binding environment on LSC surfaces as a function of synthesis temperature and annealing time, the Sr 3d, La 4d, and Co 2p spectra were analyzed. Because the dominant segregating species was found to be Sr, particular attention was given to the analysis of the Sr 3d photoelectron spectrum.
3 4 5 6 7 8 9 10 11 12 13 14 15 16 17 18 19 20 21 22 23 24 25 26 27 28 29 30 31 32 33 34 35 36 37 38 39 40 41 42 43 44 45 46 47 48 49 50 51 52 53 54 55 56 57 58 59 60
3. Results
3.1 Surface microstructure of the as-prepared LSC films
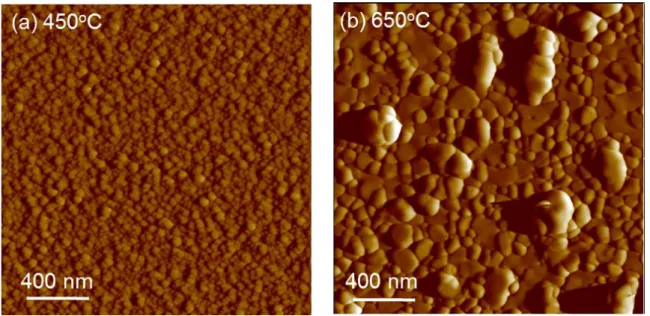
The LSC film morphology depends on the PLD growth temperature as shown in the AFM images of the LSC_450C and the LSC_650C (Figure 1). An evident observation is the increase of grain size from 450°C to 650°C on the basis of nucleation theory.44 The
microstructure of the LSC_650C films is non-uniform. The root-mean square roughnesses of these two films increase from 1.5 ± 0.3 nm on LSC_450°C to 6.0 ± 1.2 nm on LSC_650°C with some protruding grains on the film. We will show in the next section that the surface chemistry of both the LSC_450C and the LSC_650C are actually uniform despite the non-uniform microstructure of the as-prepared LSC_650C surface.
Figure 1. Atomic force microscopy images of (a) LSC_450C with a smooth and uniform
microstructure, and (b) LSC_650C with varying sizes and shapes of grains on the surface.
3.2 Surface cation chemistry of the as-prepared LSC films
The major difference in the surface chemistry of the LSC films as a function of their deposition temperature is the varying levels of Sr content on/near their surfaces. As shown in 3 4 5 6 7 8 9 10 11 12 13 14 15 16 17 18 19 20 21 22 23 24 25 26 27 28 29 30 31 32 33 34 35 36 37 38 39 40 41 42 43 44 45 46 47 48 49 50 51 52 53 54 55 56 57 58 59 60
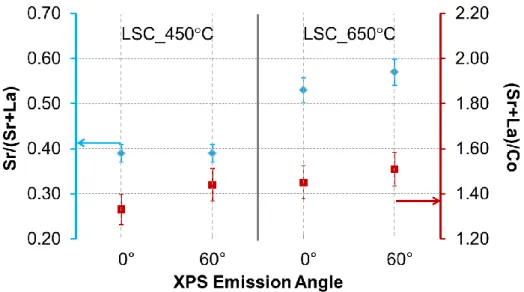
Figure 2, on LSC_450C, the Sr/(La+Sr) ratio is close to the bulk nominal value of 0.4, while for the LSC_650C, it is about 0.55. This ratio is higher than nominal, suggesting Sr enrichment on the LSC_650C surface. Furthermore, as seen from the angle resolved analysis of Sr/(Sr+La) from 0 to 60, the LSC_450C has a uniform Sr distribution as a function of depth in the near-surface region. LSC_650C, on the other hand, has more Sr enrichment on the surface, with an evident increase of Sr/(Sr+La) from 0 to 60. However, both films have A-site rich surfaces with a (Sr+La)/Co of 1.45-1.50 at emission angle of 60, suggesting a mixed termination of A- and B-site cations on the surfaces. Since the bulk composition of these films was confirmed to be very close to the nominal values,13 the surface compositions
found by XPS to be rich in A-site cations are related to inherent surface segregation and are not an artifact of film growth by PLD. These values of (Sr+La)/Co greater than 1.0 (as an average from the near surface region of the XPS sampling depth) can be interpreted as the presense of site enrichment, i.e. a mixed and B-site termination but with more of the A-site termination, on the very top surface of both LSC_450C and LSC_650C. However, we can’t completely ignore XPS quantification errors even though we minimized such errors by using photoelectrons with similar attenuation depths in the calculation of Sr/(Sr+La) and La/Co. Therefore, it is important to focus on the relative differences of these ratios between the samples and on how they each evolve with annealing conditions rather than on their absolute values. 3 4 5 6 7 8 9 10 11 12 13 14 15 16 17 18 19 20 21 22 23 24 25 26 27 28 29 30 31 32 33 34 35 36 37 38 39 40 41 42 43 44 45 46 47 48 49 50 51 52 53 54 55 56 57 58 59 60
Figure 2. Sr/(Sr+La) and (Sr+La)/Co ratios on LSC_450 ºC and LSC_650 ºC, deduced from
the x-ray photoelectron spectroscopy measurements at the emission angles of 0 and 60.
The La 3d, La 4d and Co 2p spectra exhibited almost the same signature on LSC_450C and LSC_650C at different emission angles, suggesting similar chemical bonding states of La and Co in these two samples (see Figure S1 of supporting information). However, Sr 3d spectra showed evident differences as a function of emission angle on LSC_650C. Because the dominant segregating species is Sr on the as-prepared state of the LSC_650C films, particular attention was given to the analysis of the Sr 3d photoelectron spectrum in the rest of this paper. The Sr 3d peak was deconvoluted to two main contributions. The Sr 3d doublet separation and the area ratio were constrained to 1.7 eV and 1:0.66, respectively. The contributions to the Sr 3d photoelectron spectrum were found to arise from the perovskite lattice-bound Sr (Srlattice) at the lower binding energies (131.6 eV ± 0.2 eV for 3d5/2 and 133.3
± 0.2 eV for 3d3/2), and from the surface-bound Sr (Srsurface) at the higher binding energies
(133.6 eV ± 0.2 eV for 3d5/2 and 135.3 ± 0.2 eV for 3d3/2). Srsurface is attributed to the Sr
chemical environment on the surface of the LSC films because of its growing contribution at larger emission angles (shown in Figure 3). The FWHM varied from 1.3 eV for the Srlattice to
2.0 eV for Srsurface. We turn our attention to the chemical environment of Srsurface on the Sr-3 4 5 6 7 8 9 10 11 12 13 14 15 16 17 18 19 20 21 22 23 24 25 26 27 28 29 30 31 32 33 34 35 36 37 38 39 40 41 42 43 44 45 46 47 48 49 50 51 52 53 54 55 56 57 58 59 60
enriched surfaces of the LSC films, and assess whether this Srsurface could be attributed to the
formation of species such as SrCO3, SrO, and Sr(OH)2.45-47
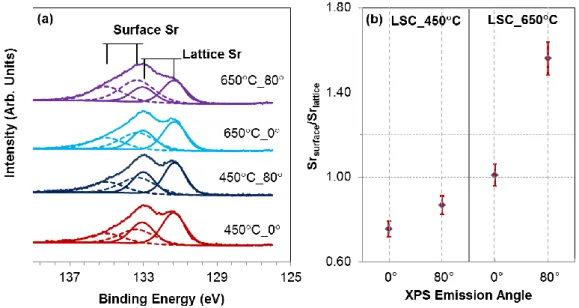
Figure 3. (a) Sr 3d region of the photoelectron spectra, and (b) the Srsurface/Srlattice ratio on the
LSC_450C and LSC_650C at emission angles of 0 and 80. The Sr 3d spectra in (a) are normalized to show the same highest intensity.
As shown in Figure 3a, the LSC_450C and the LSC_650C films exhibited different characteristics in the Sr 3d photoelectron spectra. There is almost no carbon (less than 2%) left on the surface after cleaning the samples in the analysis chamber, while the Srsurface
intensity constitutes a large fraction of the total Sr signal. The lack of a –CO3 binding
environment in the C 1s spectra is shown in the supporting information (Figure S2). Therefore, the Srsurface in this state of the LSC films cannot originate mainly from SrCO3. Furthermore,
the Sr in the SrO structure and Sr in LSC lattice have very similar binding energies,46 beyond
the resolution limit of this experiment configuration. Therefore, the Srsurface is most likely
originating from Sr(OH)2-like bindingenvironment (i.e. Sr-OH) that may form either on the
Sr of the perovskite lattice or on the Sr of a separated SrO phase, or from the formation of the Sr(OH)2 phase from SrO. In all three cases the bonding environment includes a Sr-OH 3 4 5 6 7 8 9 10 11 12 13 14 15 16 17 18 19 20 21 22 23 24 25 26 27 28 29 30 31 32 33 34 35 36 37 38 39 40 41 42 43 44 45 46 47 48 49 50 51 52 53 54 55 56 57 58 59 60
signature (Presence of the –OH signature is also shown in the O 1s spectra in Figure S2). Even though LSC_450C surface is stoichiometric in Sr/(Sr+La), the existence of Srsurface on LSC_450C suggests the reactive nature of LSC surface with water to form Sr-OH bonds as in the Sr(OH)2 species. Given that the (Sr+La)/Co on both the LSC_450C and LSC_650C surfaces is 1.45-1.5, and a particle-free surface microstructure, we believe the Srsurface related
to Sr(OH)2 species is predominantly on a perovskite lattice on the as-prepared states of these
LSC films. The Srsurface component of the Sr 3d exists to a larger extent on the LSC_650C film surface (Srsurface/Srlattice = 1.56) compared to that on LSC_450C (Srsurface/Srlattice = 0.87) (Figure 3b), and increases with increased emission angles on LSC_650C. On the other hand, the emission angle dependence of the Srsurface/Srlattice on LSC_450C is much smaller. The enhanced presence of the Srsurface on LSC_650C is consistent with the enhanced amount of Sr segregation on the surface (Figure 2) driven by the growth temperature. Later we will see that the relative contribution of this Srsurface component can also be used to deduce separation of
SrO-rich phases upon annealing of the LSC films.
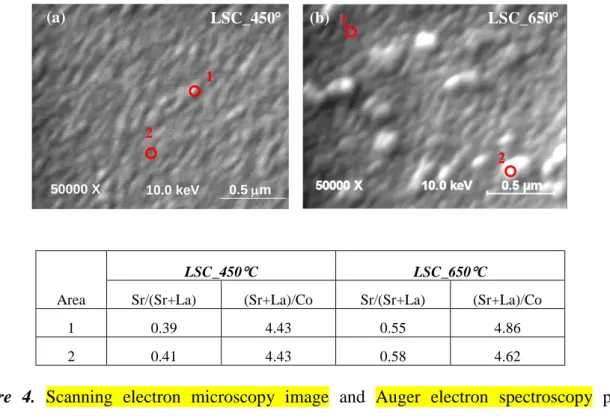
The depth resolution of the XPS analysis was complemented by the lateral resolution of our AES analysis to deduce whether any chemical heterogeneity is present on the surfaces of both LSC_450C and LSC_650C in their as-prepared states. AES nano-probe analysis was performed on 5-6 different regions on each sample. As exemplified in Figure 4, both film surfaces were found to have spatially uniform distribution of the constituent cations in their as-prepared states. The Sr/(La+Sr) from AES point analysis is ~0.4 on LSC_450C, close to its bulk nominal, and is around 0.55 on LSC_650C. These ratios are both consistent with the corresponding XPS analysis. The high (Sr+La)/Co values of 4-5 should only be considered in a qualitative comparison between the samples as a function of processing conditions because of the uncertainty of sensitivity factors used in this quatification. Instead, the (Sr+La)/Co from XPS are quantitatively more representative of the native surface because of the consistency of 3 4 5 6 7 8 9 10 11 12 13 14 15 16 17 18 19 20 21 22 23 24 25 26 27 28 29 30 31 32 33 34 35 36 37 38 39 40 41 42 43 44 45 46 47 48 49 50 51 52 53 54 55 56 57 58 59 60
the kinetic energies of the emissions used in the compositional analysis. Even though the LSC_650C film exhibited different grain sizes as shown in Figure 1, the laterally resolved AES proved similar surface chemistries on these different grains (shown in the table of Figure 4). This suggests that the variation on grain size and height may arise only from the different crystallographic orientations of the LSC grains compared to the rest of the film, and secondary phases that are rich in Sr do not exist in a spatially heterogeneous form on LSC_650C in its as-prepared state.
20000 X 10.0 keV 1.0 µm (a) (b) LSC_650 C LSC_450 C 1 2 50000 X 10.0 keV 0.5 m 1 2 Area LSC_450C LSC_650C
Sr/(Sr+La) (Sr+La)/Co Sr/(Sr+La) (Sr+La)/Co
1 0.39 4.43 0.55 4.86
2 0.41 4.43 0.58 4.62
Figure 4. Scanning electron microscopy image and Auger electron spectroscopy point
analysis on (a) LSC_450C and (b) LSC_650C. AES analysis showed similar chemical composition of the grains with different sizes on LSC_650C.
Both XPS and AES showed that only the as-prepared LSC_450C has uniform stroichiometric Sr content on the A-site, and a smaller amount of Srsurface species in
comparison to the as-prepared LSC_650C surface. The lack of a Sr-rich surface on LSC_450C likely arises from structural factors that thermodynamically limit Sr-segregation 3 4 5 6 7 8 9 10 11 12 13 14 15 16 17 18 19 20 21 22 23 24 25 26 27 28 29 30 31 32 33 34 35 36 37 38 39 40 41 42 43 44 45 46 47 48 49 50 51 52 53 54 55 56 57 58 59 60
though in theory Sr enrichment is energetically favored on these surfaces if they were perfectly crystalline and defect-free.37,48 Because of the laterally uniform surface cation
chemistry detected by AES, and the (Sr+La)/Co ratio of 1.3-1.4 deduced from the XPS analysis, we believe the Srsurface on these as-prepared LSC films is arising from Sr(OH)2
species that form on the Sr-sites of the perovskite LSC surface, and likely not from a separated SrO phase. Both the Sr/(Sr+La) and the relative presense of Sr(OH)2 signature in
the total Sr 3d signal are more enhanced on LSC_650C. The larger presense of Sr compared to bulk nominal is consistent with the recent SIMS results13 on samples equivalent to these
LSC_650C. The stoichiometric cation chemistry, as reflected with a nominal Sr content along with a smaller amount of Sr(OH)2 species on the surface, can contribute to the higher
oxygen reduction activity of the LSC_450C than the LSC_650C observed by Januschewsky et al.12 This is because the hydroxyl species which form when the cathodes are subjected to
humidity during electrochemical testing could block the catalytically active oxygen vacancy sites at the electrode surface and detoriorate the activity. A severe degradation of cathodes of similar composition as those here was also reported by Hjalmarsson et al.49 when
electrochemical tests were performed in humidified air as compared to dry air.
3.3 Surface microstructure and cation segregation induced by thermal annealing
We reported previously that the 200 nm thick LSC films deposited at 340 – 510 C are not only more active than the LSC films of same thickness deposited at a higher temperature (i.e. 650ºC), they are also much more stable and exhibit relatively little degradation electrochemically over time at elevated temperatures.12 To identify the chemical mechanism behind the different degradation behavior of the LSC films, the samples were annealed at 600C in air for 1 hour, 3 hours and 72 hours, and subsequently subjected to XPS and AES analysis. Annealing these films at 600C induces rougher surfaces for both films, with the 3 4 5 6 7 8 9 10 11 12 13 14 15 16 17 18 19 20 21 22 23 24 25 26 27 28 29 30 31 32 33 34 35 36 37 38 39 40 41 42 43 44 45 46 47 48 49 50 51 52 53 54 55 56 57 58 59 60
RMS roughness increased to 2.5 ± 0.5 nm for LSC_450 ºC and 9.0 ± 1.5 nm for LSC_650C
after 72 hours.
3.3.1 Surface cation content on LSC films annealed at 600C
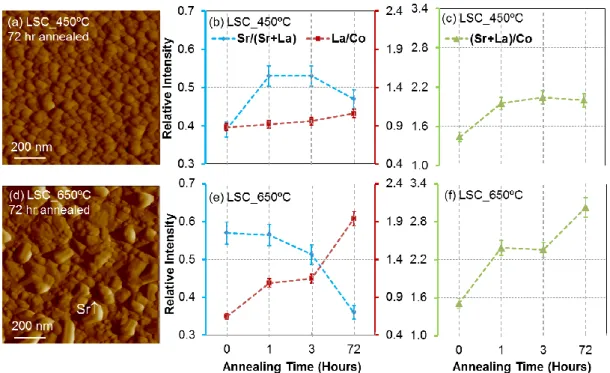
LSC_450C has uniform surface morphology with increased grain size after annealing for 72 hours (Figure 5a). The first hour of annealing induces more Sr and La on the surface (Figure 5b). The Sr segregation level on LSC_450C after 1 hour is about the same as that on the as-prepared LSC_650C. The concurrent increase of Sr/(Sr+La) (Figure 5b) and the (Sr+La)/Co (Figure 5c) without an evident formation of secondary particles on the granular film surface suggests the separation and coverage of the LSC surface with a thin Sr-rich phase layer on LSC_450C. Annealing time longer than 1 hour did not induce significantly higher Sr enrichment, as evidenced with the almost constant Sr/(Sr+La) ratio and a small increase of La/Co. The seemingly constant Sr content after 1 hour annealing may be because the Sr content reaches to its equilibrium state in the top 3 nm of XPS sampling depth for the 60o
emission angle. Even though the increasing thickness of the Sr enrichment layer and/or the continuous structural transformations on the near-surface region with annealing time can contribute to a continuous degradation of electrochemical performance, we could not detect more Sr near the surface beyond the sampling depth of the XPS emissions used.
3 4 5 6 7 8 9 10 11 12 13 14 15 16 17 18 19 20 21 22 23 24 25 26 27 28 29 30 31 32 33 34 35 36 37 38 39 40 41 42 43 44 45 46 47 48 49 50 51 52 53 54 55 56 57 58 59 60
Figure 5. Atomic force microscopy images of (a) LSC_450C and (c) LSC_650C after annealing for 72 hours at 600C in air. Cation ratios of Sr/(Sr+La), La/Co, and (Sr+La)/Co deduced from x-ray photoelectron spectroscopy at the emission angle of 60 on LSC_450C (b and c) and LSC_650C (e and f) after annealing for 1 hour, 3 hours, and 72 hours at 600C in air.
The LSC_650C surface, too, exhibits a sharp increase in (Sr+La)/Co accompanied by an increase also in La/Co after 1 hour of annealing, while no change is found on the Sr/(La+Sr). Beyond the first hour, the La/Co and (Sr+La)/Co continue to increase with annealing time (Figure 5e and 5f), suggesting the depletion of Co on the surface. Furthermore, the Sr/(Sr+La) was found to “seemingly” decrease. We recall that the LSC_650C exhibits large sized crystals after annealing at 600C for 72 hours (Figure 5d). The apparent decrease of the Sr/(Sr+La) from XPS analysis, together with the surface morphology shown in Figure 5d, may actually imply the separation and clustering of an Sr-rich phase (e.g. SrO) on the surface. This is because the local clustering of such Sr-enriched phase into particles can result in the depletion of the Sr in the near-surface areas of the film without the Sr-enriched particles. Furthermore, the height of these large particles (20-40 nm from the height profile of AFM image in Figure 5d) is far beyond the sampling depth of XPS Sr 3d signal. Based on these two 3 4 5 6 7 8 9 10 11 12 13 14 15 16 17 18 19 20 21 22 23 24 25 26 27 28 29 30 31 32 33 34 35 36 37 38 39 40 41 42 43 44 45 46 47 48 49 50 51 52 53 54 55 56 57 58 59 60
factors, the clustering of Sr-rich particles actually reduces the total Sr 3d emission that detected from them compared to the geometry where the same amount of Sr-rich phase is spread thinly on the LSC surface. This hypothesis will be further discussed in the following spatially resolved AES analysis. Main apparent difference between the surface cation composition of these LSC_450C and LSC_650C films as a function of time at 600C is in the (Sr+La)/Co and La/Co ratios, which shows that less Co is left exposed on the LSC_650C compared to that on LSC_450C.
3.3.2. Surface phase heterogeneities on Sr-segregated LSC films annealed at 600 oC
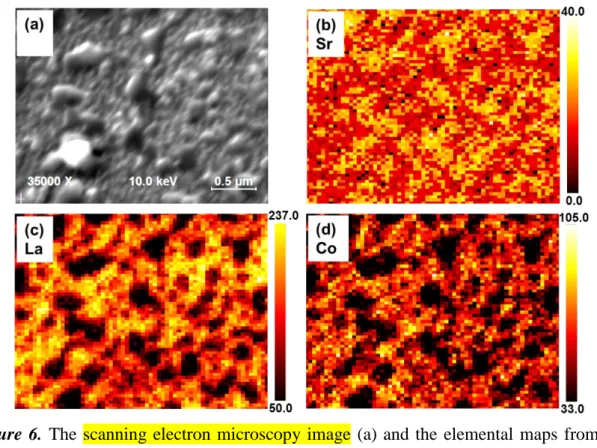
The lateral uniformity of cation chemistry was investigated by performing AES point analysis and high resolution mapping on both the LSC_450C and LSC_650C after annealing for 3 hours and 72 hours. As its uniform surface morphology indicated (Figure 5a), the LSC_450C exhibited a laterally uniform surface cation composition, despite the cation segregation on/near the surface detected by angle resolved XPS. However, a significantly heterogeneous cation chemistry was found laterally on the LSC_650C especially after 72 hours, differing from the larger particles to the smaller grains of the film shown in Figure 6a. The AES elemental mapping with nanoscale resolution, combined with SEM, provides a detailed view of the lateral distribution of the constituent cations, La, Sr, and Co, on the LSC_650C surface after 72 hours. It is evident from these AES elemental maps (Figure 6b-d) that the particles on the LSC_650C surface are Sr-rich with significantly lower La and Co contents. The lateral size of these chemical inhomogeneities is several hundred nanometers, consistent with the secondary particle/crystallite sizes shown in the AFM image of the same surface in Figure 6d. On the basis of AES point analysis, we note that the Sr/(Sr+La) (~ 0.46) and the (Sr+La)/Co (~ 4.34) on the particle-free parts of the film on the 72hr-annealed 3 4 5 6 7 8 9 10 11 12 13 14 15 16 17 18 19 20 21 22 23 24 25 26 27 28 29 30 31 32 33 34 35 36 37 38 39 40 41 42 43 44 45 46 47 48 49 50 51 52 53 54 55 56 57 58 59 60
LSC_650C is close to the near-stoichiometric surface of LSC_450C in its as-prepared state. This shows that the particle-free region on the film became more stoichiometric upon the separation of the secondary phase particles. To deduce the composition of the secondary phase particles, we use as a reference point the stoichiometric film composition with Sr:La:Co of 4:6:10, and the AES emission intensity ratios of the elements on the particles to those on the film (approximately 4:1 for the Sr signal, 5:1 for the La signal, and 3:1 for the Co signal from the intensity scale bars). From this, Sr:La:Co ratio of approximately 16:1:3 (as a maximum) was estimated on the particles. Since a single-phase compound in equilibrium with this stoichiometry does not exist, this result suggests that these particles are made largely of SrO and/or Sr(OH)2, accompanied by smaller amounts of La-oxide, Co-oxide, or La-Co-oxide.
After annealing in air the heterogeneous separation of SrO-rich phases out of the perovskite phase near the surface is evident, although no net increase in Sr content was detected near the surface at these annealing conditions with XPS. The enhanced Sr-segregation on the LSC_650C in its as-deposited condition may gradually induce SrO phase separation during thermal annealing in air (which eventually forms hydroxides). The higher oxygen pressure in air during this annealing compared to the PLD-deposition conditions may be one reason that thermodynamically favors the formation of secondary phase SrO-rich crystallites on the surface of the perovskite LSC. Such clustering of a SrO-rich phase did not occur on the LSC_450C, likely because of the poorly crystalline state of the film, which may not drive as much Sr to the surface (this will be discussed later).
3 4 5 6 7 8 9 10 11 12 13 14 15 16 17 18 19 20 21 22 23 24 25 26 27 28 29 30 31 32 33 34 35 36 37 38 39 40 41 42 43 44 45 46 47 48 49 50 51 52 53 54 55 56 57 58 59 60
Figure 6. The scanning electron microscopy image (a) and the elemental maps from Auger
electron spectroscopy for Sr (b), La (c) and Co (d) on LSC_650C after annealing for 72 hours at 600C in air. The scale bars show signal intensity, and is not a direct measure of cation content. The large particles in (a) are Sr-rich associated with low contents of La and Co.
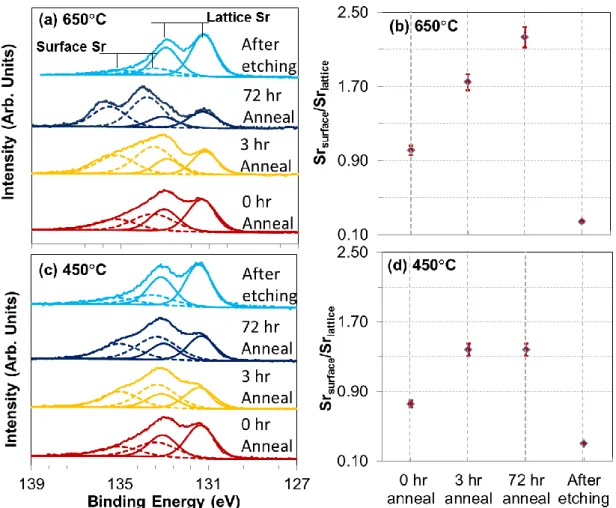
The separation of Sr-rich phases was further confirmed by the changes in the Sr 3d chemical environment detected by XPS measurements on the annealed LSC_650C surface. As shown in Figure 7a and 7b, the intensity of the Srsurface peaks increases relative to the
intensity of Srlattice peaks during annealing. Upon 3 and 72 hours of annealing, the Srsurface
peaks became dominant, very different from that of the as-prepared film.1* The changes of Sr
3d signature indicated different bonding states for Sr on the surface. This supports the hypothesis that, during annealing, the Sr enrichment on the perovskite structure surface may
1
* Although the energy separation of the two sets of Sr peaks (Srsurface and Srlattice) became larger for the 3- and
72-hour annealed states, we used the same fitting parameters for the purpose of a consistent comparison of all
3 4 5 6 7 8 9 10 11 12 13 14 15 16 17 18 19 20 21 22 23 24 25 26 27 28 29 30 31 32 33 34 35 36 37 38 39 40 41 42 43 44 45 46 47 48 49 50 51 52 53 54 55 56 57 58 59 60
evolve to form secondary phase separation, e.g. in the form of SrO-rich phase separation. It is known that the SrO and other alkaline earth metal oxides are very reactive to water (in the form of humidity in air, for example) and form –OH species on the surface. 46,50 Thus, here
the separated SrO–rich phase may induce enhanced formation of the Sr(OH)2 as the Srsurface
species observed in XPS. Sr(OH)2 in air is stable up to 1000 oC before forming anhydrous
SrO51. Therefore, in the cathode functional conditions in ambient air at 600C, this separated surface phase is expected to remain as Sr(OH)2 at least on the top surface layer of these
particles. In contrast, although the annealing induces more Srsurface species on the LSC_450C, the corresponding change in the Sr 3d signature is not nearly as drastic as on LSC_650C after 72 hours. Actually no change was observed in Srsurface/Srlattice from 3 hours to 72 hours on
LSC_450C. This result implies that the Sr-related restructuring is not as significant on LSC_450C and likely more uniform, consistent with the rather smooth surface morphology (deduced from AFM) and uniform surface cation composition distribution (deduced from AES point analysis) after 72 hours of annealing. SrO is known to be a large-band-gap insulator and SrO and Sr(OH)2 are not expected to facilitate electron transfer in ORR52. The
observed partial blockage of the active sites, such as Co, and reduction of active surface area on LSC_650C surface with SrO-rich particles, may be one contributor to the significant deactivation of their surface oxygen exchange kinetics during annealing.
3 4 5 6 7 8 9 10 11 12 13 14 15 16 17 18 19 20 21 22 23 24 25 26 27 28 29 30 31 32 33 34 35 36 37 38 39 40 41 42 43 44 45 46 47 48 49 50 51 52 53 54 55 56 57 58 59 60
Figure 7. Sr 3d region of the photoelectron spectra and the Srsurface/Srlattice ratio on the
LSC_650C (a) and (b), and on LSC_450C (c) and (d), in their as-prepared (0 hr-annealed), 3 hr-annealed, 72hr-annealed, and chemical-etched states. The Sr 3d spectra in (a) and (c) are normalized to show the same highest intensity.
HCl etching (0.14 mol/l for 10 s) of the 72hr-annealed LSC_650C and LSC_450C removes the surface particles and segregation layer and induces a uniform, nearly stoichiometric Sr/(Sr+La) of ~0.4 (Figure S3 of supporting information) and (Sr+La)/Co of ~1.6 (from XPS) on both specimens. In addition, Srsurface peak intensities are found to
decrease significantly after HCl etching (Figure 7a and 7c). The combined XPS and AES results show the removal of the Sr segregation layer and separated SrO/Sr(OH)2-rich particles,
and the exposure of a more stoichiometric LSC surface upon chemical etching. 3 4 5 6 7 8 9 10 11 12 13 14 15 16 17 18 19 20 21 22 23 24 25 26 27 28 29 30 31 32 33 34 35 36 37 38 39 40 41 42 43 44 45 46 47 48 49 50 51 52 53 54 55 56 57 58 59 60
2.3.3. State of Co on the surface of Sr-segregated LSC films annealed at 600 oC
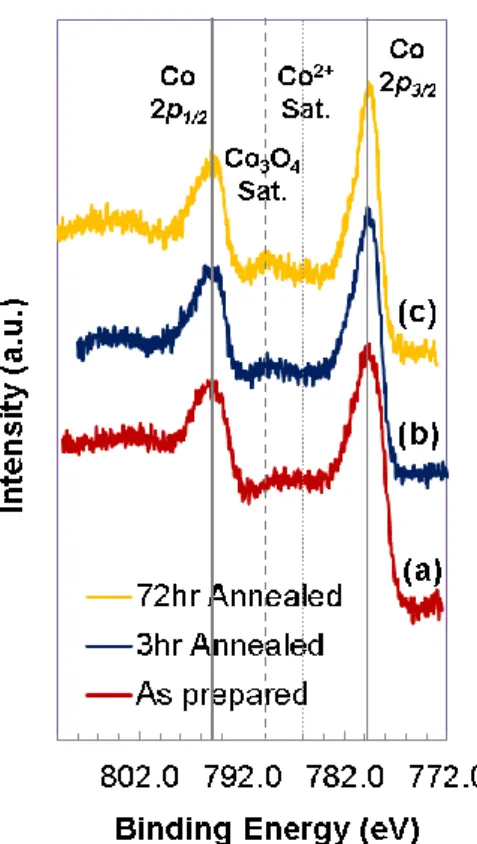
It is worth paying attention to the changes in the binding environment of Co on the surface because this information can provide indications to the state of vacancies and electron transfer properties of the LSC surface, both of which are important in determining the surface oxygen exchange activity on the LSC films. The evolution of the Co 2p photoelectron spectra on the LSC_650C surface as a function of annealing time is shown in Figure 8. The evolution of the Co 2p spectra on LSC_450C upon annealing is qualitatively similar to the one shown in Figure 8. In the as-prepared state, there is a weak Co2+ satellite peak53,54 at
around 786 eV. This suggests that a small amount of Co2+ coexisted with Co3+/Co4+ in the
near-surface region of LSC. We note that Co3+ and Co4+ are indistinguishable and cannot be
quantified from the main peaks of Co 2p photoelectron spectra, while both states are expected to exist on/in LSC at elevated temperatures. Upon annealing to 3 and 72 hours, we have shown above that a SrO-rich phase or layer forms on the LSC film surfaces, which shows separation of the Sr out of the LSC lattice upon annealing. Coincident with this process, a more dominant satellite peak feature arises at around 790 eV that is characteristic of a mixed Co2+ and Co3+ state as in Co3O4.55 The more pronounced satellite feature of Co3O4 with
thermal annealing suggests increased amount of Co3+ in the near-surface lattice of LSC upon
Sr segregation in the form of SrO/Sr(OH)2 separation. Furthermore, the FWHM of the Co
2p3/2 main peak decreases upon annealing, and is found as ~2.6, ~2.2, and ~1.8 eV for the as
prepared, 3hr-annealed and 72hr-annealed states, respectively. The decreased FWHM also suggests more Co3+ and less Co2+ on the surface with annealing time, since the multiple
splitting causes extensive broadening in the Co2+ 2p spectra.46 Even though CoO has a single
type of cobalt (octahedral Co2+), its 2p3/2 is broader than that of Co3O4 that has two types of
cobalt (tetrahedral Co2+ and octahedral Co3+).46 The reduced amount of Co2+ and increased
amount of Co3+ in the near-surface lattice of LSC have implications on the surface oxygen
reduction activity through two possible mechanisms. First, the change in the oxidation state 3 4 5 6 7 8 9 10 11 12 13 14 15 16 17 18 19 20 21 22 23 24 25 26 27 28 29 30 31 32 33 34 35 36 37 38 39 40 41 42 43 44 45 46 47 48 49 50 51 52 53 54 55 56 57 58 59 60
from Co2+ to Co3+ may be charge-compensated on the oxygen sublattice by accomodating a
smaller amount of oxygen vacancies on the LSC surface. Second, the oxidation of Co2+ to
Co3+ results in the decrease of electron density effectively in the conduction band of LSC
surface, and based on a recent model by Jung and Tuller this can have a detrimental influence on the electron transfer to the adsorbing oxygen in the reduction process.56 While both of
these mechanisms can contribute to the degradation of the LSC surface activity in ORR, along with the partial coverage of the surface with SrO/Sr(OH)2-related blocking particles discussed
above, we believe the decrease in the availability of electrons in the conduction band of LSC surface is a more detrimental factor.
Figure 8. Co 2p region of the photoelectron spectra in (a) the as-prepared, (b) 3hr-annealed,
and (c) 72hr-annealed states for LSC_650C. Solid lines indicate main peak positions, dashed line indicate the energy position of the Co3O4 satellite peak, and the dotted line indicates the
energy position of the Co2+ satellite peak. The Co 2p spectra show enhanced formation of
Co3+ and decrease of the Co2+ contribution upon annealing the LSC_650C in air at 600C. 3 4 5 6 7 8 9 10 11 12 13 14 15 16 17 18 19 20 21 22 23 24 25 26 27 28 29 30 31 32 33 34 35 36 37 38 39 40 41 42 43 44 45 46 47 48 49 50 51 52 53 54 55 56 57 58 59 60
4. Discussion
4.1. Relation of surface cation chemistry to electrochemical activity and stability of LSC films
We noted in our motivation of this paper that the relation of cation chemistry and surface structure to the electrochemical activity and stability of LSC thin film cathodes has not yet been defined and understood in a complete form.12,13 The following three major findings from
this work contribute to close this gap. The mechanisms governing the activity and stability of the LSC films deposited at low temperatures (represented by LSC_450C) and those deposited at high temperatures (represented by LSC_650C) are discussed in these three points, and illustrated in Figure 9a.
3 4 5 6 7 8 9 10 11 12 13 14 15 16 17 18 19 20 21 22 23 24 25 26 27 28 29 30 31 32 33 34 35 36 37 38 39 40 41 42 43 44 45 46 47 48 49 50 51 52 53 54 55 56 57 58 59 60
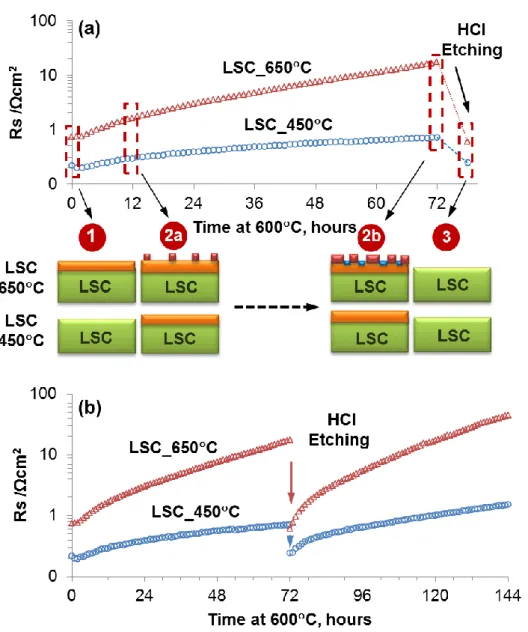
Figure 9. (a) Surface polarization resistance, Rs, of LSC_650C and LSC_450C measured by impedance spectroscopy (cf. Ref. 13) at 600C in air and the likely mechanisms that govern the differences between the activity and stability of these cathode films. Illustration 1-3 marked the critical points correlating the surface chemistry to the electrochemical activity, as explained in the text. The green box denotes LSC bulk with a stoichiometric cation content, the orange box denotes Sr enrichment in the perovskite structure, the red boxes denote separated SrO-rich phases, and the blue boxes denote the particle free region with relatively reduced Sr content on LSC around the SrO-rich particles. The drawing size of particles and LSC film thickness are not-to-scale. (b) Surface polarization resistance Rs of LSC_650C and
3 4 5 6 7 8 9 10 11 12 13 14 15 16 17 18 19 20 21 22 23 24 25 26 27 28 29 30 31 32 33 34 35 36 37 38 39 40 41 42 43 44 45 46 47 48 49 50 51 52 53 54 55 56 57 58 59 60
LSC_650C degrades much faster than LSC_450C, qualitatively similar to the case in the first 72 hours of annealing before etching.
1. The more stoichiometric Sr/(La+Sr) and (Sr+La)/Co (also shown by Kubicek et al.13),
the relatively small amount of Sr(OH)2 environment on the surface, and the more uniform
depth distribution of constituent cations, may all contribute to the higher electrochemical performance of LSC_450C than LSC_650C in the as-prepared states. Both of these LSC film surfaces have a mixed termination of the perovskite phase by both the A- and B-site cations in a comparable way (Figure 2, (Sr+La)/Co). The lack of a Sr-rich surface on the as-prepared state of LSC_450C likely arises from the slow cation out-diffusion kinetics at the low temperatures of its deposition and/or from its amorphous-like structure that reduces the Sr surface segregation tendency (discussed in 4.2). At temperatures lower than 500 oC, cations
can be assumed immobile in the perovskite lattice.57 The higher activity of a more
stoichiometric Sr content on the LSC surface is interesting, because a higher Sr content on LSC is presumed to induce more oxygen vacancies as active sites on the surface. The reason for this behavior opposite to the conventional understanding of LSC surface warrants more research at the molecular and electronic structure level on such surfaces.
2. The governing reason for the severe time-dependent degradation of LSC_650C during annealing at 600C is likely the phase separation of a SrO/Sr(OH)2-rich structure out of the originally Sr-rich LSC phase (~La0.4Sr0.6CoO3 from Figure 2 and Figure 4b) surface, forming
a chemically heterogeneous ‘‘skin’’. However, for LSC_450C, since a discernable heterogeneous SrO phase separation and clustering was not found, the gradual degradation might arise from either the continuous formation of Srsurface species (e.g. Sr(OH)2), which
block surface activity, and/or from the formation and separation of a thin and uniformly distributed SrO layer accompanied by a continuous growth of the Sr-segregation depth beyond the XPS and AES sampling depths. We note that the time constant of Sr enrichment 3 4 5 6 7 8 9 10 11 12 13 14 15 16 17 18 19 20 21 22 23 24 25 26 27 28 29 30 31 32 33 34 35 36 37 38 39 40 41 42 43 44 45 46 47 48 49 50 51 52 53 54 55 56 57 58 59 60
on the perovksite phase LSC surface, likely limited by cation diffusion, is on the order of <1 hour at 600C, shown in Figure 5 for LSC_450C. This is faster than the nucleation and growth of new SrO/Sr(OH)2-related phases that are non-uniformly distributed in the form of
particles on the surface. There are three ways that this new surface microstructure and microchemistry can degrade the activity of the LSC_650C films. First is the partial coverage of the LSC surface by the blocking particles because of the electronically insulating behavior of SrO.58 However, from Figure 6, this coverage amounts up to about 50% of the apparent
surface area, while the degradation of the ORR activity of LSC_650C was shown to have a two orders of magnitude increase in area specific resistance over 72 hours annealing at 600C.12 Therefore, the partial blockage of the active surface with inactive phases does not explain the significant degradation of LSC_650C and we believe there must be a chemical reason for such significant degradation, apart from but related to such SrO/Sr(OH)2-rich
particles. Second, we noted that the heterogeneously distributed phase separation actually leads to a lower level of Sr in the near-surface region of the particle-free parts of the LSC surface (as shown by our XPS and AES analysis). Reduction of the Sr level in near-surface lattice of LSC may be charge-compensated on the oxygen sublattice by decreasing the amount of oxygen vacancies on/near the LSC surface.59-61 Loss of oxygen vacancies, known as active
sites for adsorption, dissociation and diffusion of oxygen62 can result in the degraded oxygen
reduction kinetics on the surface. Third, and likely the most important, a change in the oxidation state of Co from Co2+ to Co3+ was found to occur concurrently with the
SrO/Sr(OH)2-phase separation out of the LSC lattice. The oxidation of Co2+ to Co3+
effectively results in the decrease of electrons as minority carriers in the conduction band of LSC surface, and can have a detrimental influence on the electron transfer to oxygen in the reduction process.56 These three major reasons can be responsible for the serious degradation
of the ORR activity of the LSC cathode films at 600C,12,13 represented by the annealing of 3 4 5 6 7 8 9 10 11 12 13 14 15 16 17 18 19 20 21 22 23 24 25 26 27 28 29 30 31 32 33 34 35 36 37 38 39 40 41 42 43 44 45 46 47 48 49 50 51 52 53 54 55 56 57 58 59 60
the LSC_650C in this work. On the other hand, the LSC films deposited at low temperatures, represented by LSC_450C in this work, are much more stable over time, and we believe this is because of only a thin layer of SrO/Sr(OH)2-rich phase separation distributed on their
surface rather than the significant and non-uniform separation found on LSC_650C.
3. The recovery of the electrochemical activity after chemical etching of both the LSC_450C and LSC_650C is because of the exposure of a stoichiometric and compositionally uniform LSC surface upon removal of the Sr segregation layer (removal of the Srsurface species, i.e. the separated Sr(OH)2 / SrO particles or layer). After chemical etching,
both samples showed relative degradation behaviors similar to those before etching (Figure 9b), where LSC_650C degraded much faster than LSC_450C despite the fact that they both have similar chemical compositions and Sr bonding states after HCl etching (Figure 7). Therefore, the different degradation rates here are more likely related to the different microstructure/crystallinity among the two films and not to their initial surface chemistries. The nano-porosity in LSC_450C may be one reason that its surface polarization resistance is about half that of LSC_650C after etching even when their surface chemistry is very similar at that state. The poor crystallinity of the LSC_450C has a role in suppressing significant Sr segregation and the accompanying degradation of ORR activity as discussed next.2*
4.2 Why does the poorly crystalline LSC film remain more stable?
It is important to note that the poorly crystalline state of the LSC_450C film may actually govern the relative stability of surface chemistry and ORR activity reported here at elevated temperatures. The level of disorder ranging from amorphous to fully crystalline states (dependent on the thin-film preparation method) is known to impact the bulk electrical
2* From Fig. 9b, the degradation rate of both films is faster after etching. A similarly faster degradation was also
observed on samples that were etched directly after preparation. The mechanism behind the faster degradation after chemical etching might be related to more surface area and roughness that may drive further cation segregation; however this is currently not clear and requires further work in the future.
3 4 5 6 7 8 9 10 11 12 13 14 15 16 17 18 19 20 21 22 23 24 25 26 27 28 29 30 31 32 33 34 35 36 37 38 39 40 41 42 43 44 45 46 47 48 49 50 51 52 53 54 55 56 57 58 59 60
properties of the SOFC-related materials.63,64 In this work, the crystallinity of the LSC films
is shown uniquely to have an impact on the evolution of LSC surface cation chemistry. We mentioned in the background of this paper that the cation segregation on the oxide surfaces has its origins in the elastic and chemical/electrostatic interactions that the dopant has with the lattice. The smaller extent of Sr segregation on LSC_450C can result from the degree of crystal disorder, which suppresses Sr-rich phase separation by accommodating the Sr cations inside the bulk lattice more easily. From the elastic strain energy point-of-view, the less dense poorly crystalline LSC_450C can have more open space (defect sites, vacancies, nano-pores, dislocations, and their strain fields) in the lattice and this permits the larger size cation, i.e. Sr, to stay in the bulk rather than being driven strongly to the surface. A complete suppression of long-range phase separation in the amorphous state, contrary to the crystalline state where decomposition is the ground state of the material system, was also shown for semiconductor alloys and explained on the basis of strain energy.65 It is also possible that the disorder in the
LSC_450C accommodates more oxygen vacancies in the bulk, and this can electrostatically attract the Sr cations more to the bulk compared to the fully crystalline state. Because of the more favorable elastic and electrostatic interactions of Sr in the bulk, we believe that the disordered crystal structure of LSC_450C actually governs the high activity and stability of the LSC surface in ORR kinetics by suppressing the extensive segregation and phase separation on the surface.
5. Conclusions
This study elucidated the mechanisms that govern the differences in the ORR activity and stability of LSC cathode films induced by the thermodynamic conditions in synthesis (PLD) and annealing. XPS and AES were used to systematically assess the segregation of surface cations, their chemical bonding environments and the changes in surface microstructure and 3 4 5 6 7 8 9 10 11 12 13 14 15 16 17 18 19 20 21 22 23 24 25 26 27 28 29 30 31 32 33 34 35 36 37 38 39 40 41 42 43 44 45 46 47 48 49 50 51 52 53 54 55 56 57 58 59 60
microchemistry. We have shown that both the initial surface composition (Sr content and binding environment) of the perovskite LSC phase, and the structural and micro-chemical transformations from the perovskite to secondary SrO-rich phases are correlated to the electrochemical activity and stability of LSC cathode films. The nearly stoichiometric and uniform depth distribution of constituent cations, accompanied by the relative smaller amount of hydroxide species, correlate to the higher electrochemical activity on LSC_450C than on LSC_650C in the as-prepared states. Upon annealing the LSC_650C in air at 600C up to 72 hours, a structural change of the surface in the form of SrO/Sr(OH)2-rich phase separation
with ~100-200 nm large crystallites takes place on the initially Sr-rich LSC phase surface. The partial blockage of the surface with these phase-separated particles and the degradation of the LSC near-surface defect chemistry and electronic structure were found responsible for the severe time-dependent degradation of LSC_650C. The oxidation of Co2+ to Co3+, concurrent with Sr-rich phase separation, results effectively in the decrease of electrons in the conduction band of LSC surface, and can detrimentally influence the electron transfer to oxygen in the reduction process. On the other hand, the gradual and milder degradation of the LSC_450C electrode upon annealing is not associated with severe and non-uniform surface phase separation, but rather may arise from either the enhanced formation of Sr(OH)2 as Srsurface
species and/or the gradual growth of a thin, defected and uniformly distributed SrO-segregation layer. The full recovery of the very high electrochemical activity of both the LSC_450C and LSC_650C after the (etching-induced) exposure of a renewed stoichiometric LSC surface testifies the favorable role of a stoichiometric cation chemistry on the ORR kinetics of the perovskite structured LSC. The poorly crystalline atomic structure of the LSC deposited at low temperatures (LSC_450C) prohibit the extensive segregation and phase separation of cations on the surface, and thus inherently governs the high activity and stability of the LSC surface in ORR kinetics. A deep understanding of the relation of surface 3 4 5 6 7 8 9 10 11 12 13 14 15 16 17 18 19 20 21 22 23 24 25 26 27 28 29 30 31 32 33 34 35 36 37 38 39 40 41 42 43 44 45 46 47 48 49 50 51 52 53 54 55 56 57 58 59 60
structure and chemistry to the ORR activity and stability of the cathode, as demonstrated in part here but also in a broader range of materials, is essential for advancing our ability to tailor the electrochemical performance of solid oxide fuel cell cathodes. In obtaining this understanding, the relation of the thermodynamic driving forces and kinetic factors (temperature, oxygen partial pressure, electrochemical potential) as well as of material atomic structure (disorder, lattice strain) to the surface cation and anion chemistry must be carefully assessed.
Acknowledgements: ZC and BY gratefully acknowledge financial support of this research from US-DOE Office of Nuclear Energy and Idaho National Laboratory, and MK and JF gratefully acknowledge funding from Austrian Science Fund (FWF) project P 21960-N17.
Supporting Information Available: The following figures are provided in a separate file as supporting information to this paper.
Figure S1. X-ray photoelectron spectra of La 3d, Co 2p, La 4d, and Sr 3d on the LSC_450C and LSC_650C at the emission angles of 0 and 80.
Figure S2. X-ray photoelectron spectra of C 1s and O 1s on the LSC_450C and LSC_650C at the emission angle of 80.
Figure S3. Scanning electron microscopy image of the HCl-etched LSC_650C surface after annealing at 600C for 72 hours.
This information is available free of charge via the Internet at http://pubs.acs.org/
References
(1) Adler, S. B. Chemical Reviews 2004, 104, 4791.
(2) Petrov, A. N.; Kononchuk, O. F.; Andreev, A. V.; Cherepanov, V. A.; Kofstad, P. Solid State Ion. 1995, 80, 189.
(3) Kawada, T.; Yokokawa, H. Electrical Properties of Oxide Materials 1997, 125-, 187.
(4) Jacobson, A. J. Chemistry of Materials 2009, 22, 660.
(5) Bieberle-Hütter, A.; Søgaard, M.; Tuller, H. L. Solid State Ion. 2006, 177, 1969. (6) Baumann, F. S.; Maier, J.; Fleig, J. Solid State Ion. 2008, 179, 1198.
(7) Fleig, J.; Baumann, F. S.; Brichzin, V.; Kim, H. R.; Jamnik, J.; Cristiani, G.; Habermeier, H. U.; Maier, J. Fuel Cells 2006, 6, 284.
3 4 5 6 7 8 9 10 11 12 13 14 15 16 17 18 19 20 21 22 23 24 25 26 27 28 29 30 31 32 33 34 35 36 37 38 39 40 41 42 43 44 45 46 47 48 49 50 51 52 53 54 55 56 57 58 59 60
(8) Baumann, F. S.; Fleig, J.; Habermeier, H. U.; Maier, J. Solid State Ion. 2006, 177, 1071.
(9) Baumann, F. S.; Fleig, J.; Konuma, M.; Starke, U.; Habermeier, H.-U.; Maier, J. J. Electrochem. Soc. 2005, 152, A2074.
(10) Yang, Y. M. L.; Jacobson, A. J.; Chen, C. L.; Luo, G. P.; Ross, K. D.; Chu, C. W. Appl. Phys. Lett. 2001, 79, 776.
(11) Berenov, A. V.; Atkinson, A.; Kilner, J. A.; Bucher, E.; Sitte, W. Solid State Ionics 2010, 181, 819.
(12) Januschewsky, J.; Ahrens, M.; Opitz, A.; Kubel, F.; Fleig, J. Advanced Functional Materials 2009, 19, 3151.
(13) Kubicek, M.; Limbeck, A.; Fromling, T.; Hutter, H.; Fleig, J. Journal of the Electrochemical Society 2011, 158, B727.
(14) Montini, T.; Bevilacqua, M.; Fonda, E.; Casula, M. F.; Lee, S.; Tavagnacco, C.; Gorte, R. J.; Fornasiero, P. Chemistry of Materials 2009, 21, 1768.
(15) Hammer, B.; Norskov, J. K. Nature 1995, 376, 238.
(16) Abild-Pedersen, F.; Greeley, J.; Nørskov, J. Catal. Lett. 2005, 105, 9.
(17) Fister, T. T.; Fong, D. D.; Eastman, J. A.; Baldo, P. M.; Highland, M. J.; Fuoss, P. H.; Balasubramaniam, K. R.; Meador, J. C.; Salvador, P. A. Appl. Phys. Lett. 2008, 93.
(18) Katsiev, K.; Yildiz, B.; Balasubramaniam, K.; Salvador, P. A. Appl. Phys. Lett. 2009, 95.
(19) Yildiz, B.; Myers, D. J.; Carter, J. D.; Chang, K.-C.; You, H. Advances in Solid Oxide Fuel Cells III: Ceramic and Engineering Science Proceedings; John Wiley & Sons, Inc., 2009.
(20) Decorse, P.; Caboche, G.; Dufour, L.-C. Solid State Ion. 1999, 117, 161. (21) Wang, W.; Jiang, S. P. Solid State Ion. 2006, 177, 1361.
(22) Jiang, S. Journal of Solid State Electrochemistry 2007, 11, 93.
(23) Falcón, H.; Barbero, J. A.; Alonso, J. A.; Martínez-Lope, M. J.; Fierro, J. L. G. Chemistry of Materials 2002, 14, 2325.
(24) Gomann, K.; Borchardt, G.; Schulz, M.; Gomann, A.; Maus-Friedrichs, W.; Lesage, B.; Kaitasov, O.; Hoffmann-Eifert, S.; Schneller, T. Physical Chemistry Chemical Physics 2005, 7, 2053.
(25) Szot, K.; Speier, W. Physical Review B 1999, 60, 5909. (26) Hughes, A. E.; Badwal, S. P. S. Solid State Ion. 1991, 46, 265. (27) Lee, H. B.; Prinz, F. B.; Cai, W. Acta Materialia 2010, 58, 2197.
(28) Majumdar, D.; Chatterjee, D. X-ray photoelectron spectroscopic studies on yttria, zirconia, and yttria-stabilized zirconia; AIP, 1991; Vol. 70.
(29) Ridder, M. d.; Welzenis, R. G. v.; Gon, A. W. D. v. d.; Brongersma, H. H.; Wulff, S.; Chu, W.-F.; Weppner, W. Subsurface segregation of yttria in yttria stabilized zirconia; AIP, 2002; Vol. 92.
(30) Scanlon, P. J.; Bink, R. A. M.; van Berkel, F. P. F.; Christie, G. M.; van Ijzendoorn, L. J.; Brongersma, H. H.; van Welzenis, R. G. Solid State Ion. 1998, 112, 123.
(31) Nowotny, J.; Sorrell, C. C.; Bak, T. Surf. Interface Anal. 2005, 37, 316.
(32) Han, J. W.; Kitchin, J. R.; Sholl, D. S. Step decoration of chiral metal surfaces; AIP, 2009; Vol. 130.
(33) Lussier, A.; Dvorak, J.; Stadler, S.; Holroyd, J.; Liberati, M.; Arenholz, E.; Ogale, S. B.; Wu, T.; Venkatesan, T.; Idzerda, Y. U. Thin Solid Films 2008, 516, 880.
(34) Estrade, S.; Arbiol, J.; Peiro, F.; Infante, I. C.; Sanchez, F.; Fontcuberta, J.; de la Pena, F.; Walls, M.; Colliex, C. Appl. Phys. Lett. 2008, 93.
(35) Estrade, S.; Rebled, J. M.; Arbiol, J.; Peiro, F.; Infante, I. C.; Herranz, G.; Sanchez, F.; Fontcuberta, J.; Cordoba, R.; Mendis, B. G.; Bleloch, A. L. Appl. Phys. Lett. 2009, 95. 3 4 5 6 7 8 9 10 11 12 13 14 15 16 17 18 19 20 21 22 23 24 25 26 27 28 29 30 31 32 33 34 35 36 37 38 39 40 41 42 43 44 45 46 47 48 49 50 51 52 53 54 55 56 57 58 59 60