HAL Id: hal-01678386
https://hal.archives-ouvertes.fr/hal-01678386
Submitted on 9 May 2018
HAL is a multi-disciplinary open access
archive for the deposit and dissemination of
sci-entific research documents, whether they are
pub-lished or not. The documents may come from
teaching and research institutions in France or
abroad, or from public or private research centers.
L’archive ouverte pluridisciplinaire HAL, est
destinée au dépôt et à la diffusion de documents
scientifiques de niveau recherche, publiés ou non,
émanant des établissements d’enseignement et de
recherche français ou étrangers, des laboratoires
publics ou privés.
release 9
D. M. Capellupo, F. Hamann, H. Herbst, W. N. Brandt, J. Ge, I. Paris, P.
Petitjean, D. P. Schneider, A. Streblyanska, D. York
To cite this version:
D. M. Capellupo, F. Hamann, H. Herbst, W. N. Brandt, J. Ge, et al.. Quasars with P V broad
absorp-tion in BOSS data release 9. Monthly Notices of the Royal Astronomical Society, Oxford University
Press (OUP): Policy P - Oxford Open Option A, 2017, 469 (1), pp.323-338. �10.1093/mnras/stx870�.
�hal-01678386�
Quasars with P v broad absorption in BOSS data release 9
D. M. Capellupo
1,2 ?, F. Hamann
3,4, H. Herbst
4, W. N. Brandt
5,6,7, J. Ge
4,
I. Pˆ
aris
8, P. Petitjean
9, D. P. Schneider
5,6, A. Streblyanska
10,11, D. York
12,131Department of Physics, McGill University, Montreal, Quebec, H3A 2T8, Canada 2McGill Space Institute, McGill University, Montreal, QC, H3A 2A7, Canada
3Department of Physics and Astronomy, University of California, Riverside, CA 92507, USA 4Department of Astronomy, University of Florida, Gainesville, FL 32611-2055, USA
5Department of Astronomy and Astrophysics, The Pennsylvania State University, University Park, PA 16802 6Institute for Gravitation and the Cosmos, The Pennsylvania State University, University Park, PA 16802 7Department of Physics, Pennsylvania State University, University Park, PA 16802, USA
8Aix Marseille Universit´e, CNRS, LAM, (Laboratoire d’Astrophysique de Marseille), Marseille, France
9Institut d’Astrophysique de Paris, Universit´e Paris 6-CNRS, UMR7095, 98bis Boulevard Arago, F-75014 Paris, France 10Instituto de Astrofisica de Canarias (IAC), E-38200 La Laguna, Tenerife, Spain
11Departamento de Astrofisica, Universidad de La Laguna (ULL), E-38205 La Laguna, Tenerife, Spain 12Department of Astronomy & Astrophysics, University of Chicago, Chicago, IL 60637
13The Enrico Fermi Institute, University of Chicago, Chicago, IL 60637
6 March 2018
ABSTRACT
Broad absorption lines (BALs) found in a significant fraction of quasar spectra identify high-velocity outflows that might be present in all quasars and could be a major fac-tor in feedback to galaxy evolution. Understanding the nature of these flows requires further constraints on their physical properties, including their column densities, for which well-studied BALs, such as C iv λλ1548,1551, typically provide only a lower limit because of saturation effects. Low-abundance lines, such as P v λλ1118,1128, in-dicate large column densities, implying outflows more powerful than measurements of C iv alone would indicate. We search through a sample of 2694 BAL quasars from the SDSS-III/BOSS DR9 quasar catalog for such absorption, and we identify 81 ‘definite’ and 86 ‘probable’ detections of P v broad absorption, yielding a firm lower limit of 3.0−6.2% for the incidence of such absorption among BAL quasars. The P v-detected quasars tend to have stronger C iv and Si iv absorption, as well as a higher incidence of LoBAL absorption, than the overall BAL quasar population. Many of the P v-detected quasars have C iv troughs that do not reach zero intensity (at velocities where P v is detected), confirming that the outflow gas only partially covers the UV continuum source. P v appears significantly in a composite spectrum of non-P v-detected BAL quasars, indicating that P v absorption (and large column densities) are much more common than indicated by our search results. Our sample of P v detections signif-icantly increases the number of known P v detections, providing opportunities for follow-up studies to better understand BAL outflow energetics.
Key words: galaxies: active – quasars:general – quasars:absorption lines.
1 INTRODUCTION
High velocity outflows, originating from quasar accretion discs, likely exist in all quasars and may be an important contributor to feedback to galaxy evolution. One of the sig-natures of these outflows is broad absorption lines (BALs) in quasar spectra. While numerous works have studied BALs, many properties of the outflows themselves are still
uncer-? E-mail:[email protected] (DMC)
tain. Further information on their location, column densi-ties, mass outflow rates, and energetics is required to under-stand the nature of these flows.
In some cases, the distances of the flows from the central black hole can be inferred from BAL variability (Misawa et al. 2007; Moe et al. 2009; Capellupo et al. 2011, 2013, 2014; Hall et al. 2011; Rodr´ıguez Hidalgo et al. 2011, 2013) or from excited state lines with photoionization modelling (Moe et al. 2009; Dunn et al. 2010; Borguet et al. 2013).
Column density estimates, in general, provide only
lower limits because of saturation. In an unknown number of cases, measuring the apparent optical depth of a BAL trough directly from the observed spectra provides only a lower limit on the true optical depth in the line, and thus the column density of the flow, because the absorbing gas only partially covers the background light source (e.g. Hamann 1998; Arav et al. 1999; Gabel et al. 2003). Constraining the energetics of the flows requires knowledge of both the loca-tions and the column densities of the outflows.
One method that overcomes this problem of saturation in BALs is searching for absorption in ions of low abundance. P v is such an ion, for P/C ∼ 0.001 in the Sun (Asplund et al. 2009). Besides its low abundance, P v is a good choice because it has a resonance doublet at wavelengths 1118 and 1128 ˚A, easily accessible from ground-based observations of quasars of moderate to high redshift, and its ionization is similar to much more abundant and commonly measured ions such as C iv λλ1548,1551. P v absorption should be present if the column densities in the outflows are sufficiently large. Furthermore, if the relative abundances are similar to solar abundances, P v absorption implies that commonly observed BALs, such as C iv, are actually highly optically thick and the total outflow column densities are much larger than the apparent optical depths would indicate.
BAL quasars are typically identified based on the pres-ence of C iv broad absorption. Several studies have used the assumption of solar abundances and a standard ioniz-ing spectrum in photoionization models to determine the true C iv optical depths, as well as the true total column densities, based on the presence of P v absorption. Hamann (1998) finds that the true C iv optical depths are at least ∼800 times greater than the P v optical depth in idealized BAL clouds that are optically thin throughout the Lyman continuum. The ratio of C iv to P v optical depths might be as low as ∼100 in other situations with total column den-sities up to NH ∼ 4 × 1023 cm−2. Similar results, across a
wide range of physical conditions, are found by Leighly et al. (2009, 2011). Borguet et al. (2012) use many more observa-tional constraints on the outflow in a particular quasar to determine a C iv/P v optical depth ratio of ∼1200. There-fore, the presence of even weak P v absorption indicates a highly saturated C iv BAL and, therefore, large total column densities.
Building upon the results of Hamann (1998) and Leighly et al. (2009, 2011), Capellupo et al. (2014) estimate that the detection of a strong P v BAL, with apparent op-tical depth reaching as high as 1.5, indicates log NH > 22.3
cm−2. Furthermore, they argue that the detection of vari-ability in a saturated C iv trough, at the same velocities as the P v absorption, strongly favors the hypothesis of outflow clouds crossing our line of sight to the continuum source. This behaviour indicates distances much smaller than those determined via excited state line analysis (sub-parsec to pc scales versus ∼kpc scales; Chamberlain et al. 2015 and refer-ences therein). Despite the smaller distance, Capellupo et al. (2014) estimate the ratio of the kinetic energy luminosity of the flow to the bolometric luminosity of the quasar to be of the order of magnitude necessary for feedback to the host galaxy (0.005 to 0.05; e.g. Prochaska & Hennawi 2009; Hop-kins & Elvis 2010).
Altogether, these previous results demonstrate the im-portance of the detection of low abundance ions in
under-standing the energetics of BAL outflows. To date, however, detections of P v absorption have been limited to a hand-ful of individual cases (Turnshek 1988; Junkkarinen et al. 1997; Hamann 1998; Borguet et al. 2012; Capellupo et al. 2014). Identifying clear detections of P v absorption in a large sample of BAL quasars would allow comparisons be-tween BAL quasars with such detections and those without. Certain sub-groups of BAL quasars, namely LoBALs and FeLoBALs, are known to have different properties than the overall BAL population. For example, they tend to have red-der colours than the overall BAL quasar population (e.g., Gibson et al. 2009). Filiz Ak et al. (2014) finds evidence for a correlation between the incidence of P v absorption and the existence of Si iv and Al iii absorption. It will be useful for the understanding of BAL quasars in general to further investigate how quasars with P v detections, which are in-dicative of large outflow column densities, are similar or dif-ferent to BALs without P v absorption. Furthermore, a large list of P v detections will prove useful for future studies at other wavelengths that can further assess the energetics and other properties of quasars with P v detections as compared to those without.
Therefore, we perform a systematic search for P v ab-sorption in the Sloan Digital Sky Survey III (SDSS-III; Eisenstein et al. 2011) Baryon Oscillation Spectroscopic Sur-vey (BOSS; Dawson et al. 2013), which uses the SDSS 2.5-meter telescope at Apache Point Observatory (Gunn et al. 2006). The BOSS survey is ideally suited to this search as it was designed to target over 100,000 quasars at red-shifts ze > 2.2 (Bolton et al. 2012; Ross et al. 2012), and,
as a result, it contains one of the largest samples of BAL quasars. Compared to the original SDSS-I/II survey (York et al. 2000), the BOSS spectrograph (Smee et al. 2013) has smaller fibers, improved detectors, higher throughput, and a wider wavelength range, extending to ∼3600 ˚A at the blue end (Dawson et al. 2013). Despite the more favorable wave-length coverage, our search is limited to quasars at a redshift ze> 2.3 because of the location of the P v doublet.
Furthermore, since the wavelength of P v places it in the Lyα forest, it is nearly impossible to rule out the existence of weak or narrow P v. Therefore, our systematic search will only be able to identify those BAL quasars with a clear detection of P v, at the same outflow velocities as the C iv BALs, which were originally used to identify BAL quasars among the BOSS quasar sample.
Section 2 describes our parent sample of BAL quasars and our method of searching for P v absorption. Section 3 discusses the general properties of the quasars with P v de-tections. In Section 4, we present composite spectra of BAL quasars both with and without P v detections, and we con-clude with some discussion in Section 5.
2 SAMPLE SELECTION AND P v SEARCH
The SDSS-III BOSS DR9 (Ahn et al. 2012) quasar (DR9Q) catalog (Pˆaris et al. 2012) includes measurements of the bal-nicity index (BI; Weymann et al. 1991), which is the stan-dard indicator of a BAL quasar. In order to cover the full range of BAL strengths, we select those quasars with BI > 0 and BI > 3σBI. Because of the wavelengths of the P v
The BOSS spectrograph provides coverage down to 3600 ˚A, which corresponds to 1090 ˚A in the rest-frame of a ze∼ 2.3
object. These selection criteria produce a parent sample of 2694 BAL quasars.
Two of the authors, DMC and FH, independently vi-sually inspected all 2694 of the DR9Q BAL quasars that met our BI criteria to search for detections of P v absorp-tion. We examine both the full spectrum and the individual wavelength regions of the C iv absorption and potential Si iv and P v absorption. We used the velocities of the C iv and, if it is present, Si iv troughs to guide our search for P v. The location of P v in the Lyα forest means that any potential P v absorption is likely to be blended with unrelated, inter-vening absorption. Another difficulty, particularly for those quasars near the lower redshift cutoff, is the decrease in the signal-to-noise ratio towards the blue end of the spectrum.
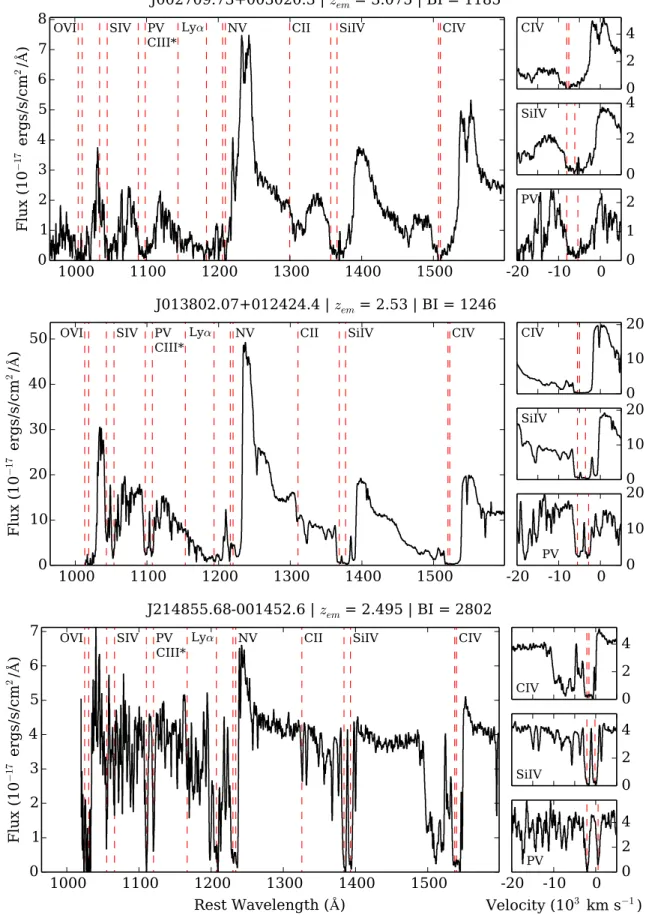
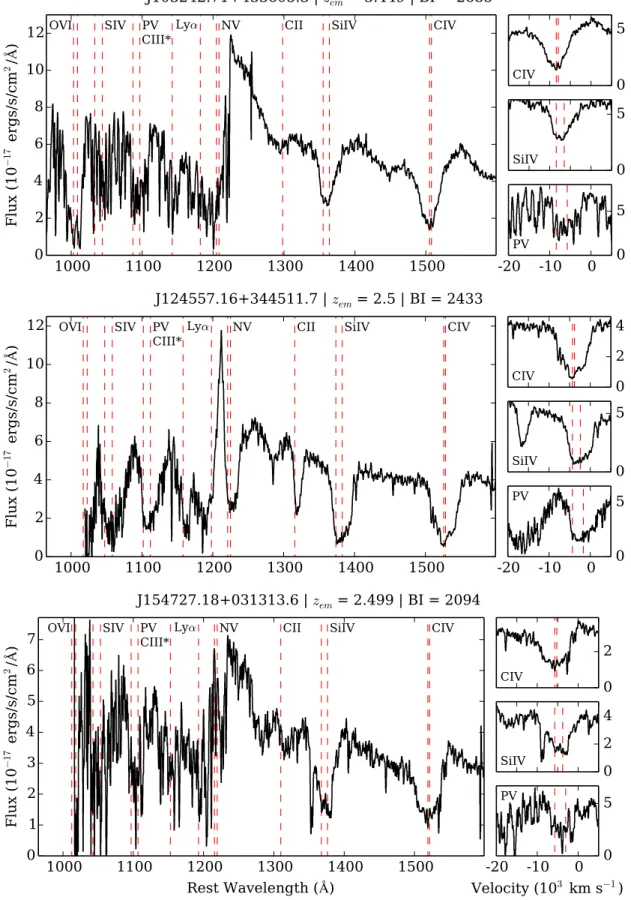
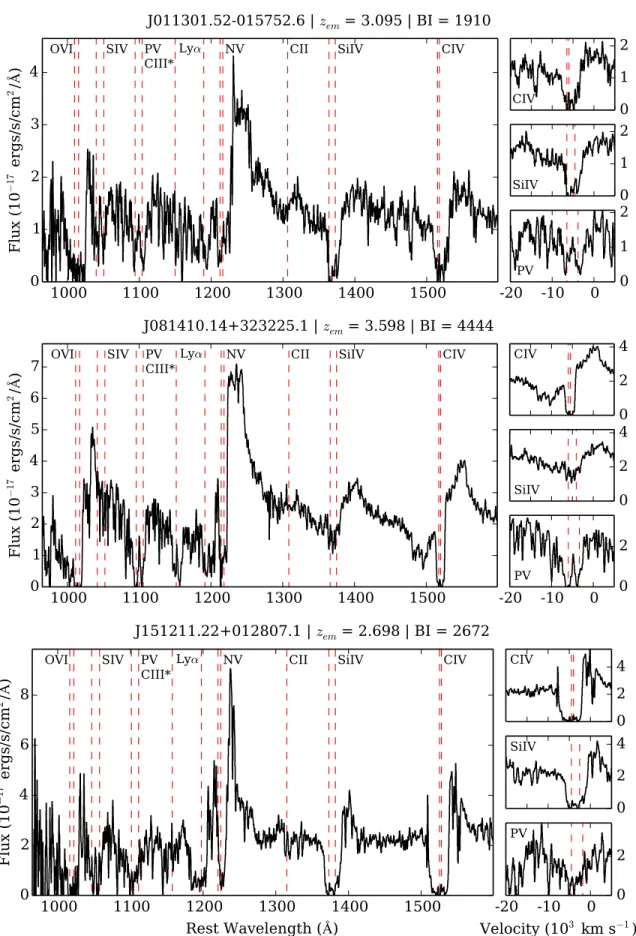
For these reasons, we divide our candidate P v detec-tions into two lists: ‘definite’ and ‘probable’. Figs 1 to 3 show nine example spectra of these ‘definite’ and ‘proba-ble’ P v-detected quasars (spectra of all the P v-detected quasars are available online). For each quasar, we plot the rest wavelength range 965 to 1600 ˚A, which includes lines from O vi λ1037 through C iv. To the right of each spectrum are inset plots of the C iv, Si iv, and P v BALs. Broad, deep absorption at the same velocity, with similar velocity width and profile shape, as C iv and/or Si iv, in a relatively high signal-to-noise ratio spectrum, indicates a secure ‘definite’ detection of P v (for example, J002709+003020 in Fig. 1 and J124557+344511 in Fig. 2). If the signal-to-noise ratio is low, then we prefer to include such a detection in the ‘probable’ list, in order to be conservative in our classifica-tions. In some cases, there is doublet structure at the ex-pected location, matching the exex-pected wavelength separa-tion, of P v, providing a strong confirmation that it is a ‘def-inite’ detection of P v, such as in J013802.07+012424.4 and J214855.68-001452.6 in Fig. 1. There appears to be a dou-blet at the expected location of P v in J011301.52-015752.6 and J081410.14+323225.1 in Fig. 3, but the relatively low signal-to-noise ratio in J011301.52-015752.6 and the weak Si iv in J081410.14+323225.1 makes these ‘probable’ detec-tions, rather than secure ‘definite’ detections.
The location of P v in the Lyα forest and our reliance on C iv and/or Si iv absorption to guide our search introduces several biases. If the P v absorption is narrower than the C iv and/or Si iv absorption, it can be easily confused with Lyα forest lines, leading to a bias against these narrow P v sources. Furthermore, previous work on individual cases of P v absorption have found that the shape of the Si iv trough is a better match to the shape of the P v absorption than is C iv (Junkkarinen et al. 1997; Capellupo et al. 2014). These effects bias us towards more P v detections in quasars that also have Si iv absorption. We are also biased towards higher signal-to-noise ratio spectra. The median signal-to-noise ra-tio is 6.3 and 6.6, respectively, for the ‘definite’ and ‘proba-ble’ detections, whereas it is 4.5 for the parent BAL sample. In general, we are conservative in identifying P v detections, even in the ‘probable’ category, and we are therefore biased towards the strongest P v absorption features. Altogether, this means that a statistically complete sample is not possi-ble. While weak, moderate, and narrow P v absorption lines are likely to be missed by our search, strong P v BALs are unlikely to be missed. Instead, our goal is to identify both
‘definite’ and ‘probable’ detections of P v BALs for com-parisons to the overall BAL population and also for future follow-up observations of these P v detections.
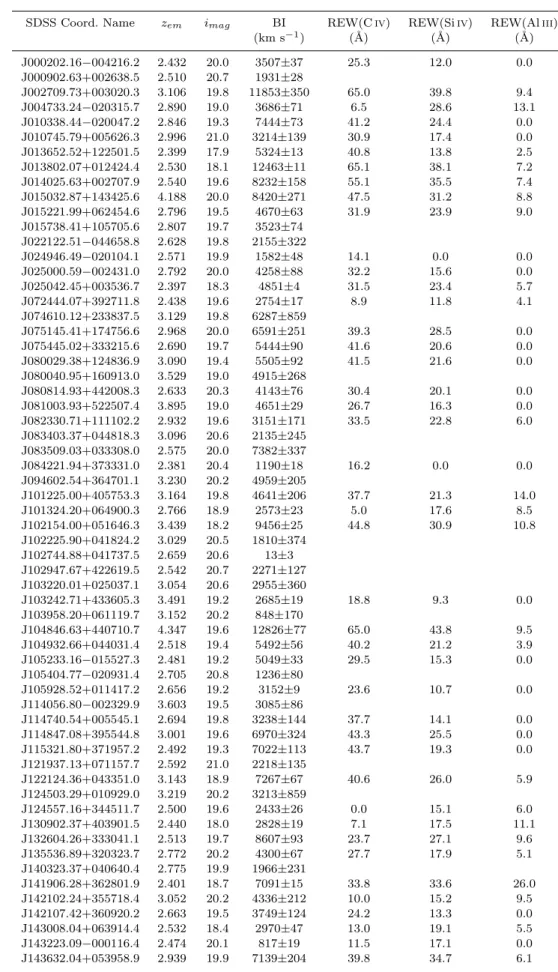
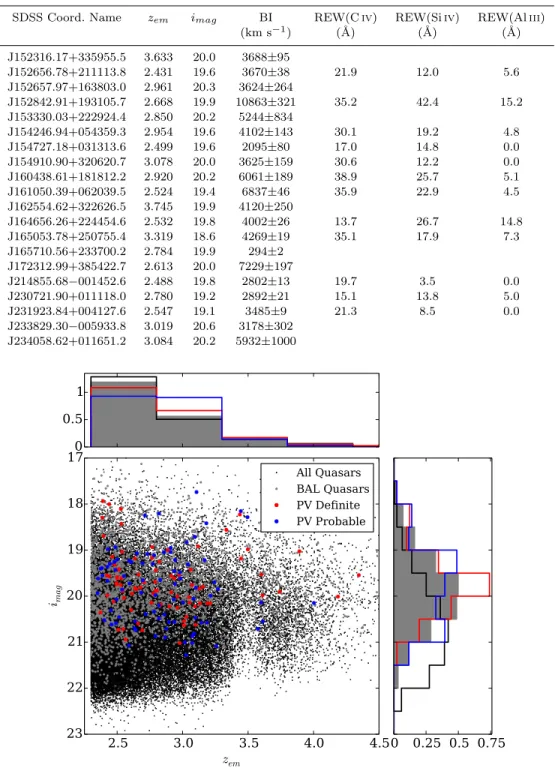
Overall we identify 81 ‘definite’ and 86 ‘probable’ P v detections (out of 2694 BAL quasars), giving a firm lower limit of 3.0%, and ‘probable’ lower limit of 6.2%, for the in-cidence of P v absorption among BAL quasars. The SDSS coordinate names, as well as various properties from the DR9Q catalog, are listed in Table 1, for the ‘definite’ de-tections, and Table A1, for the ‘probable’ detections. Rest equivalent widths (REWs) for C iv, Si iv, and Al iii are listed in the DR9Q catalog only for spectra with a signal-to-noise ratio of at least 5 and a BAL with BI > 500 km s−1.
3 PROPERTIES OF P v QUASARS 3.1 Overall Sample Properties
We first compare the photometric properties of the P v-detected sample with the overall BAL sample, using data tabulated in the DR9Q catalog. Fig. 4 displays the distri-bution of i magnitude (effective wavelength of 7491˚A) with redshift. To compare with all DR9 quasars, we show only the DR9 quasars with average signal-to-noise ratio >0.7 be-cause all of our BAL spectra have signal-to-noise above this value. The figure indicates that the parent BAL quasar sam-ple (gray shaded histogram) is well-matched in redshift to the overall quasar population (black histogram). However, the fraction of P v detections (blue and red histograms) in the redshift bin at z∼3 is slightly higher than the parent BAL and overall quasar populations. This result is likely a selection effect because in the lowest redshift bin, the region of potential P v absorption is near the blue end of the spec-trum, where the BOSS instrument is less sensitive. As for the distributions in i magnitude, the BAL quasars clearly tend to be brighter than the overall quasar population. This behaviour is also likely a selection effect because BALs are easier to detect in higher signal-to-noise spectra (Gibson et al. 2009). The distributions of ‘definite’ and ‘probable’ P v detections, however, are consistent with the overall BAL population.
To compare the typical absorption line properties of the P v-detected quasars to the parent BAL population, we use the measurements of BI and REW tabulated in the DR9Q catalog, listed here in Tables 1 and A1 for the P v detections. Based on the DR9Q BI measurements, the average (median) BI for the ‘definite’ and ‘probable’ detections is 4550 (4000) km s−1 and 4140 (3550) km s−1, respectively. The average (median) BI for the parent BAL sample is 1870 (1160) km s−1.
The DR9Q includes measurements of the REW of C iv, Si iv, and Al iii absorption for those quasars with BI > 500 km s−1 and signal-to-noise of at least 5 in the rest-frame UV spectrum (with these restrictions, the median BI for the parent BAL population is 2430 km s−1and for the P v de-tections is 4510 km s−1). Of the sources with ‘definite’ and ‘probable’ P v detections with REW measurements, 96% have a Si iv REW greater than 0, and 58% and 32%, re-spectively, have an Al iii REW greater than 0. In the overall DR9Q BAL quasar population, just 55% have a Si iv REW greater than 0 and 10% have an Al iii REW greater than 0
1000
1100
1200
1300
1400
1500
0
1
2
3
4
5
6
7
8
Fl
ux
(1
0
− 17er
gs
/s/
cm
2/
)
OVI
SIV
PV
CIII*
Ly
α
NV
CII
SiIV
CIV
0
2
4
CIV
0
2
4
SiIV
-20 -10 0 0
1
2
PV
J002709.73+003020.3 |
z
em= 3.075 | BI = 1185
1000
1100
1200
1300
1400
1500
0
10
20
30
40
50
Fl
ux
(1
0
− 17er
gs
/s/
cm
2/
)
OVI
SIV
PV
CIII*
Ly
α
NV
CII
SiIV
CIV
0
10
20
CIV
0
10
20
SiIV
-20 -10 0 0
10
20
PV
J013802.07+012424.4 |
z
em= 2.53 | BI = 1246
1000
1100
1200
1300
1400
1500
Rest Wavelength ( )
0
1
2
3
4
5
6
7
Fl
ux
(1
0
− 17er
gs
/s/
cm
2/
)
OVI
SIV
PV
CIII*
Ly
α
NV
CII
SiIV
CIV
0
2
4
CIV
0
2
4
SiIV
-20 -10 0
Velocity (10
3km s
−1)
0
2
4
PV
J214855.68-001452.6 |
z
em= 2.495 | BI = 2802
Figure 1. Examples of three of the 81 ‘definite’ detections of P v absorption, with varying P v profile shapes. For each quasar, the full spectrum from blueward of O vi to redward of C iv is displayed in the left panel; in the right panel, only the C iv, Si iv, and P v absorption regions are plotted on a velocity scale. The potential locations of various absorption lines are labeled based on the velocity of the deepest segment of the C iv trough. Spectra of all P v-detected quasars are available online.
1000
1100
1200
1300
1400
1500
0
2
4
6
8
10
12
Fl
ux
(1
0
− 17er
gs
/s/
cm
2/
)
OVI
SIV
PV
CIII*
Ly
α
NV
CII
SiIV
CIV
0
5
CIV
0
5
SiIV
-20 -10 0 0
5
PV
J103242.71+433605.3 |
z
em= 3.449 | BI = 2685
1000
1100
1200
1300
1400
1500
0
2
4
6
8
10
12
Fl
ux
(1
0
− 17er
gs
/s/
cm
2/
)
OVI
SIV
PV
CIII*
Ly
α
NV
CII
SiIV
CIV
0
2
4
CIV
0
5
SiIV
-20 -10 0 0
5
PV
J124557.16+344511.7 |
z
em= 2.5 | BI = 2433
1000
1100
1200
1300
1400
1500
Rest Wavelength ( )
0
1
2
3
4
5
6
7
Fl
ux
(1
0
− 17er
gs
/s/
cm
2/
)
OVI
SIV
PV
CIII*
Ly
α
NV
CII
SiIV
CIV
0
2
CIV
0
2
4
SiIV
-20 -10 0
Velocity (10
3km s
−1)
0
5
PV
J154727.18+031313.6 |
z
em= 2.499 | BI = 2094
1000
1100
1200
1300
1400
1500
0
1
2
3
4
Fl
ux
(1
0
− 17er
gs
/s/
cm
2/
)
OVI
SIV
PV
CIII*
Ly
α
NV
CII
SiIV
CIV
0
1
2
CIV
0
1
2
SiIV
-20 -10 0 0
1
2
PV
J011301.52-015752.6 |
z
em= 3.095 | BI = 1910
1000
1100
1200
1300
1400
1500
0
1
2
3
4
5
6
7
Fl
ux
(1
0
− 17er
gs
/s/
cm
2/
)
OVI
SIV
PV
CIII*
Ly
α
NV
CII
SiIV
CIV
0
2
4
CIV
0
2
4
SiIV
-20 -10 0 0
2
PV
J081410.14+323225.1 |
z
em= 3.598 | BI = 4444
1000
1100
1200
1300
1400
1500
Rest Wavelength ( )
0
2
4
6
8
Fl
ux
(1
0
− 17er
gs
/s/
cm
2/
)
OVI
SIV
PV
CIII*
Ly
α
NV
CII
SiIV
CIV
0
2
4
CIV
0
2
4
SiIV
-20 -10 0
Velocity (10
3km s
−1)
0
2
PV
J151211.22+012807.1 |
z
em
= 2.698 | BI = 2672
Table 1. Properties of quasars with definite P v detections
SDSS Coord. Name zem imag BI REW(C iv) REW(Si iv) REW(Al iii)
(km s−1) (˚A) (˚A) (˚A) J000202.16−004216.2 2.432 20.0 3507±37 25.3 12.0 0.0 J000902.63+002638.5 2.510 20.7 1931±28 J002709.73+003020.3 3.106 19.8 11853±350 65.0 39.8 9.4 J004733.24−020315.7 2.890 19.0 3686±71 6.5 28.6 13.1 J010338.44−020047.2 2.846 19.3 7444±73 41.2 24.4 0.0 J010745.79+005626.3 2.996 21.0 3214±139 30.9 17.4 0.0 J013652.52+122501.5 2.399 17.9 5324±13 40.8 13.8 2.5 J013802.07+012424.4 2.530 18.1 12463±11 65.1 38.1 7.2 J014025.63+002707.9 2.540 19.6 8232±158 55.1 35.5 7.4 J015032.87+143425.6 4.188 20.0 8420±271 47.5 31.2 8.8 J015221.99+062454.6 2.796 19.5 4670±63 31.9 23.9 9.0 J015738.41+105705.6 2.807 19.7 3523±74 J022122.51−044658.8 2.628 19.8 2155±322 J024946.49−020104.1 2.571 19.9 1582±48 14.1 0.0 0.0 J025000.59−002431.0 2.792 20.0 4258±88 32.2 15.6 0.0 J025042.45+003536.7 2.397 18.3 4851±4 31.5 23.4 5.7 J072444.07+392711.8 2.438 19.6 2754±17 8.9 11.8 4.1 J074610.12+233837.5 3.129 19.8 6287±859 J075145.41+174756.6 2.968 20.0 6591±251 39.3 28.5 0.0 J075445.02+333215.6 2.690 19.7 5444±90 41.6 20.6 0.0 J080029.38+124836.9 3.090 19.4 5505±92 41.5 21.6 0.0 J080040.95+160913.0 3.529 19.0 4915±268 J080814.93+442008.3 2.633 20.3 4143±76 30.4 20.1 0.0 J081003.93+522507.4 3.895 19.0 4651±29 26.7 16.3 0.0 J082330.71+111102.2 2.932 19.6 3151±171 33.5 22.8 6.0 J083403.37+044818.3 3.096 20.6 2135±245 J083509.03+033308.0 2.575 20.0 7382±337 J084221.94+373331.0 2.381 20.4 1190±18 16.2 0.0 0.0 J094602.54+364701.1 3.230 20.2 4959±205 J101225.00+405753.3 3.164 19.8 4641±206 37.7 21.3 14.0 J101324.20+064900.3 2.766 18.9 2573±23 5.0 17.6 8.5 J102154.00+051646.3 3.439 18.2 9456±25 44.8 30.9 10.8 J102225.90+041824.2 3.029 20.5 1810±374 J102744.88+041737.5 2.659 20.6 13±3 J102947.67+422619.5 2.542 20.7 2271±127 J103220.01+025037.1 3.054 20.6 2955±360 J103242.71+433605.3 3.491 19.2 2685±19 18.8 9.3 0.0 J103958.20+061119.7 3.152 20.2 848±170 J104846.63+440710.7 4.347 19.6 12826±77 65.0 43.8 9.5 J104932.66+044031.4 2.518 19.4 5492±56 40.2 21.2 3.9 J105233.16−015527.3 2.481 19.2 5049±33 29.5 15.3 0.0 J105404.77−020931.4 2.705 20.8 1236±80 J105928.52+011417.2 2.656 19.2 3152±9 23.6 10.7 0.0 J114056.80−002329.9 3.603 19.5 3085±86 J114740.54+005545.1 2.694 19.8 3238±144 37.7 14.1 0.0 J114847.08+395544.8 3.001 19.6 6970±324 43.3 25.5 0.0 J115321.80+371957.2 2.492 19.3 7022±113 43.7 19.3 0.0 J121937.13+071157.7 2.592 21.0 2218±135 J122124.36+043351.0 3.143 18.9 7267±67 40.6 26.0 5.9 J124503.29+010929.0 3.219 20.2 3213±859 J124557.16+344511.7 2.500 19.6 2433±26 0.0 15.1 6.0 J130902.37+403901.5 2.440 18.0 2828±19 7.1 17.5 11.1 J132604.26+333041.1 2.513 19.7 8607±93 23.7 27.1 9.6 J135536.89+320323.7 2.772 20.2 4300±67 27.7 17.9 5.1 J140323.37+040640.4 2.775 19.9 1966±231 J141906.28+362801.9 2.401 18.7 7091±15 33.8 33.6 26.0 J142102.24+355718.4 3.052 20.2 4336±212 10.0 15.2 9.5 J142107.42+360920.2 2.663 19.5 3749±124 24.2 13.3 0.0 J143008.04+063914.4 2.532 18.4 2970±47 13.0 19.1 5.5 J143223.09−000116.4 2.474 20.1 817±19 11.5 17.1 0.0 J143632.04+053958.9 2.939 19.9 7139±204 39.8 34.7 6.1
Table 1. continued...
SDSS Coord. Name zem imag BI REW(C iv) REW(Si iv) REW(Al iii)
(km s−1) (˚A) (˚A) (˚A) J152316.17+335955.5 3.633 20.0 3688±95 J152656.78+211113.8 2.431 19.6 3670±38 21.9 12.0 5.6 J152657.97+163803.0 2.961 20.3 3624±264 J152842.91+193105.7 2.668 19.9 10863±321 35.2 42.4 15.2 J153330.03+222924.4 2.850 20.2 5244±834 J154246.94+054359.3 2.954 19.6 4102±143 30.1 19.2 4.8 J154727.18+031313.6 2.499 19.6 2095±80 17.0 14.8 0.0 J154910.90+320620.7 3.078 20.0 3625±159 30.6 12.2 0.0 J160438.61+181812.2 2.920 20.2 6061±189 38.9 25.7 5.1 J161050.39+062039.5 2.524 19.4 6837±46 35.9 22.9 4.5 J162554.62+322626.5 3.745 19.9 4120±250 J164656.26+224454.6 2.532 19.8 4002±26 13.7 26.7 14.8 J165053.78+250755.4 3.319 18.6 4269±19 35.1 17.9 7.3 J165710.56+233700.2 2.784 19.9 294±2 J172312.99+385422.7 2.613 20.0 7229±197 J214855.68−001452.6 2.488 19.8 2802±13 19.7 3.5 0.0 J230721.90+011118.0 2.780 19.2 2892±21 15.1 13.8 5.0 J231923.84+004127.6 2.547 19.1 3485±9 21.3 8.5 0.0 J233829.30−005933.8 3.019 20.6 3178±302 J234058.62+011651.2 3.084 20.2 5932±1000
2.5
3.0
3.5
4.0
4.5
z
em17
18
19
20
21
22
23
i
magAll Quasars
BAL Quasars
PV Definite
PV Probable
0
0.5
1
0 0.25 0.5 0.75
Figure 4. The distribution of i magnitude with redshift, zem. All DR9Q quasars with zem> 2.3 (and S/N > 0.7) are indicated as black
points; the BAL quasars and definite and probable P v detections as gray, red, and blue points, respectively. The top and right panels show the distribution in zem and i magnitude for each sub-sample.
(this fraction of BOSS BAL quasars with Al iii absorption is consistent with earlier studies that determine that LoB-ALs comprise ∼10% of the overall BAL population; Trump et al. 2006). Keep in mind that we are biased towards P v detections in quasars with Si iv absorption because of our vi-sual inspection procedure (Section 2), but these results are consistent with those of Filiz Ak et al. (2014), who observe
many more instances of prominent P v absorption in BAL quasars with Al iii or Si iv BALs than those without.
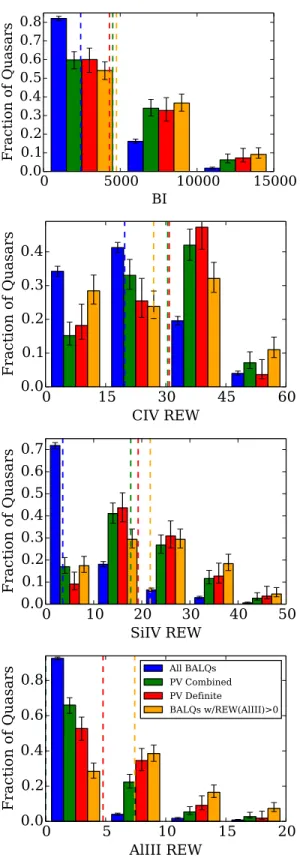
Fig. 5 presents the distribution in BI, REW(C iv), REW(Si iv), and REW(Al iii) for all DR9Q BAL quasars, definite P v detections, combined ‘definite’ and ‘probable’ detections, and BAL quasars with REW(Al iii) > 0. The me-dian values of each parameter are indicated by the dashed lines, and the 1σ error bars are based on the counting
statis-Figure 5. Histograms showing the distribution in BI (top panel) and the REW of C iv (second panel), Si iv (third panel), and Al iii (bottom panel) for the parent sample of BAL quasars (BALQs; blue) and three subsets of BALQs – those with P v detections (green), those with just ‘definite’ P v detections, and all DR9Q BALQs with a detection of Al iii absorption. Each set of his-tograms represents the fractions of sources within the full range indicated by the axis labels. This figure only includes BAL quasars with BI > 500 km s−1 and S/N > 5. The dashed lines are the median values of each parameter for each grouping of BALs.
tics for the number of measurements in each bin (Cameron 2011). It is clear that the P v detections are skewed to-wards quasars with stronger C iv and Si iv BALs, as com-pared to the overall BAL population. The distributions also indicate that the P v detections tend to have similar C iv and Si iv BAL strengths as all BAL quasars with low-ionization absorption, which we designate here as ‘BALQs with REW(Al iii) > 0.’
Fig. 6 displays the i − w1 colour versus i magnitude, where w1 is one of four bands of the Wide-field Infrared Survey Explorer (WISE; Wright et al. 2010). The i − w1 colour measures the spectral slope across the near-UV to optical wavelengths in the quasar rest-frame and is a good indicator of dust reddening for quasars at these redshifts (Hamann et al, in prep). There is a slight trend towards redder colours for the P v-detected quasars, compared to the overall BAL quasar population. This colour difference is probably related to the tendency for P v-detected quasars to have stronger absorption in low-ionization lines such as Al iii and Mg ii (see Fig. 5 and Section 4; also, Herbst et al. in preparation). These low-ionization features are a defining characteristic of LoBALs, which are known to have redder colours than BAL quasars without them (HiBALs; Spray-berry & Foltz 1992; Brotherton et al. 2001; Trump et al. 2006; Gibson et al. 2009).
We also compare the FIRST radio measurements of P v detections to the overall BAL sample. Only 3.2+0.1−0.1%
of the parent quasar population and 3.6+0.4−0.3% of the BAL
quasars are detected by FIRST. In comparison, 4.9+3.6 −1.5%
and 3.5+3.2−1.1% of the ‘definite’ and ‘probable’ P v-detected
quasars, respectively, have FIRST detections. Combining the ‘definite’ and ‘probable’ P v-detected quasars yields 4.2+2.2−1.1% with FIRST detections. Given the errors due to
small number statistics for the P v-detected quasars, the in-cidence of radio-loud quasars appears to be consistent be-tween the P v-detected sample and the overall (optically-selected) quasar and BAL quasar populations.
3.2 Individual Spectra
Besides examining the overall properties of the different BAL quasar populations, it is informative to investigate the individual examples of P v absorption. P v absorption at the same velocity of C iv absorption with nonzero intensity in-dicates a saturated C iv trough and thus that the outflow is partially covering the AGN emission source (see Section 1). Fig. 1 includes three examples with a range of P v pro-file shapes, from broad and deep like the corresponding C iv BAL to a clearly identifiable doublet. In all three cases, the C iv feature reaches zero, or nearly zero, intensity. Fig. 2 shows three examples where the C iv BAL clearly does not reach zero intensity. The average covering fractions for the C iv absorption in these 3 cases ranges from ∼0.4 to 0.6. In quasars such as J103242+433605, P v absorption across a velocity range where C iv has a rounded or complex pro-file implies that this C iv propro-file shape is due to a velocity-dependent covering fraction, and not velocity-velocity-dependent op-tical depths.
Despite our bias towards finding only strong P v BALs (see Section 2), we observe that, in general, the P v absorp-tion is not quite as deep as the corresponding C iv and Si iv absorption (see, for example, J013802+012424 in Fig. 1 and
18
19
20
21
22
i
mag2.0
2.5
3.0
3.5
4.0
4.5
5.0
5.5
i
−w
1BAL Quasars
PV Definite
PV Probable
0 0.3 0.6 0.9
Figure 6. The same format as Fig. 4, but for i − w1 colour versus i magnitude. We do not include non-BAL quasars in this figure.
J151211+012807 in Fig. 3). However, the P v absorption is generally similar in width to the corresponding C iv and Si iv BALs, as seen in all the spectra in Figs. 1 to 3, at least in cases where it is not a resolved doublet. The depths of the C iv and P v BALs in the examples in Fig. 2 are similar. This result implies that the P v trough is also saturated with a covering fraction similar to C iv. There is some uncertainty in the depth of the P v absorption due to the possibility of unrelated Lyα forest lines affecting the profile. However, in cases such as J124557+344511, where the shape of the P v absorption profile closely matches the C iv and/or Si iv profile, it is clear that the profile is shaped by a velocity-dependent covering fraction and not intervening absorption. In general, the P v absorption profiles more closely re-semble Si iv than C iv. For example, in J214855−001452, both Si iv and P v have a clearly visible doublet, while the C iv spans a wider range in velocities. There are also cases such as J013802+012424 where the C iv BAL has a strong wing extending blueward, but this wing is less pro-nounced in Si iv and not seen in P v. However, there is also J081410+323225 (Fig. 3), where the flux within the P v ab-sorption feature goes to zero, as in the C iv trough, but the Si iv absorption is much weaker.
Finally, the P v absorption in J013802+012424 (Fig. 1) is a doublet that appears to have the same depth in both components, indicating saturated absorption and optical depth >∼3. This puts the optical depth of C iv at >1000 and gives very high values of the total column density in the outflow (see Section 5 for further discussion).
4 COMPOSITE SPECTRA
An approach to compare the overall properties of BAL quasars with P v detections to those without is to create composite spectra of each group. One strong advantage to analyzing composite spectra is that Lyα forest lines in indi-vidual quasars average out in the composites, and, therefore,
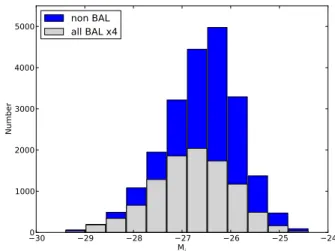
Figure 7. Comparison of the absolute magnitude of the non-BAL and BAL quasar populations used for generating the composite spectra.
it becomes easier to identify intrinsic absorption of the dif-ferent species blueward of Lyα. Several earlier works, such as Reichard et al. (2003), Baskin et al. (2013), and Filiz Ak et al. (2014), have created composites of BAL quasars, and we expand on these earlier works with composites of quasars with clear P v absorption. We follow the procedures described in Herbst et al. in prep for generating the com-posites.
There are known flux calibration issues with the BOSS spectra (e.g. Pˆaris et al. 2011), so prior to creating the com-posite spectra, we apply a correction based on airmass to the individual spectra. The flux calibration issues and flux correction are described in Harris et al. (2016). While the corrections for individual quasars are uncertain, they are expected to be accurate, on average, for samples of quasars that are randomly located on the sky (e.g., in our compos-ites).
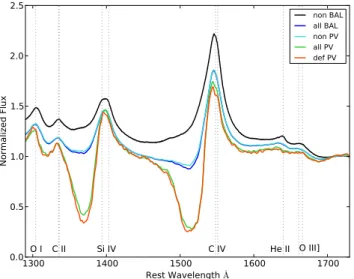
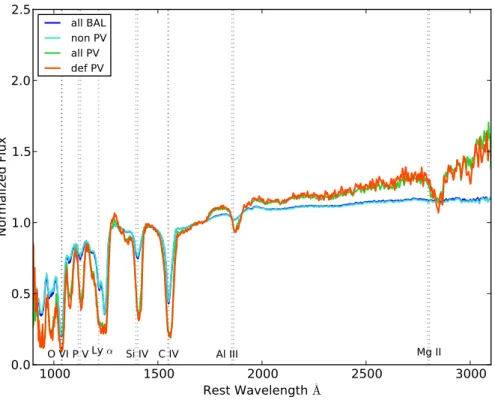
Figure 8. The top panel displays the composite spectra for non-BAL quasars (black curve), BAL quasars (blue curve), BAL quasars without a P v detection (light blue curve), BAL quasars with either a ‘definite’ or ‘probable’ P v detection (green curve), and BAL quasars with a ‘definite’ P v detection (red curve). Several prominent emission lines are marked by dotted lines and labeled across the bottom. The bottom panel shows the number of quasar spectra included in each composite at each wavelength.
Figure 9. The Si iv and C iv region of the composite spectra shown in Fig. 8.
match properly the sample of BAL quasars with a sample of non-BAL quasars, we remove some of the fainter quasars to best match the distributions in absolute i-magnitude (Mi).
This is intended to remove any luminosity-related biases, e.g. the Baldwin effect (Baldwin 1977). We first impose a cut in signal-to-noise ratio. We experiment with different values of signal-to-noise ratio for this cutoff, and we find that requir-ing a signal-to-noise ratio of at least 1.5 produces the closest match between the Midistributions of BALs and non-BALs,
without removing any of the definite detections of P v. This
signal-to-noise ratio cut reduces the difference in median Mi
between the BAL and non-BAL samples from 0.87 to 0.50 mag. To improve further the match in Mi, we randomly
re-move non-BAL quasars from the fainter bins until we obtain the best match between the two populations. This further reduces the difference in median Mi between the two
sam-ples to 0.24 mag. Fig. 7 presents the resulting distributions of the non-BAL (blue) and BAL (grey) populations. With the exception of the additional signal-to-noise ratio cut, this is the same BAL population as described in Section 2.
We next normalize all the individual spectra by the con-tinuum flux at ∼1700˚A and take the median of all the spec-tra in these two populations. We compare these composites to the composites of three subgroups of BAL quasar spectra: the spectra of BAL quasars without detected P v absorp-tion, all BAL quasars where we detect P v absorpabsorp-tion, and only the definite detections of P v absorption. The results are displayed in Fig. 8.
An expansion of the Si iv and C iv absorption region is shown in Fig. 9. It is immediately clear that our P v detec-tions tend to occur in those quasars with strong C iv and Si iv BALs, as indicated already by the examples in Figs 1 to 3 and also in Filiz Ak et al. (2014). The C iv and Si iv absorption in the parent BAL population and in the P v-detected quasars appear to occur at similar velocities and have similar shapes. The BALs are simply deeper in the P v-detected quasars. However, as discussed in Section 2, we are biased towards detecting only the strongest P v absorption features, as we are searching in the Lyα forest.
It is also clear that non-BAL quasars tend to have stronger broad emission lines, including notably C iv and He ii λ1640. In fact, there appears to be a progression from
Figure 10. Modified versions of the BAL composite spectra shown in Fig. 8. Here, the individual BAL spectra are shifted to the absorber frame, and then the resulting composites are divided by modified non-BAL composites with matching distributions of velocity shifts.
strong emission lines in non-BAL quasars, to moderate lines in the non-P v-detected BAL quasars, to the weakest lines in the P v-detected BAL quasars (again, we try to closely match the distribution in Mi between the non-BAL and
BAL samples in order to avoid biases like the Baldwin ef-fect). This behaviour, particularly in He ii, is probably tied to a trend in the far-UV spectral energy distributions that increasingly favors radiative acceleration in higher column density BAL outflows with P v (see Section 5 below).
To analyze further the composite absorption troughs, we use the non-BAL spectra to remove the emission fea-tures. We first shift the BAL spectra to align the centers of the C iv BAL troughs, using the midpoint between the mini-mum (VMIN CIV 2000) and maximini-mum (VMAX CIV 2000) velocity values of the troughs given in the DR9Q catalog (Pˆaris et al. 2012), to create absorber-frame composites. The non-BAL spectra are then shifted by the same distri-bution of shifts as the BAL spectra for each BAL category. This shifting blurs the emission features in the same way as the corresponding absorber-frame BAL composites, and dividing by the appropriately shifted non-BAL composite removes the emission features. The results are presented in Fig. 10, with the same colour scheme as Fig. 8.
Fig. 10 demonstrates that the BAL quasars with P v detections tend to have redder spectra than the overall BAL population, in agreement with Fig. 6, which shows that P v-detected quasars tend to be skewed toward redder colours as compared to the overall BAL population.
Fig. 10 also indicates a propensity for P v absorption to appear in LoBAL quasars. This is indicated by the clear Al iii and Mg ii absorption features in the P v quasar com-posites. In the overall BAL composite, the dip at Al iii is
much shallower than in the P v composites, and there is no visible dip corresponding to Mg ii absorption. This is all in agreement with the results of Section 3, where it is shown that the incidence of Al iii absorption is much higher among the P v-detected quasars than in the overall BAL quasar population.
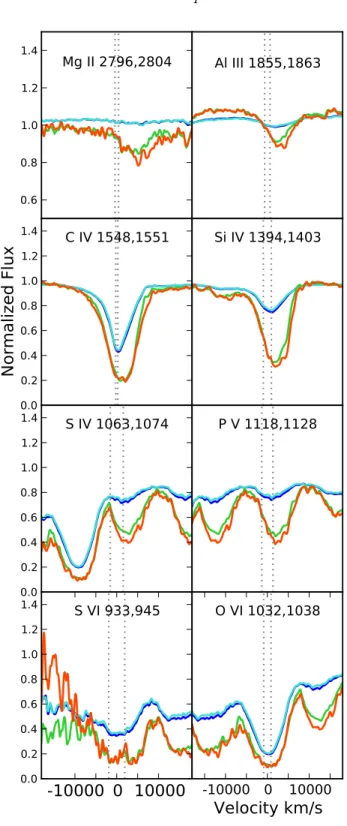
Finally, Fig. 11 presents expanded views of two regions of the composite spectrum of Fig. 10; the top panel is the region blueward of 1300˚A, and the bottom panel is the re-gion redward of 1300˚A. Fig. 12 plots a selection of individual BALs from the normalized composite BAL spectra. In gen-eral, all of the lines (Mg ii, Al iii, C iv, Si iv, S iv, P v, S vi) are much deeper in the P v detections than in the parent BAL population. While the depth of O vi is also larger in the P v composites, the difference is not as striking as for the other lines. The bottom of the C iv and Si iv lines are also skewed toward different velocities in the all-BAL ver-sus P v-only composites (Fig. 12). The same effect may be present in Al iii and P v, but the absorption in the all-BAL composites is too weak to make a firm conclusion. The O vi line, on the other hand, appears to be centered at the same velocities in all of the composites.
The P v absorption in the ‘definite’ composite is only slightly stronger than in the total P v composite, and the shapes of the P v feature are quite similar. This likely indi-cates that most, if not all, of the ‘probable’ detections are in-deed actual P v detections. Furthermore, there is a clear de-pression in both the total BAL composite (dark blue curve) and the composite of BAL quasars without a P v detection (light blue curve) in the P v region. The fact that excluding our list of P v detections from the total BAL composite does not remove this depression indicates that our list of P v
de-Figure 11. An expanded view of the region blueward of Lyα (top) and the region containing Si iv, C iv, and Al iii (bottom) in the composite spectra shown in Fig. 10.
tections is missing, perhaps many, quasars with weaker P v features.
5 DISCUSSION
We have identified 81 ‘definite’ and 86 ‘probable’ detections of P v absorption, from a parent sample of 2694 BAL quasars from the SDSS-III BOSS DR9 quasar catalog. While the P v-detected quasars are distributed similarly in redshift and luminosity as the overall BAL population (Fig. 4), they tend to have slightly redder colours (Fig. 6).
While our selection procedure and contamination by the Lyα forest produces a bias towards finding only strong P v absorption, the absorption in other species, such as C iv and Si iv, is generally stronger than in the average BAL quasar. This is seen clearly when comparing the BI and REW dis-tribution of all BAL quasars to just the quasars with P v detections (Fig. 5), as well as in the composite spectra of the two populations (e.g. Fig. 9). In fact, Si iv is present in nearly all (96%) of our P v detections, whereas it is only detected in 55% of the parent BAL population (Section 3.1; see also Filiz Ak et al. 2014).
Figure 12. A grid of individual absorption features in the com-posite spectra shown in Figs 10 and 11. Zero velocity is set to the midpoint in each of these doublets. The dotted vertical lines are the nominal positions of the individual doublet components.
P v, and to a lesser extent S iv and S vi, are low-abundance ions, and detections of these lines are important for constraining outflow energetics. The presence of absorp-tion in these low abundance ions in BAL spectra indicates that other lines, such as C iv and Si iv are saturated. Pre-vious studies using photoionization modeling, and the as-sumption of solar abundances, have found that the optical
depth in C iv is much higher than in these low abundance ions. In particular, Dunn et al. (2012) show that the optical depth of C iv is ∼30 to 40 times greater than the optical depth of S iv, and various works have found that the C iv optical depth is at least ∼100 to ∼1200 times greater than the optical depth of P v (Hamann 1998; Leighly et al. 2009, 2011; Borguet et al. 2012). Thus, the presence of P v and S iv indicates saturated C iv lines, and saturated absorption lines are shaped by the covering fraction of the outflow rela-tive to the continuum radiation source, and not by the opti-cal depth of the line. Therefore, in cases where C iv does not reach zero intensity at the same outflow velocities as the P v and/or S iv absorption, the outflow is only partially covering the continuum source. All of this indicates that the column densities of the flows are much larger than inferred based on the C iv profile alone, with values of log NH determined to
be >22 cm−2.
It is possible, however, that absorption lines that do not reach zero intensity do completely cover the background continuum source, but the BAL troughs do not reach zero because of scattered continuum light from a more extended region. This idea is consistent with some polarization data that reveal, in some cases, higher degrees of polarization in BAL troughs compared to the adjacent continuum (Ogle et al. 1999; Lamy & Hutsem´ekers 2000, 2004; Brotherton et al. 2006, and refs therein). However, we present examples where P v absorption indicates saturated C iv absorption and thus a velocity-dependent covering fraction across the profile. This is inconsistent with the scenario of scattered light filling in the BAL troughs because it is unlikely that scattered light would produce such a velocity-dependent structure. In any case, whether or not the outflow completely covers the background source, the P v absorption still indi-cates saturated C iv absorption and large column densities. Capellupo et al. (2014) use an estimate of the column density in one quasar, based on the detection of strong P v absorption, along with an estimate of the distance of the flow based on corresponding variability in P v and clearly saturated C iv absorption, to estimate the energetics of the flow. A column density, NH, of 2 × 1022cm−2and a distance
of 3.5 pc give a total mass of 4100 M , an outflow rate of 12 M yr−1, and a kinetic energy luminosity of 4 × 1044 ergs
s−1. This value is roughly 2% of the bolometric luminosity of the quasar, and is similar to the values quoted for a flow to have a significant impact on its host galaxy via feedback (e.g. Scannapieco & Oh 2004; Hopkins & Elvis 2010). The P v absorption in Capellupo et al. (2014) has an estimated optical depth up to ∼1.5. In the current work, where we iden-tify cases in which the P v absorption has a resolved doublet with a one-to-one depth ratio (e.g., J013802+012424), the optical depth can be at least 2 times larger, giving even larger column densities, mass-loss rates, and kinetic energy than found in Capellupo et al. (2014).
In the current work, we find ‘definite’ or ‘probable’ de-tections of P v in ∼6% of the BAL quasars in our parent sample. Furthermore, the presence of absorption at the lo-cation of P v in the composite spectrum of all BAL quasars minus these P v detections (Fig. 12, light blue curve) in-dicates there are a number of instances of P v absorption that we missed. In fact, Herbst et al., in preparation, detect P v absorption even in composite spectra of just weak C iv BALs, indicating that P v absorption may be more common
than our individual P v detections indicate. It is also un-known whether the detection of P v absorption depends on our line of sight to the flow. Therefore, a significant num-ber of BAL outflows might have column densities similar to those of the quasar studied in Capellupo et al. (2014), whether or not they show P v absorption (although, BAL variability studies often show BALs at different velocities varying in concert, which supports the idea of a lower col-umn density outflow that is more susceptible to changes in the global ionizing flux; see e.g. Filiz Ak et al. 2014).
With the detection of P v giving a lower limit on the column density of the flow, the main remaining variable in determining the energetics is the distance of the flow. Out-flows likely exist at a range of distances, and larger distances yield higher kinetic luminosity estimates for a given column density (e.g. Capellupo et al. 2014; Chamberlain et al. 2015). As mentioned in Section 4, the composite spectra show a weakening He ii emission line from the non-BAL quasar population to the BAL quasars to the P v quasars. A weaker He ii suggests there are fewer far-UV photons available to produce the He ii line, indicating a softer far-UV SED. More-over, there is evidence of intrinsic X-ray weakness in some BAL quasars, as compared to non-BAL quasars (Luo et al. 2014). A harder spectrum would more highly ionize the out-flowing gas, lowering its opacities and making it more diffi-cult to accelerate (Baskin et al. 2013). Our results suggest that a softer far-UV continuum, identified by weaker He ii emission, can help to drive larger column density, more pow-erful outflows.
The skew towards redder colours in P v-detected quasars, as well as a much higher incidence of low-ionization absorption among P v-detected quasars, indicates an over-lap between the populations of LoBAL quasars and quasars with strong P v absorption, as LoBALs also tend to have red-der colours than the overall BAL population (Gibson et al. 2009). LoBALs are sometimes attributed to a younger stage of quasar evolution, with higher accretion rates and, per-haps, more powerful outflows in young, dusty host galaxies (Urrutia et al. 2009; Glikman et al. 2012, and references therein). Another possibility is that LoBALs are the re-sult of orientation effects, where lower degrees of ionization and more dust extinction appear along lines of sight nearer the accretion disc plane (Hamann & Sabra 2004; Baskin et al. 2013; and figure 16 of Filiz Ak et al. 2014). Either of these interpretations could apply to quasars with P v absorption. The large column densities and more powerful outflows that P v absorption suggests could occur either in younger quasars or along sightlines closer to the accretion disc plane.
Further investigations utilizing the large sample of P v detections in this work will help to answer some of the re-maining questions on the typical energetics of BAL flows.
ACKNOWLEDGMENTS
We thank the referee for helpful comments on the manuscript. FH and HH acknowledge support from the USA National Science Foundation (NSF) grant AST-1009628. WNB acknowledges support from NSF grant AST-1516784. Funding for SDSS-III has been provided by the Al-fred P. Sloan Foundation, the Participating Institutions,
the National Science Foundation, and the U.S. Depart-ment of Energy Office of Science. The SDSS-III web site is http://www.sdss3.org/.
SDSS-III is managed by the Astrophysical Research Consortium for the Participating Institutions of the SDSS-III Collaboration including the University of Arizona, the Brazilian Participation Group, Brookhaven National Lab-oratory, Carnegie Mellon University, University of Florida, the French Participation Group, the German Participation Group, Harvard University, the Instituto de Astrofisica de Canarias, the Michigan State/Notre Dame/JINA Partici-pation Group, Johns Hopkins University, Lawrence Berke-ley National Laboratory, Max Planck Institute for Astro-physics, Max Planck Institute for Extraterrestrial Physics, New Mexico State University, New York University, Ohio State University, Pennsylvania State University, University of Portsmouth, Princeton University, the Spanish Partic-ipation Group, University of Tokyo, University of Utah, Vanderbilt University, University of Virginia, University of Washington, and Yale University.
REFERENCES
Ahn C. P., Alexandroff R., Allende Prieto C., Anderson S. F., Anderton T., Andrews B. H., Aubourg ´E., Bailey S., Balbinot E., Barnes R., et al. 2012, ApJS, 203, 21 Arav N., Becker R. H., Laurent-Muehleisen S. A., Gregg
M. D., White R. L., Brotherton M. S., de Kool M., 1999, ApJ, 524, 566
Asplund M., Grevesse N., Sauval A. J., Scott P., 2009, ARA&A, 47, 481
Baldwin J. A., 1977, ApJ, 214, 679
Baskin A., Laor A., Hamann F., 2013, MNRAS, 432, 1525 Bolton A. S., Schlegel D. J., Aubourg ´E., Bailey S., Bhard-waj V., Brownstein J. R., Burles S., Chen Y.-M., Dawson K., Eisenstein D. J., Gunn J. E., Knapp G. R., et al. 2012, AJ, 144, 144
Borguet B. C. J., Arav N., Edmonds D., Chamberlain C., Benn C., 2013, ApJ, 762, 49
Borguet B. C. J., Edmonds D., Arav N., Benn C., Cham-berlain C., 2012, ApJ, 758, 69
Brotherton M. S., De Breuck C., Schaefer J. J., 2006, MN-RAS, 372, L58
Brotherton M. S., Tran H. D., Becker R. H., Gregg M. D., Laurent-Muehleisen S. A., White R. L., 2001, ApJ, 546, 775
Cameron E., 2011, PASA, 28, 128
Capellupo D. M., Hamann F., Barlow T. A., 2014, MN-RAS, 444, 1893
Capellupo D. M., Hamann F., Shields J. C., Halpern J. P., Barlow T. A., 2013, MNRAS, 429, 1872
Capellupo D. M., Hamann F., Shields J. C., Rodr´ıguez Hi-dalgo P., Barlow T. A., 2011, MNRAS, 413, 908
Chamberlain C., Arav N., Benn C., 2015, MNRAS, 450, 1085
Dawson K. S., Schlegel D. J., et al. 2013, AJ, 145, 10 Dunn J. P., Arav N., Aoki K., Wilkins A., Laughlin C.,
Edmonds D., Bautista M., 2012, ApJ, 750, 143
Dunn J. P., Bautista M., Arav N., Moe M., Korista K., Costantini E., Benn C., Ellison S., Edmonds D., 2010, ApJ, 709, 611
Eisenstein D. J., Weinberg D. H., Agol E., Aihara H., Al-lende Prieto C., Anderson S. F., Arns J. A., Aubourg ´E., Bailey S., Balbinot E., et al. 2011, AJ, 142, 72
Filiz Ak N., Brandt W. N., Hall P. B., Schneider D. P., Trump J. R., Anderson S. F., Hamann F., Myers A. D., Pˆaris I., Petitjean P., Ross N. P., Shen Y., York D., 2014, ApJ, 791, 88
Gabel J. R., Crenshaw D. M., Kraemer S. B., Brandt W. N., George I. M., Hamann F. W., Kaiser M. E., Kaspi S., Kriss G. A., Mathur S., Mushotzky R. F., Nandra K., Netzer H., Peterson B. M., Shields J. C., Turner T. J., Zheng W., 2003, ApJ, 583, 178
Gibson R. R., Jiang L., Brandt W. N., Hall P. B., Shen Y., Wu J., Anderson S. F., Schneider D. P., Vanden Berk D., Gallagher S. C., Fan X., York D. G., 2009, ApJ, 692, 758 Glikman E., Urrutia T., Lacy M., Djorgovski S. G., Ma-habal A., Myers A. D., Ross N. P., Petitjean P., Ge J., Schneider D. P., York D. G., 2012, ApJ, 757, 51
Gunn J. E., Siegmund W. A., Mannery E. J., Owen R. E., Hull C. L., Leger R. F., Carey L. N., Knapp G. R., York D. G., Boroski W. N., Kent S. M., Lupton R. H., et al. 2006, AJ, 131, 2332
Hall P. B., Anosov K., White R. L., Brandt W. N., Gregg M. D., Gibson R. R., Becker R. H., Schneider D. P., 2011, MNRAS, 411, 2653
Hamann F., 1998, ApJ, 500, 798
Hamann F., Sabra B., 2004, in Richards G. T., Hall P. B., eds, AGN Physics with the Sloan Digital Sky Survey Vol. 311 of Astronomical Society of the Pacific Confer-ence Series, The Diverse Nature of Intrinsic Absorbers in AGNs. p. 203
Harris D. W., Jensen T. W., Suzuki N., Bautista J. E., Dawson K. S., Vivek M., Brownstein J. R., Ge J., Hamann F., Herbst H., Jiang L., Moran S. E., Myers A. D., Olm-stead M. D., Schneider D. P., 2016, AJ, 151, 155
Hopkins P. F., Elvis M., 2010, MNRAS, 401, 7
Junkkarinen V., Beaver E. A., Burbidge E. M., Cohen R. D., Hamann F., Lyons R. W., 1997, in N. Arav, I. Shlos-man, & R. J. Weymann ed., Mass Ejection from Ac-tive Galactic Nuclei Vol. 128 of Astronomical Society of the Pacific Conference Series, On the Phosphorus Over-abundance in the BAL QSO PG 0946+301. p. 220 Lamy H., Hutsem´ekers D., 2000, A&A, 356, L9 Lamy H., Hutsem´ekers D., 2004, A&A, 427, 107
Leighly K. M., Dietrich M., Barber S., 2011, ApJ, 728, 94 Leighly K. M., Hamann F., Casebeer D. A., Grupe D.,
2009, ApJ, 701, 176
Luo B., Brandt W. N., Alexander D. M., Stern D., Teng S. H., Ar´evalo P., Bauer F. E., Boggs S. E., Christensen F. E., Comastri A., et al. 2014, ApJ, 794, 70
Misawa T., Eracleous M., Charlton J. C., Kashikawa N., 2007, ApJ, 660, 152
Moe M., Arav N., Bautista M. A., Korista K. T., 2009, ApJ, 706, 525
Ogle P. M., Cohen M. H., Miller J. S., Tran H. D., Goodrich R. W., Martel A. R., 1999, ApJS, 125, 1
Pˆaris I., Petitjean P., Aubourg ´E., Bailey S., Ross N. P., Myers A. D., et al. 2012, A&A, 548, A66
Pˆaris I., Petitjean P., Rollinde E., Aubourg E., Busca N., Charlassier R., Delubac T., Hamilton C., Le Goff J.-M., Palanque-Delabrouille N., Peirani S., Pichon C., Rich J., Vargas-Maga˜na M., Y`eche C., 2011, A&A, 530, A50
Prochaska J. X., Hennawi J. F., 2009, ApJ, 690, 1558 Reichard T. A., Richards G. T., Schneider D. P., Hall P. B.,
Tolea A., Krolik J. H., Tsvetanov Z., Vanden Berk D. E., York D. G., Knapp G. R., Gunn J. E., Brinkmann J., 2003, AJ, 125, 1711
Rodr´ıguez Hidalgo P., Eracleous M., Charlton J., Hamann F., Murphy M. T., Nestor D., 2013, ApJ, 775, 14 Rodr´ıguez Hidalgo P., Hamann F., Hall P., 2011, MNRAS,
411, 247
Ross N. P., Myers A. D., Sheldon E. S., Y`eche C., Strauss M. A., Bovy J., Kirkpatrick J. A., Richards G. T., Aubourg ´E., Blanton M. R., Brandt W. N., Carithers W. C., et al. 2012, ApJS, 199, 3
Scannapieco E., Oh S. P., 2004, ApJ, 608, 62
Smee S. A., Gunn J. E., Uomoto A., Roe N., Schlegel D., Rockosi C. M., Carr M. A., Leger F., Dawson K. S., Olm-stead M. D., et al. 2013, AJ, 146, 32
Sprayberry D., Foltz C. B., 1992, ApJ, 390, 39
Trump J. R., Hall P. B., Reichard T. A., Richards G. T., Schneider D. P., Vanden Berk D. E., Knapp G. R., An-derson S. F., Fan X., Brinkman J., Kleinman S. J., Nitta A., 2006, ApJS, 165, 1
Turnshek D. A., 1988, in Blades J. C., Turnshek D. A., Norman C. A., eds, Proceedings of the QSO Absorption Line Meeting BAL QSOs - Observations, models and im-plications for narrow absorption line systems. pp 17–46 Urrutia T., Becker R. H., White R. L., Glikman E., Lacy
M., Hodge J., Gregg M. D., 2009, ApJ, 698, 1095 Weymann R. J., Morris S. L., Foltz C. B., Hewett P. C.,
1991, ApJ, 373, 23
Wright E. L., Eisenhardt P. R. M., Mainzer A. K., Ressler M. E., et al. 2010, AJ, 140, 1868
York D. G., Adelman J., Anderson Jr. J. E., Anderson S. F., Annis J., Bahcall N. A., Bakken J. A., Barkhouser R., Bastian S., Berman E., et al. 2000, AJ, 120, 1579
APPENDIX A: LIST AND PROPERTIES OF ‘PROBABLE’ DETECTIONS
This paper has been typeset from a TEX/ LATEX file prepared
Table A1. Properties of quasars with ‘probable’ P v detections
SDSS Coord. Name zem imag BI REW(C iv) REW(Si iv) REW(Al iii)
(km s−1) (˚A) (˚A) (˚A) J001610.79+013608.0 2.839 19.7 1363±73 J001824.95+001525.8 2.443 19.4 7139±118 46.9 17.1 0.0 J002417.61+000846.2 4.000 20.2 4179±245 0.0 22.8 8.9 J003859.34−004252.2 2.495 20.1 9393±84 49.4 30.9 0.0 J003937.53+043025.6 2.819 20.2 4752±277 19.1 24.7 9.4 J004429.13−015601.1 2.375 19.6 2981±39 21.9 6.7 0.0 J005125.63+023923.4 3.050 21.0 1381±328 J005708.72+032251.1 2.928 20.6 4841±1520 J010124.98+023949.4 2.619 21.1 1889±135 J011124.65+084442.2 2.641 20.7 1140±301 J011301.52−015752.6 3.095 20.5 1911±238 J013413.22−023409.7 2.394 19.4 5495±59 36.0 7.9 0.0 J013442.35+001452.4 3.207 20.6 3167±48 21.8 8.9 0.0 J014141.32+011205.7 3.157 20.6 1715±74 23.5 15.2 0.0 J015949.48+063932.1 2.865 20.9 258±26 J022007.64−010731.1 3.423 18.2 5641±6 47.7 8.1 0.0 J073656.27+440308.7 2.700 19.9 1232±8 10.3 0.0 0.0 J073751.52+455140.5 2.390 19.6 3809±36 27.2 16.3 0.0 J074734.15+152153.0 2.395 20.5 1359±32 J075014.40+432635.2 3.173 19.2 5743±64 34.0 13.6 0.0 J080343.77+462345.9 2.458 20.3 3758±88 J080904.19+505543.9 3.118 20.8 3904±474 J081208.62+534800.3 2.590 19.2 3321±28 22.2 0.0 0.0 J081410.14+323225.1 3.602 20.2 4445±150 29.3 3.9 0.0 J081454.35+422453.4 2.350 19.9 1686±12 J081508.91+122401.2 2.798 20.9 3101±248 J081608.28+210213.2 3.019 18.8 5536±50 33.5 16.3 0.0 J082227.60+404153.9 2.955 20.6 6899±670 39.9 17.3 0.0 J082249.76+322712.3 2.495 18.9 2606±6 21.3 9.7 0.0 J082543.23+383829.2 2.996 20.1 3362±58 20.2 12.6 0.0 J083120.08+355833.8 3.079 20.9 1114±40 J083715.90+001521.6 2.449 19.0 6013±28 38.3 17.8 0.0 J090035.30+040846.4 2.809 20.3 4250±92 23.8 15.9 0.0 J090658.65+021729.2 2.655 20.7 4178±134 J093442.60−001648.9 2.883 20.7 3300±358 J093707.90−001041.8 2.531 19.9 3459±245 J094431.33+033411.6 3.006 19.5 4324±89 27.7 19.0 0.0 J094633.97+365516.8 2.855 19.1 2721±139 11.6 18.9 0.0 J094906.04+011249.9 2.743 19.1 3110±27 20.5 15.1 0.0 J095333.70+033623.7 3.268 19.8 6773±330 38.6 32.7 0.0 J095442.89+432512.0 2.478 19.3 14542±140 40.0 37.0 33.2 J095508.25+014627.6 2.607 19.3 3575±16 27.6 12.3 0.0 J100047.38+050203.7 2.645 20.6 3441±206 J100049.54−005118.2 2.935 19.5 2021±33 25.0 2.6 0.0 J101412.56+394135.7 3.269 19.7 4880±151 34.6 23.4 0.0 J102251.29+031529.4 3.583 20.6 2167±510 J104059.79+055524.4 2.454 19.3 5038±58 12.3 25.6 11.2 J104247.56+061521.4 2.523 20.6 1935±50 J105111.79+420356.8 2.932 20.1 9993±519 48.1 25.8 0.0 J111541.03+335202.6 2.889 20.4 3183±423 J112548.79+004547.1 3.264 21.1 1820±39 J114548.38+393746.6 3.119 17.7 2520±3 21.2 9.3 0.0 J114926.79+321902.6 3.228 20.0 7222±352 39.7 23.3 3.0 J120447.15+330938.7 3.610 18.4 13721±18 51.9 64.5 42.3 J120704.75+033243.9 2.713 20.4 1547±56 J120834.84+002047.7 2.683 18.3 417±2 J121858.15+005053.7 3.120 20.1 6801±185 40.1 21.0 0.0 J122254.15+061041.3 2.441 19.7 8786±128 49.1 20.9 0.0 J124526.35+341956.5 3.588 20.7 525±12 J130101.92+382654.2 2.813 20.0 4187±649 J131037.33+062347.8 3.040 19.3 2053±46 7.4 11.6 3.2 J131333.01−005114.3 2.940 19.2 3710±139 31.4 22.0 7.4
Table A1. continued...
SDSS Coord. Name zem imag BI REW(C iv) REW(Si iv) REW(Al iii)
(km s−1) (˚A) (˚A) (˚A) J132004.70+363830.1 2.774 19.3 4663±140 36.6 20.7 0.0 J132139.86−004151.9 3.091 18.7 4755±39 31.9 36.9 5.1 J134504.32+071349.0 3.048 21.3 397±103 J140105.31+062917.8 2.383 19.4 4897±151 34.8 16.2 9.9 J140453.03+035544.9 2.800 19.1 2190±85 19.6 9.6 0.0 J140532.90+022957.3 2.832 18.2 5903±19 39.3 12.6 0.0 J141017.57−010657.7 2.817 20.5 4832±75 30.0 19.2 0.0 J141934.64+050327.1 2.496 19.4 3526±22 20.8 10.7 0.0 J145252.35+061827.4 3.096 19.8 4462±113 27.3 8.9 0.0 J151102.00+012659.0 2.924 19.1 4563±67 29.6 15.8 2.2 J151211.22+012807.1 2.705 19.7 2673±33 8.3 15.2 6.7 J153124.37+213305.4 2.972 19.7 11782±387 38.4 27.7 17.7 J153252.96+023217.2 2.712 19.3 3225±55 38.7 21.8 3.9 J153637.33+060631.1 2.475 20.6 2849±210 J154435.61−001928.0 2.659 19.1 1851±28 17.0 8.0 0.0 J155514.85+100351.3 3.505 18.3 8405±19 36.9 30.7 24.0 J161626.54+121955.7 2.975 19.6 5610±110 23.3 41.1 18.2 J163402.87+251635.4 2.602 19.7 1794±8 12.7 5.7 0.0 J165905.52+342937.5 2.531 20.5 2765±170 J211137.38−023941.9 3.180 18.4 6083±44 37.0 31.7 3.8 J214244.85+004528.2 2.498 19.2 3437±12 23.3 11.0 0.0 J222725.45−000936.1 2.566 19.6 5604±19 32.2 20.1 3.2 J231656.44−002240.9 3.057 21.0 3314±615 J235859.51+020847.5 2.921 19.0 5389±83 31.4 12.6 0.0