Publisher’s version / Version de l'éditeur:
Vous avez des questions? Nous pouvons vous aider. Pour communiquer directement avec un auteur, consultez la première page de la revue dans laquelle son article a été publié afin de trouver ses coordonnées. Si vous n’arrivez pas à les repérer, communiquez avec nous à [email protected].
Questions? Contact the NRC Publications Archive team at
[email protected]. If you wish to email the authors directly, please see the first page of the publication for their contact information.
https://publications-cnrc.canada.ca/fra/droits
L’accès à ce site Web et l’utilisation de son contenu sont assujettis aux conditions présentées dans le site LISEZ CES CONDITIONS ATTENTIVEMENT AVANT D’UTILISER CE SITE WEB.
Building Research Note, 1984-05
READ THESE TERMS AND CONDITIONS CAREFULLY BEFORE USING THIS WEBSITE. https://nrc-publications.canada.ca/eng/copyright
NRC Publications Archive Record / Notice des Archives des publications du CNRC : https://nrc-publications.canada.ca/eng/view/object/?id=1eacf48a-efd7-42cb-902a-699493402b56 https://publications-cnrc.canada.ca/fra/voir/objet/?id=1eacf48a-efd7-42cb-902a-699493402b56
NRC Publications Archive
Archives des publications du CNRC
This publication could be one of several versions: author’s original, accepted manuscript or the publisher’s version. / La version de cette publication peut être l’une des suivantes : la version prépublication de l’auteur, la version acceptée du manuscrit ou la version de l’éditeur.
For the publisher’s version, please access the DOI link below./ Pour consulter la version de l’éditeur, utilisez le lien DOI ci-dessous.
https://doi.org/10.4224/40000504
Access and use of this website and the material on it are subject to the Terms and Conditions set forth at
NRCC passive solar test facility: description and data reduction
NATIONAL RESEARCH COUNCIL CANADA D I V I S I O N O F RUILDLNG RESEARCH
NRCC PASSIVE SOLAR TEST FACILITY DESCRIPTION AND DATA REDUCTION
Ottawa May 1984
NRCC PASSIVE SOLAR TEST
FACILITY
DESCRIPTION AND DATA REDUCTION by
S.A. Barakat
R e l i a b l e experimental d a t a on passive solar heated b u i l d i n g s a r e needed to p e r m i t assessment of their performance, a s well as to a2d i n t h e
developmenr of new design methods. Experimental data were c o l l e c t e d f o r two h e a t i n g seasons at t h e p a s s f v e solar t e s t f a c i l i t y of t h e D i v i s i o n of
Building Research, National Research Council o f Canada. The f a c i l i t y
consisted of t h r e e two-zone and four s i n g l r z o n e d i r e c t - g a i n u n i t s and one mass-wall unit.
This
report describes t h e facility and t h e data acquisition method. it a l s o p r e s e n t s the method used t o analyse the d a t a to o b t a i n variousperformance f a c t o r s a n d discusses the u n c e r t a i n t i e s associated with the measured and the c a l c u l a t e d values,
NOMENCLATURE
A Windownet glass area, m 2 C T h e r m a l capacity, W/K
c S p e c i f i c heat of air, W.h/kg.K P
E Space heating energy commnption, kW.h F Solar h e a t g a l n coefficient
F Purchased h e a t i n g fraction h
G
Solar gain through window, kW.h SGLR Gain-Load ratio
H Solar r a d i a t t s n incident on window,
kW.h
MGR
Mass-gain tatto, 1 / RN Number o f hours
in
monitoring p e r i o d v T o t a l heat vented from U n i t , kW.h QL T o t a l h e a t Loss, kW.hNet heat g a i n , kW*h
Q~~
N e t effective h e a t gain, kW-h
9,
Useful solar gain, kW.hQR
Reference heat l o s s , kW.hR EquivaLent wall thermal resfstaace, m2-K/w e
Ti
Average indoor air temperature,'
C
T
Average o u t d o o r air temperature, OC0
T
Thermostat setting, OCs e t
UA Heat l o s s c o e f f i c i e n t , W/K
V
Volumetric air flaw through v e n t i n g fan, m3/hp Density of air, kg/m3
1. INTRODUCTION
A passive s o l a r test f a c i l i t y was constructed at t h e D i v i s i o n of
B u i l d i n g Research to f u l f i l l t h e f o l l o w i n g o b j e c t i v e s :
1 . To produce data on the thermal performance of structures u t i l i z i n g
various p a s s i v e s o l a r h e a t i n g techniques.
2. To verify the thermal performance predicted by computer simulation programs which, in turn, a l l o w p a r a m e t r i c a n a l y s i s o f b u i l d i n g d e s i g n strategies.
3 . To aid i n the development o f s i m p l e procedures that take solar g a i n and thermal storage into account i n c a l c u l a t i n g t h e space heating
requirements of b u i l d i n g s .
4. To determine the effect of thermal mass on the dynamic Lhermal
characteristics of buildings.
7 3 % ~ report d e s c r i b e s the t e s t f a c i l i t y , the data acquisition method, and t h e method u s e d to a n a l y z e the data t o o b t a i n various performance
f a c t o r s . A second report (1) summarizes the thermal performance of a l l
d i r e c t - g a i n t e s t units for two heating seasons, while a t h i r d (23 presents
t h e mass
w a l l
results and d r a w s a comparison between t h e direct-gain and t h emass w a l l p a s s i v e solar heating systems.
2 . THE TEST FACLLITf
2,1 l l e s c r i p t i o r l of Test U n i t s
The teat f a c i l i t y , d e s c r i b e d in d e t a i l in Reference 3 a n d shown in Figure
1,
c o n s i s t s of three h u t s d i v i d e d i n t o four 2 z o n e units(unit
1 toUnit 4 ) and four single-toam units ( R l t o
R4).
I n d i v i d u a l rooms in t h e2-zone units are d e s i g n a t e d as s o u t h ( e g . 1s) o r norith ( e g g . 4N). Each hut
c o n s i s t s of a one-storey i n s u l a t e d wood-frame superstructure over a
basemenL. Construction d e t a i l s a r e g i v e n i n Figure 2 and the thermal
resistance values of walls and c e i l i n g , in Table 1. To eliminate outdoor a i r infiltration, a slight positive pressure is m a i n t a i n e d in a l l rooms,
u s i n g c o r r i d o r a i r at t h e same temperature as air in the
tesr
raom,Each of t h e two-zone u n i t s i s d i v i d e d i n t o a south and a north room w i t h a connecting door. Each south room h a s a s o u t k f acing window of 2.6 m 2
n e t glass area; each n o r t h r o o m has a 1 m 2 window f a c i n g north. The three
two-zone '%%reek-gain" units ( U n i t s 1, 2 and 3 ) d i f f e r only in the type and
amount of thermal mass used as i n t e r i o r finish inside t h e i n s u l a t i o n , as g i v e n in T a b l e 2. The "mass w a l l " unit: (Unit 4 ) h a s the same l l g h t i n t e r i o r f i n i s h as Unit 1 b u t h a s , in addition, a mass wall located just inside the
south window. This
wall,
of s o l i d concrete b r i c k s , 1s 305 mm t h l c k and has two 4 0 6 x 7 6 mm vent h o l e s at b o t h t h e top and bottom.The thermal i n t e r a c t i o n between a s u n l i t south room and t h e remainder
o f a h o u s e can be examined in the E a c i l i t y by monitoring each test unit i n t w o
modes
of operation:in
Mode 1 the w i t is monktored as two separaterooms; in Mode 2 the connecting door is opened and a i r i s
c i r c u l a t e d
betweenthe
t w o room u s i n g asmall
fan (47 L / s ) l o c a t e d above t h e door.The four single-room t e s t units (units R 1 to R 4 ) have t h e same i n t e r i o r f i n i s h as U n i t 1 . Each r o o m has a window of 2.6 m 2 n e t g l a s s area f a c i n g one of t h e four c a r d i n a l d i r e c t i o n s (Ftgure I ) .
Each room i n the t e s t f a c i l i t y is heated to 20°C with an e l e c t r i c
baseboard heater. Tn addition, the south room of each two-zone unit and
three of t h e single-room a n i t s (R1, R 2 and R3) ate e q u i p p e d wlth an exhaust Ean to cool the room w i t h outdoor a i r whenever the room temperature reaches 27 "6.
The
test f a c i l i t y was completed i n September1980.
Data on t h eperformance of the eight test units were c o l l e c t e d during t h e 1980181
h e a t i n g season. During the. f a l l ~ w i n g summer, an exterior layer of
insulation w a s added ta the walls and ceilfngs sf all test h u t s ( t h e new
thermal reststance values are given in Table 1). In December 1981, an
i n s u l a t i n g c u r t a i n was installed in t h e g a p between the w i n d o w and the mass wall
in
U n i t 4. Data were gathered for the 1981182 heating season.2.2 Measurements
and
Data AcquFsi t i o nA summary of measurements and t h e associated instrumentation is given in T a b l e 3. The average iddaar a i r temperature of each room w a s measured,
as well as the average temperature of t h e i n s i d e and outside surfaces of t h e mass w a l l , and t h e temperature of t h e attic a i r , corridor air, v e n t i l a t i o n
f a n inlet air and the air flowing through the v e n t h o l e s of the mass
wall.
O t h e r measurements i n c l u d e s o l a r radiation i n c i d e n t on the horilzontal surface, the south-facing and the north-facing v e r t i c a l s u r f a c e s , and thed i r e c t normal component of t-he solar r a d i a t i o n .
In
a d d i t i o n , the electric space heating energy consumption of each space and the energy consumption of t h e ventilation f a n s are measured. Wind speed and d i r e c t i o n a r e alsomeasured. The air flow r a t e through each ventilation fan is measured at the s t a r t of each h e a t i n g season.
A data logger scans and records the d a t a on magnetic tape. Wind data,
radiation and temperature values a r e scanned every minute, averaged every 15 minutes and recorded. Energy consumption values are accumulated and r e c o r d e d on magnetic tape every 15 minutes.
3. DATA
ANALYSIS
On a weekly basis, the recorded d a t a are transferred t o the main NRC computer for
processing.
They are checked f o r missing records, power f a i l u r e and alarm f l a g s . Conversion factors are applied before d a t a are copied to another tape and plotted f o r visual inspectfon. The data are then averagedo r
totaled hourly and stored f o r further processing. Figures 3 t o 6 give an example o f data obtained during a one week period.The following performance parameters and f a c t o r s are calculated f o r each mode af operation:
3.1
Solar GafnThe
s o l a r
gain through t h e window( G ~ )
is c a l c u l a t e d as,where
,
F = solar heat gain coefficient for t h e period
H = t o t a l s o l a r radiation incident on the window, kw.h/mZ
A
= window n e t g l a s s area, m2.The solar heat gain coefficient (F) represents the sum of the solar
r a d i a t i o n transmi rted through t h e g l a s s and the inward flowing fraction of
s o l a r r a d i a t i o n absorbed by t h e glazing, Values o f t h e solar heat gain
coefficient a r e d e t e r m i n e d for each month f o r different ortentations using
t h e calculatfon procedure p r e s e n t e d in Reference 4, 3.2 Cooling Energy
The t o t a l heat vented from t h e unit
(Q
) i s calculated as,V
where
,
p = density of air, kg/m3
c = s p e c i f i c heat of air, w.hJkg.~ V
' = volumetric f l o w rate of air through v e n c i n g f a n , m3/h
T
= average temperature of air at f a n inlet, "C YTo = average outdoor a i r temperature, OC At = fan on-time, h.
The
ventilation f a n on-time pertod (At) was determined by dividing t h efan energy consumption by t h e energy consumption during one hour of
continuous operation.
The
latter was d e t e r m i n e d by c a l i b r a t i o n prior t o t h e h e a t i n g season.3 - 3 Total Heat Loss
Over a p e r i o d , t h e total heat l o s s from a u n i t ( Q ~ ) is equal t o t h e unvcnted portion of t h e s o l a r gain p l u s the total electrical energy
consumption by t h e space heater and the a i r c i r c u l a t i o n f a n (when operating
in Mode
2).
Therefore, a h e a t balance for a room yields,where
,
QL
= total heat loss through walls, windows and c e i l i n g , kW.h E = total space h e a t i n g energy consumption, kW.h.The h e a t loss coefficient
(UA)
can then b e c a l c u l a t e d a s ,where Ti and
T are
the average indoor and outdoor air temperatures d u r i n g at h e
period
respectively, and N is t h e number o f hours in t h e period.The above procedure does not a p p l y for the mass-wall anit since the soLar gain is not collected d i r e c t l y i n t h e room. &tailed d i s c u s s i o n of calculating the heat: loss coeff~cients is presented
in
Appendix A, For them a s s - w a l l wnir, t h e l o s s coefficient i s determined by regression from the experimental data, and the heat loss is calculated as,
QL
= UA(Ti
-
To)
N3 . 4 Reference Heat Loss
This is the heat loss calculated at thermostat setting (20°C):
3.5
Useful Solar GainThis is t h e portion of the solar g a i n that c e n t s i b a k s directly t o the reduction in purchased h e a t i n g requirement.
It
i n c l u d e s the s o l a r g a i n u s e dto offset heat losses, p l u s t h e portion stored in the thermal mass
and
used to offset l o s s e s at a l a t e r t i m e . It does n o t i n c l u d e t h e excess gain that must be vented to prevent room temperature from exceeding a preset maximum,nor any g a i n utilized to o f f s e t additional losses caused by a r i s e in room
temperature above
t h e
thermostats e t t i n g .
The
useful solar gainCQ,)
can be calculated by subtracting these additional l o s s e s f ram t h e unvented portion of the solar gain:For t h e mass-wall u n i t t h e useful solar g a t n i s c a l c u l a t e d as,
3.6 Window Net Heat Gain
The n e t heat g a i n through a
windew
(QN)
is defined as the differencebetween the s o l a r energy admitted through the window and i t s conduction, convection and r a d i a t i o n losses. A t a s p e c i f i c location and orientatton the n e t gain is a characteristic of the window type only. Therefore,
3.7 N e t EESec~ive Gain
This is defined as t h e d i f f e r e n c e between the u s e f u l s o l a r gain and t h e window
combined
reference losses. Thenet
effective g a i n (QNE) of a window is, therefore, calculated a s ,From Equations ( 6 ) and ( 8 ) , t h e roam heat balance can be w r i t t e n as,
-
-
QR + QR-
QswallsJceiling window
Equation (11) shows that QNE is a measure of the net a c t u a l contribution of the
window
to the heating requirement.It
is also a measure o f theperformance of the window r e l a t i v e to a " n o - l o s s ' b r a d i a b a t f c wall. The
n e t effective gain may b e equal to or less t h a n t h e n e t gaPn, depending on the u t i l i z a r i o n of the solar gain. The net effective g a i n i s , therefore,
a
function of tlhe b u i l d i n g parameters ( l o a d and mass) as w e l l as t h e window type and orientation.
3.8 E q u i v a l e n t
Wall
Thermal ResistanceR, is the thermal resistance
of
an i n s u l a t e d wall t h a t has t h e same h e a t l a s s as the window net effective gain. It is meaning£ ul o n l y when the net effective gain has a negative v a l u e . In such a case,where
Aw
is thewindow
area.3 , 9 Solar U t i l i z a t i o n Factor
The solar utilization factor
(ns)
is defined as t h a t : f r a c t i o n of the total solar gaTn r h r o u g h all windows sf a house that contributes t o t h e r e d u c t i o n of the heating requirement ( 5 ) := Useful solar gafn
-
Qss T o t a l solar g a i n Gs
3.10 Gain-toad Ratio
This is the r a t i o (GLR) of the s o l a r gain through a11 windows
(Gs)
t o the reference heat loss(QR).
Therefore,For the test facility, the GLR r e f l e c t s the variation in construction (UA value) between each of t h e two-room direct-gain u n i t s and the variation in
t h e amount of solar g a i n between t h e s i n g l e r o o m u n i t s . It a l s o reflects t h e change in i n s u l a t i o n l e v e l s between the t w o seasons f o r
a11
units.3.11 Mass-Gain R a t i o
A s g i v e n in (31, t h e mass-gaZn r a t i o
(MGR)
reflects t h e thermal storage characteristics of each unit.It Is
calculated a s ,MGR = C / g , (15
1
where,
C
= thermal capacity of t h e u n i t given in Table 2,MJJK
gs = average hourly s o l a r gain =c ~ / N ,
~ / h .3.12 Purchased Heating F r a c t i o n
Fh is the fractton of the n e t h e a t i n g load of the b u i l d i n g
(QR)
t h a t is supplied by the heating system:3.13 Hours of Overheating
To i n d i c a t e the severity of overheating, the number of hours far w h i c h t h e a i r temperature exceeded 2 5 " ~ is calculated as a percentage of the total
hours f o r each room as No.
The author g r a t e f u l l y acknowledges the assistance of M.O. P e l l e t t e r
in
a l l p h a s e s of c o n s t r u c r i o n , instrumentation and operation of the f a c i l i t y .REFERENCES
1. Barakat, S.A.,
NRCC
P a s s i v eSolar
T e s t F a c i l i t y , Performance ofDirec t-Gain U n i t s , Build%ng Research No t e 2 15, D i v i s i o n of R u i l l d i ~ ~ g
Research, National Research Council Canada, Ottawa, 1984.
2. Barakat, S.A., NRCC P a s s i v e Solar TESL F a c i l i t y , Performance of Mass-
Wall U n i t , B u i l d i n g Rescarch Note 216, D i v i s i o n of B u i l d i n g Research, National Research Council Canada, O e t a w a , 1984.
3 . Barakat, S.A., Passive Solar Heating S t u d i e s at the M v i s f o n of B u l l d i n g Research, Build-Lng Research N o t e 188, D i v i s i o n of B u i l d i n g Research,
National Research Councfl Canada, Ottawa, 1982.
4 . Barakat, S.A., SoLar Heat Gains Through Windows in Canada, DBR Paper
No. 9 4 4 , NRCC 1 8 5 7 4 , D i v i s i o n of B u i l d i n g Research, N a t i o n a l Research C o u n c i l Canada, O t t a w a , 1980.
5 . Barakat, S.A., and U.M. Sander, U t i l i z a t i o n of Solar Gains Through
Wlndows for Heating Houses, B u i l d i n g Research No t c 18 4 , D i v i s i o n o f Bullding
Research,
N a t i o n a l Research Council Canada, Ottawa, 1982.6 .
Brown, W.C., MaskXI
Energy Reseach P r o j e c t , Comparison o f Standard and Upgraded Rouses, B u i l d i n g Research N o t e 160, D i v i s i o n of BuildingResearch, National Research Council Canada, O t t a w a , 1980.
7. U i n e , S . J . and F.A. McClintock, Describing the Urlcertalnties in S i n g l e - S a m p l e Experiments, Mechanical Engineering, V o l . 5, pp. 3-8, 1 9 53.
T a h l e 1. C h a e a c t ~ r i s t i c s of test: u n i t s *
1980/81 1981/8 2
Wall
thermal resistance rnLOc/w 2.1 4,2G e i l l n g thermal resistance, m 2 - Q ~ / ~ 3
.s
5 .6Floor thermal r e s i s t a n c e , m2= "C/W 7.0 7.0
South window g l a s s area, m 2 2 ,6 2 - 6
N o r t l ~ window g l a s s area, m2 1.0 1.0
Yindow thermal resistance, r n 2 m P c / ~
0
-35 0 . 3 5Floor area p e r room, rn2 1 3 . 9 13.9
Room h e i g h t , m 2 - 4 2.4
*
Calculated valuesT a h l e 2. Thermal Storage Chatacteristics of Test U n f t s
Test Thermal C a p a c i t y
U n i t
(MJ/K)
Gonstruc t i o n--
--1 1.53 Light
-
Standard wood-f rame*12.7 m gypsum board finish on walls and
c e i l i n g s , carpet over wooden Eloor. Medium
-
As above, b u t 50.8 mm gypsu*lboard finish an walls and 25.4 mrn on ceiling.
Heavy
-
I n t e r i o r wall f i n i s h of 1 0 1 - 6 mm h r i c k , 12.7 rnrn gypsum board f i n i s h onc e i l i n g , c a r p e t over wooden f l o o r .
4 4.66** As light, with mass wall behind wlndow.
-
-
-*
A s given in Reference 1T a b l e 3. Summary of Measurements
Frequency of
Neas~lremen t Sens or 'Location measurement
Average i n d o o r a i r 12-poFnL type T distributed, 1 m i n u t e temperature (each t h e r m o p i l e 1.25 m above
room) f l o o r
Mass
walk
surface 9-point type T d i s t r i b u t e dI
mtnuteremperature, i n s i d e thermopile over s u r f ace
and o i ~ t s l l d e
A t t i c temperature 3 - p o i n t type
T
cenLre of a r t l c 1 m i n u t e t h e r m o p i l eV e n t i l a t l o n f a n type T fan i n l e t 1 minrrte
t n l e t temperature thermocouple Outdoor air temperature type T t o p of c e n t r e 1 minute thermocouplein hut a shade screen Solar r a d i a t i o n : g l o b a l h o r i z o n t a l Epply 8-48 t o p o f centre h u t 1 m i n u t e pyranometer v e r t i c a l south I"
south wall o f 1 minute
centre hat
vertical north n o r t h wall of I minute
centre h u t
d i r e c t normal E P P ~ Y
pyrheliometer s o u t h of test h u t s 1 minute
Heating energy pulse-intiating Corridor
kW.h meter
V e n t i l a t i o n f a n s , p u l s e - i n t i a t i n g C o r r i d o r
energy kW.h meter
Ventilation f a n , laminar flow in s i t u f l o w r a t e element or P i t o t tube traverse 15 minutes 15 minutes once every season
Wind s p e e d and vane and lO-metes tower 1 m i n u t e d i r e c r i o n anemometer south of site
m GYPSUM BOARD
- FXT. SHEATHING ( PARTICLE
- 39 mm INSUL. IR 7.1 I
-
VAPOR BARRIER (6 mil PMY)- 12.7 mrn GYPSUM BOAAD
-
R 7 INSUL. - VAPOR BbRREER - 12.7 GYPSUM1
BOARD 2 - 1 2 . 7 m m L A Y E R S G Y P S U M B O A R D L A Y A R D ( b l W A L L C O N S T R U C T I O N . U N t T 2 ( a ! \ V A L 1 C O N S T R U C T I O N . U N I T 1r-
1GO mm CEhlENT BRICK- 1 - 12.7 m n CYPSUhI BOARD
- R2.1 INSUL.
- 12.7 mm GYPSUM BOARD
( c l W A L L C O H S T R U C T I O N . U N l T 3
V E R T l C A L S O U T H
---
-- -- V E R T I C A L N O R T H Q-
H O R I ZONTA L-
- - - D I R E C T NORMAL D E C . 28, 1 9 8 1 T I M E , h S A M P L E M O N I T O R E D D A T A FOR O N E - W E E K P E R I O D S O L A RR A D I A T I O N
V A L U E SDEC. 28, 1981 TIME, h
F I G U R E 4
S A M P L E M O N I T O R E D D A T A FOR O N E - W E E K P E R I O D O U T D O O R T E M P E R A T U R E , W l N D D l R E C T I O N .
-- - - H E A T I N G I N O R T H R O O M )
...*.*
C O O L l N G - S O U T H R O O M-
-- - - NQRTrH R O O M-
n-
I I I I I 10 0 24 4 8 7 2 96 120 244 D E C . 28, 1981 T I M E , h S A M P L E M O N l T O R E D D A T A F O R O N E - W E E K P E R I O D - U N I T 1HEATING (TOTAL)
- - - HEATING {NORTH ROOM)
*...*.**. la 0 2 4 4 8 7 2 9 6 120 144 1 6 8 D E C . 2 8 , 1 9 8 1 T I M E . h F I G U R E 6 S A M P L E M O N I T O R E D D A T A F O R O N E - W E E K
P E R I O D
- U N I T 4APPENDIX A
Heat Loss Coefficient
The
methodused
t o o b t a i n theoverall
heat lass coefficient {or h e a tloss) of t h e test units, as well as a general dfscussion on the major
sources
of uncertaintyin
the experimental dataare
presented.For the direct-gain u n i t s , a h e a t balance can
be
performed d i r e c t l y from t h e measured dara to determine t h e t o t a l heat l o s s , Qt, as,The overall l o s s coefficfent UA ts then determined a s ,
F o r the mass-wall unit, however, t h e solar gain i s n o t collected
d i r e c t l y in the room. The l o s s coefficient is, therefore, determined from the experimental r e s u l t s by regression a n a l y s i s and the heat balance i s then used t o determine the solar gain through t h e
mass-wall
system.The regression method used E a determine the b u i l d i n g loss c o e f f i c i e n t
( 6 ) c o n s i s t s of fitting a s t r a i g h t l i n e to t h e measured average values a f heat s u p p l y rate (with no s o l a r i n p u t ) versus measured average
indoor-outdoor temperature difference. The s l o p e of such a line i s the h e a t
l o s s coefficient, UA. To
minimize
the effect ofsolar
radiation, o n l ydata
p o i n t s obtained during n i g h t s preceded by cloudy days ( i . e . days w i t h n o direct normal radiation) were used i n the regression analysis.
As confirmation of t h e h e a t balance method, t h e loss coefficients o f a l l direct-gain rooms were determined by regression a n a l y s i s a s w e l l . P l o t s of average heating power a g a t n s t temperature difference are given in Ffgures A 1 to A3 f o r t h e 1981182 season. The corresponding UA values obtained by
regression are omp pared w i t h those obtained by the heat balance method in T a b l e A l
.
Several. factors c o u l d explatn the differences between the
U A
values obtained by the two methods:1. T h e m l . storage of t h e room: Although t h e heating power values used f o r
the regression p l o t s were only
for
n i g h t s preceded by cloudy days, some of t h e diffuse solar radiation stored during t h e day could be offsettingthe losses during the n i g h t hours. This eEf e c t s h o u l d l e a d to an
underestimation
of
UA valves by t h e regression method particularly f o rthe massive rooms such a s 25 and 35. In a d d i t i o n , t h e room thermal capacity
will
cause power consumption to deviate from t h e steady-statebehaviour i m p l i e d in t h i s method, particularly f o r those d a y s with rapidly changing weather c o n d i t i o n s . This could e x p l a i n the scatter in
the d a t a p o i n t s even f o r t h e same temperature d i f f e r e n c e ( s e e Figures A1 to ~ 3 ) .
2.
Overheating of room air: Duringsunny
days, t h e risein
south room t e m p e r a t u r e above t h e set p a i n t of ZO°C w i l l l e a d to a d d i t b n a l lossesthrough the p a r t i t i o n walls. Over the m o n i t o r i n g p e r i o d , t h e average
air temperature
of
the south rooms o p e r a t i n g under Mode 1 were about 1 ' ~ higher than t h a t of the north room and t h e corridor. This would lead to a s l i g h t overestimatisnof
UA
for t h e south room c a l c u l a t e d by t h e heat balance method, but an underestimation of UA, for t h e north room.3. Transmitted s o l a r radiazion:
In
c a l c u l a t F n g the solar radiationtransmitted through t h e window, no account - was
taken
of the shading - bythe window
frame.
T h i s is, therefore, a source ofu n c e r t a i n t y
in estimating t h e solar g a i n l e a d i n g to an overestimation ofW A
v a l u e scalculated by the heat balance.
4. Attic temperatum: In both methods, t h e atttc temperature is assumed to be the same as t h a t outdoors, which is g e n e r a l l y t h e case
for
cloudyc o n d i t i o n s . On sunny days, the attic air temperature may rise
s i p i E i c a n t l y above outdoor a i r temperature due to s o l a r r a d i a t i o n
absorbed by the r o o f . On clear nights, however, the attic temperature d r o p s b e l o w outdoor air temperature d u e t o sky r a d i a t i o n . This is, therefore, another source of error In the UA value o b t a i n e d by bath methods. A more d e t a i l e d d f s c u s s i o n of a t t i c temperatures i s g i v e n in
Appendix R ,
The
foregoing factors together w i t h measurement errors are the major s o u r c e s of uncertainty in the experimental data. However, s i n c e the UAvalues obtained by the two methods agree reasonably w e l l for
the
light
massu n i t s ( m a x i m u m d i f f e r e n c e is 6 % ) but n o t for t h e massive unirs { d i f f e r e n c e s up to 19%), it can b e concluded t h a t t h e
thermal
storage e f f e c t is the mafn source o f e r r o rin
t h e values o b t a i n e d by regresston a n a l y s f s . F o r t h i s reason,UA
values o b t a i n e d by t h e h e a t balance method are used throughoutt h e a n a l y s i s .
Following the d i s c u s s i o n above, it was expected chat the r e g r e s s i o n
method would underestimate the
UA
value f o r t h e m a s s w a l l unit in the1980181 season. An attempt was made i n 1981182 to determine and eliminate t h e effect o f heat storage
In
the mass w a l l by shading the windowon
the outside fora
10-day period in February. The shade w a s located 0.3 m awayfrom t h e window t o shade all
solar
radiation without interrupting t h econvection patterns aver the o u t s i d e surface. The power and temperature difference v a l u e s measured during this period are shown in F i g u r e A4. A comparison was made ( f o r the 19811'132 data) between the
U A
value obtained b y regression during n i g h t s of cloudy d a y s and r h a t during the window-shadedp e r i o d . The difference, due to the storage effect, was found to b e 1.2 W/K. This i s then added to the
U A
value obtained d u r i n g n i g h t s of cloudy days f o r1980181 to obtain the value of UA f o r the south room of U n i t 4 .
Also d u r i n g 1981182, the
U A
value f o r the mass-all unit w a s d e t e r m i n e din
the same manner after installing an i n s r r l a r i n g c u r t a i n between the window afld the mass-wall, i - e . , by shading the windowon
t h e o u t s i d e for anotherl o d a y p e r i o d w i t h the c u r t a h closed. The d a t a f o r t h i s period are shewn in Figtire A5.
Values
f o r t h e l o s s coefficient f o r b o t h rooms of U n i t 4 f o r b a t h h e a t i n g seasons aregiven
in
Table A2. A s shown in t h e t a b l e , t h einsulating curtain produced only a s l i g h t reduction in the overall loss c o e f f i c i e n t of the room, from 10.5 to 10.1
WJK. The
c u r t a i n manufacturer'ss p e c i f i c a t i o n s , on t h e other hand, suggested a thermal resistance v a l u e between 1.6 and 2.5 r n 2 m ~ / w ,
which
should have reducedt h e
room UA to between7.5
and 8W/K.
No particular a t t e n t i o n was given in the design of thecurtain to sealing the gap between t h e
curtain
and the s i d e v e r t i c a l g u i d e s ,and t h i s could have allowed n a t u r a l a i r ~ I r c u l a t L o n t o occur around t h e
curtain, removing heat from t h e face of t h e mass
wall
and transporting it to the w i n d o w . T h i s small change in the roomU A
did not warrant separatepresentation of the d a t a obtained a f t e r i n s t a l l a t i o n o f t h e i n s u l a t i n g
curtain. Performance of the mass-wall u n i t is, therefore, presented f o r t h e
T a b l e A l . Heat Loss C o e f f i c i e n t s o f Direct-Gain U n i t s (UA Values W ~ K )
Unit
Regression Heat b a l a n c e Percentmethod method
dif
EerenceTable A2. Heat Loss Coefficients f o r Mass-Wall %it
1980/83.
ROOM-
UA, W fK
South room ( 4 s ) 14 North room (4N) 13.8 South room ( 4 s ) 10.5 c u r t a i n u p South room ( 4 5 ) 10.1 curtain down North room (4N)10.0
1. 2
I
I II
I
' - 1 I U N I T 1 S U A = 1 6 . 6 W I K 1.0 - - U N I T 1 N UA = 9.9WIK
0.8 - 0.6-
0 . 4 - I I I I 5 10 15 20 25 30 35 40 45 50 T E M P E R A T U R E D I F F E R E N C E , KF I G U R E
A 1 S P A C E H E A T I N G POWER V S T E M P E R A T U R E D I F F E R E N C E-
U N I T 1, 1981i82 S E A S O N Q U N I T 25 U A . 1 6 . 0 W l K - r U N I T 2N UA = 8 . 9 W / K - - - - 0 5 10 15 20 25 30 35 40 4 5 50 TEMPERATURE D IFFERENCE. K F I G U R E A 2S P A C E HEATLME POWER V S TEMPERATURE D I F F E R E N C E - U N I T 2, 19811 82 S E A S O N
.
I 1 I I I I - U N I T 35 UA = 1 4 . 3 W I K-
w U N I T 3N U A - 10.2 W I K-
- 7 TEMPERATURE D I F F E R E N C E , K F I G U R E A 3 S P A C E H E A T I N G P O W E R V S T E M P E R A T U R E D I F F E R E N C E - U N I T 3 , 1981182 S E A S O N F l G U R E A 4 H O U R L Y 5 P A C E H E A T I N G P O W E R V S T E M P E R A T U R E D I F F E R E N C E-
U N I T 4 , W I N D O W S H A D E D , C U R T A I N O P E N 1 . 2 ' 1.0 L J 0 . 8 - Q aI
i - U N I T 4 5 U d - 1 0 . 5 W I K z 0 . b --
I- 4g
n . 4 - W U Q 0 . 2 - 7 a tn 5 10 1 5 20 25 3 0 3 5 4 0 45 5 0 T E M P E R A T U R EDIFFERENCE,
KT E M P E R A T U R E
D I F F E R E N C E ,
KF I G U R E A 5
H O U R L Y S P A C E H E A T I N G P O W E R V S T E M P E R A T U R E D I F F E R E N C E - U N I T 4,
WINDOW
S H A D E D , C U R T A I N C L O S E DA t t i c Temperatures
It -Is common
in
energy calculation methods to u s e t h e average indoor-outdrsor a i r temperature difference i n c a l c u l a t i n g the h e a t l o s s through the building slcin. This i m p l i c i t l y assumes t h a t t h e average a i r temperature in the a t t f c s p a c e above t h e i n s u l a t e d c e l l i n g is e q u a l t o the average o r ~ t d o u s air temperature.Air tlemperatures were measured i.11 rhe attics o f t h e t e ~ t huts to assess
t h e v a l i d i t y oE t h i s a s s m p t i o n - W r i n g t h e h e a t i n g s e a s o n , a r t i c
temperat~rses up t o 1 8 - C above outdoor air temperature were observed; t h e maximum rise above o u t d o o r remperalrure occurred an warm s u r ~ n y days i l l Yarch
and A p r i l . Attic temperatures as much a s 6 ° C lower t h a n outdoor a i r
temperature were measrired on clear n i g h t s . T h i s difference was due to
longwave r a d i a t i o n losses t o the sky. However, d e s p i t e the d l u r n a l attic temperature Eluctuations a r o u n d the outdoor a i r temperature, t h e monthly average a t t i c temperatures were not more than 2.0°c higher t h a n the c o r r e s p o n d i n g monthly average outdoor air temperature d u r i n g the h e a t i n g season (Table 81). A heat Loss coefficient based on a l o n g tesrn heat
balance € a t h e r e f o r e more a c c u r a t e than one c a l c u l a t e d by regression b a s e 4
on h o u r l y
or daily
values.I n g e n e r a l , € o r energy calculation p u r p o s e s , t h e assumption t h a t attic
temperature equals o u t d o o r air temperature would Lead t o a n overestimakinn of t h e seasonal heat l o s s through the ceLLing of less t h a n 6% under
T a b l e RL
.
Monthly Average A t t i c TemperatureAv. Outdoor Av- A t t i c M f ference
Month Temp., O C Temp., O C K
O c t . 81 NOV* 81 D e c . 81 Jan. 8 2 Feb. 82 Mar. 8 2 Apr. 82 Season . -- Nov.
80
-0 -8 -0.7 0 ,1 D e c . 80 -13.
6
-12.0 1.6 Jan. 81 -13 -9 -11 -9 2.0 Feb. 81 -1 .9 -0.4 1.5 Mat.81
-0.4P .5
1.9 Apr.81
7 - 6 9.5 1.9 Season -3.8 2.3 1.5APPENDIX C
U n c e r t a i n t y AnalysisThis
appendix deals with the estimate of t h e u n c e r t a i n t i e s a s s o c i a t e dw i t h the measured v a r i a b l e s and w i t h t h e c a l c u l a t e d performance factors. The t e r m uncertainty is d e f i n e d a s the possible value of error. The
uncertainty in each component measurement, for example, i s described by an
u n c e r t a i n t y
fnterval(W)
as:where
V i s t h e v a r i a b l e under consideration
M is the b e s t estimate ef the v a r i a b l e
V
W is the uncertainty i n t e r v a l ( " u n c e r t a i n t y " )
.
Kline and McClintock ( 7 ) have presented a technique for d e t e r m i n i n g the propagation of e r r o r s
In
a derived r e s u l t fat a s f n g l e s a m p l e experiment. For a d e r i v e d value (Q) represented bythe uncertainty i n
Q
can be calculated as:assuming that the odds are the same i n each v a r i a b l e x,
u,
v, and t h a t each variable is independent and its uncertainty can b e represented by a normal distribution.Uncertainty in primary measurements
Temperature: copper-constantan thermocouples were used for a11 temperature
measurements. Although these thermocouples were not c a l i b r a t e d
i n d i v i d u a l l y , three thernscauples of the same batch were used continuous~y t o
moniror t h e temperature in a Kaye
K140-4
i c e p o i n t reference(0.0
kQ.05°C).
These three r e a d i n g s were used to a d j u s t t h e reference of t h e d a t a logger to w i t h i n + O . I Q C .
It
is therefore estimated t h a t the uncertainty intemperature measurement is 20 -1
'C
.
Solar radiation: The measurement of solar r a d i a t i o n introduces the l a r g e s t u n c e r t a i n t y
and
is estimated at +5% o f reading.Power: A l l
kWh
meters were calibrated before i n s t a l l a t i o n . The error w a s f o u n d to be in the order of 20.25%. This is e q u i v a l e n t t o about W w a t t s at: full load f o r average heating power measarements and S . 5 watts f o rventilation fan power measurements.
Flow s a t e : Ventilation f a n flow rate was measured once every season using a
c a l l b s a t e d laminar f l o w element. The uncertainty
in
thls measurement i s estimated t o be 23.4 m3/h ( 2 cfm).The above values are estimates based on the manufacturer's calibration
of
t h e measurement equipment.The
o d d s a c e assumed to be 20 to f (aconffdence l e v e l sf 9523 that t h e values are wtthln the uncertainty i n t e r v a l .
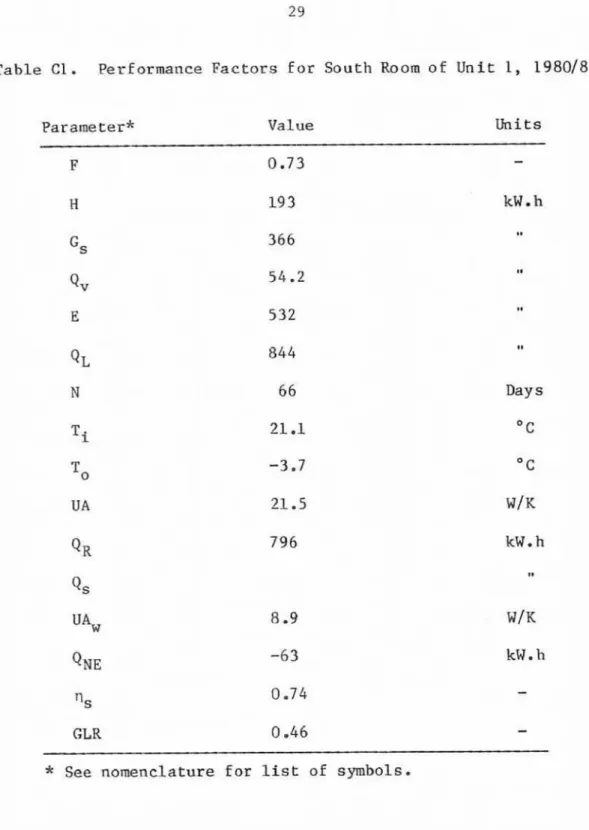
Seasonal performance f a c t o r s f o r t h e s o u t h room of hit 1 f o r 1980181 are
used
t o produce an example of the uncertainty i n each performance f a c t o r .The
only e x c e p t i o n was for the calculation of vented energy(Qv)
where values are for a 15 m i n . i n t e r v a l , s i n c e Q v is a function of
temperature d i f f e r e n c e during each particalar i n t e r v a l and is n o t averaged
over the season. Seasonal values are p r e s e n t e d in Reference I and
reproduced in Table
C1
f o rthe
s o u t h room of direct-gain hit1.
Uncertainty v a l u e s were then c a l c u l a t e d u s i n g E q u a t i o n (C.1) and presented Tn T a b l e C2.
2 9
Table Cl. Performance Factors f a r South R o o m o f U n i t 1, 1980181
Parameter* Value Units
Q R Qs
u%
Q~~n s
GLR DaysT a b l e C2, Uncertainty I n
tervala
Parameter Equation
Uncertainty Uncertainty
i n t e r v a l (2
Temperature measured
3
.I0C
Solar r a d i a t i o n n
3,6kW.h 5
Av. auxiliary power " +4W 9 - 2 5
Av. f a n power "
s.
5W S.25F l o w rate I.
53.4 m 3 / h
Solar g a i n
C
,=FHA 12lkW .h 3 . 7C o o l i n g energy
Q,=
pCpV(T,-To) b t kL.3kW.h 52.4Total heat loss QL=G,+E-Q v 222.3kW.h E2
.
5Overall loss IJA =
Q~/AT.N
coefficient
R e f e r e n c e l o a d Q R = ~ A ( T , , t - ~ o ) N i23.2 kW.h
i2.
9Useful
solarQ,
= G ~ - Q ; I I A ( T ~ - T ~ ~ ~ ) N '21.7k~.h
S . 0 g a i nNet effective QNE = Qs-(~d),(~set-~o)~
'31.5kW.h
g a i n
U t t l i z a t i o n ' I ~ =