BioWatch: Estimation of Heart and
Breathing Rates from Wrist Motions
The MIT Faculty has made this article openly available.
Please share
how this access benefits you. Your story matters.
Citation
Hernandez, Javier, Daniel McDuff, and Rosalind Picard. “BioWatch:
Estimation of Heart and Breathing Rates from Wrist Motions.” EAI
Endorsed Transactions on Pervasive Health and Technology 15(3)
(2015).
As Published
http://dx.doi.org/10.4108/icst.pervasivehealth.2015.259064
Publisher
EAI
Version
Author's final manuscript
Citable link
http://hdl.handle.net/1721.1/110541
Terms of Use
Creative Commons Attribution-Noncommercial-Share Alike
BioWatch: Estimation of Heart and
Breathing Rates from Wrist Motions
Media Lab
Massachusetts Institute of Technology Cambridge, MA, USA
{javierhr, djmcduff, picard}@media.mit.edu Abstract—Continued developments of sensor technology
including hardware miniaturization and increased sensitivity have enabled the development of less intrusive methods to monitor physiological parameters during daily life. In this work, we present methods to recover cardiac and respiratory parameters using accelerometer and gyroscope sensors on the wrist. We demonstrate accurate measurements in a controlled laboratory study where participants (n = 12) held three different positions (standing up, sitting down and lying down) under relaxed and aroused conditions. In particular, we show it is possible to achieve a mean absolute error of 1.27 beats per minute (STD: 3.37) for heart rate and 0.38 breaths per minute (STD: 1.19) for breathing rate when comparing performance with FDA-cleared sensors. Furthermore, we show comparable performance with a state-of-the-art wrist-worn heart rate monitor, and when monitoring heart rate of three individuals during two consecutive nights of in-situ sleep measurements.
Keywords—accelerometer; gyroscope; smartwatch; wrist; ballistocardiography; photoplethysmography; sleep monitoring
I. INTRODUCTION
Continuous measurement of physiological parameters during daily life has much potential for advancing health informatics [21][23]. For instance, physiological parameters such as resting heart rate have been associated with risk factors of cardiovascular disease [5]. Furthermore, home telehealth approaches have been shown to reduce the number of hospital admissions and number of bed days of care [10]. However, the current gold standard approach for measuring heart rate (electrocardiogram) requires sticky gels and uncomfortable electrodes attached to the skin. Furthermore, cumbersome electronics and the requirement of maintenance (e.g., recharging batteries, replacing electrodes) prevent many people from regularly measuring their vital signs.
During recent years, researchers have been actively working on the development of less intrusive physiological sensors and the creation of wearable devices for daily life monitoring. Among the different form-factors, an ongoing trend is the development of wrist-worn devices (e.g., Empatica, MyBasis, Mio Alpha) that can monitor vital signs by non-intrusive methods such as photoplethysmography (PPG) [2]. Being able to measure vital signs from the wrist presents several benefits for daily life monitoring as the sensors are always in close contact with the person and can be easily accessed and concealed. While most of these devices also
incorporate motion sensors, their readings are mainly used to recognize activities and detect motion artifacts. As illustrated in Fig. 1, our work explores the use of motion information on the wrist in order to derive measures of cardiac and respiratory activity. In particular we address the following research questions: How can we use the currently available motion sensors within wrist-worn wearable devices, namely accelerometers and gyroscopes, to accurately measure cardiac and respiratory movements?, How do these results compare to traditional approaches and state-of-the-art wearable devices?, Does combining measurements from motion and other traditional approaches improve performance?, and How well do the proposed methods perform in a real-life setting to provide in-situ non-intrusive physiological assessments?
The main contributions of this paper are: 1) methods for recovering the cardiac and respiratory signals from accelerometer and gyroscope measurements using a wrist worn sensor, 2) validation of physiological measurements of heart rate (HR) and breathing rate (BR) in a controlled laboratory setting, and 3) preliminary validation of heart-rate estimation in a real-life sleep setting. In the remainder of the paper we present the methods and experimental design, perform qualitative comparisons, and discuss the results.
II. BALLISTOCARDIOGRAPHY
Ballistocardiography (BCG) is a non-invasive physiological measurement method that has regained attention during recent years [7]. This approach captures subtle motions of the body
Javier Hernandez
Daniel McDuff
Rosalind W. Picard
Gyroscope Accelerometer z x y z x y
75 Beats per Minute 17 Breaths per Minute
Fig. 1. We present a novel approach for measuring cardiac and respiratory parameters from wrist motions using a smart watch (Samsung Galaxy Gear), even when the wrist is not held against the chest.
due to shifts in mass of blood as the heart pumps [20] and can be unobtrusively measured by adding motion sensors to everyday objects (e.g., weighing scale [11][22], chair [19]) or by adding devices to the body (e.g., cellphone on the chest [6][13], ear-worn device [8]). Depending on the location of the sensors, they can also capture the contraction and dilation of the lungs during breathing, especially if the sensors are close to the chest where the motions are usually more prominent. In a recent study [9], researchers demonstrated that it’s possible to extract HR and BR using the sensors available inside a head-mounted wearable device (Google Glass). Following a similar methodology to the one described in this paper, we showed that using measurements from the gyroscopes, accelerometers, and a camera located above the right eye, one can accurately capture the subtle heart and respiratory motions of the person wearing the sensors. This paper takes a similar approach but in a significant and new direction: measuring HR and BR from accelerometers and gyroscopes mounted inside a wristband. A wrist-worn device may be more convenient, comfortable and easier to conceal than a head-mounted device but it may be more challenging to extract clean physiological estimates as the wrist is further from the heart than the head. Also, we expect that the ability to move the wrist into many more positions relative to the heart and torso (vs. a limited number of head positions) will make this recognition more complex.
One of the limitations of measuring cardiorespiratory motions is that they are very sensitive to motion artifacts. Therefore, researchers have extensively investigated their utility in settings where little movement is observed such as sleep monitoring. In this setting, researchers have developed sensors to incorporate BCG and respiratory measurements on the bed post [3] or mattress [4][15][16] and have been able to accurately extract vital signs such as HR and BR. Furthermore, this information has been shown to be useful in the detection of circadian rhythms and sleep patterns [15]. However, most of the previous approaches require custom-made hardware devices that require installation and alter the sleeping environment. In addition, most of the sensors assume that there is only one person on the bed and that s/he is on a specific region of the bed where the sensor is located. Finally, none of these devices can be easily used when the person gets up from bed. If the same information could be extracted with a device that the person is already wearing during daily life, such as a smart watch, the previous limitations could be addressed. Recent work that partially tackles these problems was presented by [12], in which they demonstrated that a wrist-worn accelerometer could capture respiratory movements of people sleeping whenever the wrist was near the chest (around 44% of the time). The results presented in this work include BR estimation from accelerometer data when the participant is lying down as well as standing up and sitting down, without the wrist being held near the chest. Furthermore, we also develop a method for providing HR estimation, for which motions are more subtle and occur at higher frequencies than the respiratory motions. We also supplement the accelerometer with other sensors (e.g., gyroscope and blood volume pulse), and compare HR estimation results during real-life sleep of three participants when they were relatively still (around 85% of the time).
III. METHODS
A. Measurement of Wrist Motions
A wrist mounted smart watch, Galaxy Gear (by Samsung, Inc.), containing a 3-axis accelerometer (meters/second2) and
3-axis gyroscope (radians/second) was used for our experiments. These sensors have a resolution of up to eight decimal places per reading. A custom data logging application was developed on Android to continuously record the measurements at an average sampling rate of 100 Hz. The recordings were stored on the device and downloaded after each session.
B. Heart and Breathing Rate Estimation
In order to extract HR and BR from a specific stream of motion data (e.g., 20 seconds of accelerometer or gyroscope data, or a combination of data from both sensors), several processing steps were followed. First, each of the components (e.g., X, Y, Z axis of the accelerometer) were normalized with z-scores in order to give them the same relevance. Then, given a certain modality (e.g., accelerometer, gyroscope or a combination of sensors) we recovered the pulse and respiratory waves from which heart rate and breathing rate could be easily calculated.
To estimate the pulse wave, we first applied an averaging filter and subtracted it from each of the components. The window duration of the filter was empirically set to 1/7th of a
second which effectively removed signal shifts and trends due to body motion while preserving BCG information. Then, a band-pass Butterworth filter of order two, with high and low cut-off frequencies of 4 and 11 Hz respectively, was applied to isolate the BCG changes. The different components of each sensor were then aggregated with a square root of the summation of the squared components to make the estimations robust to different body postures. Finally, a band-pass Butterworth filter of order two with cut-off frequencies of 0.66 and 2.5 Hz (corresponding to 40 and 150 beats per minute) was applied to obtain the final pulse wave. These parameters encompass a range of heart rates that might reasonably be expected in daily life.
To estimate the respiratory wave, we first applied an averaging filter to each of the components independently. The size of the window was set to be the duration of a respiration cycle at a pre-defined maximum breathing rate of 40 breaths per minute, which enables removing the higher frequency cardiac motions. We then selected the component with the most periodic signal to become the final respiratory wave. In this case, the periodicity level was defined as the maximum amplitude observed within 0.13 and 0.66 Hz in the frequency domain (corresponding to 8 and 40 breaths per minute, respectively).
After extracting the pulse and respiratory waves, HR and BR were estimated in the frequency domain. In particular, we extracted the frequency response with the Fast Fourier Transform and identified the frequency with the highest amplitude response. The frequency bands used for the pulse and breathing rate calculations were the same as those used when estimating the pulse and respiratory waves (i.e.,
[0.66-2.5] Hz for heart rate and [0.13-0.66] Hz for breathing rate). The final estimated HR and BR corresponded to the maximum frequency multiplied by 60 beats-per-minute and 60 breaths-per-minute, respectively. Fig. 2 shows a representative example of pulse and respiratory wave estimation from accelerometer and gyroscope data of a participant while standing up.
The previous methods and parameters were motivated by the ones described in previous work [9]. However, the methods presented in this work require fewer processing steps and lower computational cost (e.g., lower filter orders and no need for Principal Component Analysis). While we can develop more sophisticated methods, we focused here on low computational complexity methods for low power and real-time processing.
C. Gold-Standard Measurement
In order to compare the wrist motion measurements with a gold standard, ECG recordings were captured with a chest-worn Alive Technologies sensor at a sampling rate of 300 Hz. The device used a 1-lead ECG: the positive lead was connected to the left hand side of the chest and the negative lead to the abdomen. Conductive gel was used to improve the signal quality. In order to estimate heart rate from ECG measurements, we used the peak detector described in [17]. The detected peaks were visually verified in order to ensure a fair comparison with the measurements from the wrist worn sensors. Heart rate was then computed as 60/(average distance between peaks).
In order to also provide a baseline comparison with a state-of-the-art wrist-worn wearable PPG device, blood volume pulse (BVP) measurements were captured with the Empatica E3 sensor (www.empatica.com) at a sampling rate of 64 Hz. The E3 sensor measures the BVP using a customized
dual-color LED based PPG signal from the wrist. The PPG sensor was on the outer side of the wrist of the same arm used for the smart watch (see Fig. 3 for placement of the sensors). In order to remove spurious peaks, raw readings which an absolute value above 200 were set to zero. HR from the BVP was estimated in the frequency domain as described in the previous section.
In order to provide ground truth respiration, we used the FlexComp Infiniti chest belt (Thought Technologies, Inc.) which captured information at a sampling rate of 256 Hz. BR from the Infiniti was estimated in the frequency domain as performed with the motion data.
D. Combination of Sensors
For part of the analysis we considered combining different sensor modalities. In order to combine motion modalities (i.e., accelerometer and gyroscope), we time-aligned all the components and used them as input to the algorithms described above. In order to combine the BVP with the motion-based modalities, we performed a weighted combination of the HR estimates obtained by the two types of sensors. The weights were set to be the normalized absolute magnitudes of the frequencies associated with their HR estimations. For instance, if the maximum frequency response when combining motion-based sensors was 1 Hz (60 beats per minute) with a magnitude of 0.5 dB and the maximum frequency response when using the E3 was 1.5 Hz (90 beats per minute) with a magnitude of 1 dB, the resulting estimation was 1.33 Hz, corresponding to 80 beats per minute.
IV. EXPERIMENTS
In order to explore the feasibility of extracting physiological parameters from wrist motions, we performed two validation studies. The first study was in a laboratory setting, and the second was during natural sleep at the participants’ homes. Both studies were approved by the Institutional Review Board of the Massachusetts Institute of Technology.
Fig. 2. Example of pulse and respiratory wave estimation from both accelerometer and gyroscope readings of a participant while standing up.
Fig. 3. Setup for the validation data collection. One minute recordings were taken with the participant in three positions: 1) sitting, 2) standing, and 3) lying down. The recordings were repeated once after resting and once after one minute of exercise. The Galaxy Gear was worn on the left wrist.
Fig. 4. Setup for the data collection during the sleep experiment. ECG electrodes were attached to the skin near the heart and on the abdomen. The Galaxy Gear was worn on the left wrist.
A. Laboratory Setting
Our first experiment featured 12 participants of both genders (6 females) and different ages (22-34) with no known cardiac or respiratory abnormalities. Fig. 3 shows the setup used to record the data. Since BCG measurements are affected by the position of the body [1] we considered three different body postures: sitting down, standing up and lying down. Two recordings for each position were taken. The first recording was taken at rest and the second one taken after one minute of exercise, thus increasing the dynamic range of physiological parameters. For the exercise activity the participants pedaled for one-minute on a static bike. This experiment resulted in six one-minute recordings per individual (72 recordings in total for 72 minutes of data per sensor). The experiment lasted around 25 minutes per participant and participants were compensated with a $5 Amazon gift card.
B. In-situ Sleep Measurement
A second experiment was performed with three participants (ages 27, 28 and 30) wearing sensors during real nights of sleep. The participants were recorded for around 6 hours during each of two nights of sleep. ECG gold standard and wrist measurements (E3 and smart watch) were time aligned by starting the recordings simultaneously (see Fig. 4 for the setup). For this part of the analysis, only HR estimation was considered as we did not want to alter the sleeping environment with the wired respiration chest belt. Moreover, in order to minimize the effect of having novel wristband devices or ECG electrodes, participants slept with all the sensors during two days before the recordings took place.
V. RESULTS
A. Laboratory Setting
The validation experiment yielded six one-minute sessions for 12 participants, two sessions in each position (sitting down, standing up and lying down). However, the E3 data of one participant was corrupted for several parts of the experiment due to a loose sensor. The data for that one session was
excluded for the HR analysis. To evaluate the performance, we divided each of the one-minute sessions into twenty-second segments with a 75% overlap (n = 594 and n = 648 samples for HR and BR, respectively). The average HR of the segments was 76.70 beats per minute with a standard deviation of 14.26 (minimum of 49 and maximum of 130), and the average BR was 16.63 breaths per minute with a standard deviation of 4.02 (minimum of 7 and maximum of 26).
Comparison across Sensors: We compare the
performance of our approach using each of the sensor modalities alone (i.e., accelerometer, gyroscope and BVP from the wrist) as well as the different combinations.
Table I shows the mean absolute error, standard deviation, mean squared error and correlations for each case when estimating the heart rate. As can be seen, the accelerometer sensor alone achieved a mean absolute error of 1.39 beats per minute, outperforming the gyroscope sensor (ME: 2.01) significantly (Two-sample t-Test, p: 0.032). The combination of both sensors slightly outperformed the accelerometer (p: 0.576), achieving a mean absolute error of 1.27 beats per minute. These results demonstrate that both gyroscope and accelerometer contain relevant ballistocardiographic information and that our proposed methods can isolate them with high precision during relatively stationary postures, even when the hand was not near the chest. When comparing these sensors with the E3 sensor, the results are slightly worse than the E3 (ME: 0.95) but not significantly (p: 0.071). The combination of all sensors significantly outperformed the motion-based sensors (ME: 0.88; p < 0.004), highlighting that both motion-based sensors and BVP provide complementary information for the estimation of HR. While the combination of all sensors was better than when only using the E3 sensor, the difference was not significant (p: 0.610). The mean absolute error obtained for the excluded participant was 2.12 beats per minute when combining accelerometer and gyroscope and 11.90 beats per minute when using the too-loosely placed E3. Indeed, the fact we were not able to use the E3 sensor due to it being too loose to read the BVP highlights an important advantage of the motion-based measurements. That is, sensors that rely on motion-based estimations (e.g., smart watch in our study) do not need to be tight so long there is a contact point
TABLEI.HEART RATE ESTIMATION (N:594)
Sensor ME STD RMSE CC Gyroscope 2.01 5.89 6.22 0.91 Accelerometer 1.39 3.85 4.09 0.96 E3 BVP 0.95 2.74 2.90 0.98 Gyro.+Accel. 1.27 3.37 3.60 0.97 Gyro.+Accel.+E3 0.88 1.85 2.04 0.99 Gyroscope+E3 1.17 2.77 3.00 0.98 Accelerometer+E3 0.92 2.05 2.24 0.99
TABLEII.BREATHING RATE ESTIMATION (N:648)
Sensor ME STD RMSE CC
Gyroscope 0.38 1.19 1.25 0.95
Accelerometer 0.97 2.20 2.40 0.82 Gyro.+Accel. 0.55 1.80 1.88 0.90
ME = Mean absolute error (beats/breaths per minute), STD = Standard deviation of the absolute error, RMSE = Root mean squared error,
CC = Pearson’s correlation coefficient (p < 0.001 for all correlations)
TABLEIII.ME OF HEART RATE (N:594)
Sensor Sitting Standing Supine
Gyroscope 2.97 2.04 1.01 Accelerometer 1.91 1.12 1.14 E3 BVP 0.78 1.30 0.77 Gyro.+Accel. 1.59 1.10 1.11 Gyro.+Accel.+E3 0.88 0.93 0.83 Gyroscope+E3 1.33 1.39 0.80 Accelerometer+E3 0.99 0.92 0.83
TABLEIV.ME OF BREATHING RATE (N:648)
Sensor Sitting Standing Supine
Gyroscope 0.22 0.72 0.19
Accelerometer 0.41 1.97 0.54 Gyro.+Accel. 0.22 1.24 0.19
with the body (e.g., band, clock). In contrast, BVP monitors that use traditional LED light sources need to be in close contact with the skin to provide accurate ratings. Fig. 5 (left) shows a Bland-Altman plot with the heart rate measurements from the combination of the gyroscope and accelerometer for the 594 pairs of measurements. The data from the different participants are shown in different colors. The mean error was -0.18 with 95% limits of agreement –7.23 to 6.86 beats per minute.
Table II shows the different results when estimating breathing rate with the accelerometer, gyroscope and in combination. While both sensors yielded accurate results (less than 1 breath per minute error), breathing rates were significantly more accurate (p < 0.001) with the gyroscope (ME: 0.38) than the accelerometer (M: 0.97) probably due to the rotational motion of the arms when contracting and dilating the chest during breathing. In this case, the combination of both sensors (ME: 0.55) did not yield better results than the gyroscope alone, which may be due to a combination of several factors. For instance, the gyroscope measurements are already very accurate making it difficult to improve performance. Moreover, the algorithm to extract the respiratory wave selects the component with the most periodic signal, which does not always benefit from adding extra signals. Note that our respiration estimates were not compared with the E3 or any other wrist-worn wearable sensor as there are not, to the best of our knowledge, sensors offering breathing rate estimation from the wrist. Fig. 5 (right) shows a Bland-Altman plot with the breathing rate measurements from the gyroscope for the 648 pairs of measurements. In this case, the mean error was 0.15 with 95% limits of agreement -2.28 to 2.58 breaths per minute.
Impact of Body Postures: Since BCG measurements are
influenced by posture, we compared the performance of our methods during three different postures: sitting down, standing up and lying down. Table III shows the mean absolute error for all the different sensors when estimating HR. As shown in previous studies [1][8][9] sitting was the most challenging posture to obtain clean BCG information. The estimations of HR while sitting were slightly worse (ME: 1.59 beats per minute when combining accelerometer and gyroscope readings) than the estimations obtained during different body
postures (p: 0.102). When combining the different motion-based modalities, both standing and lying down yielded similar performance (ME: 1.10 and ME: 1.11, respectively). The performance pattern was not the same when estimating HR from BVP, in which standing yielded significantly worse performance (ME: 1.30 breaths per minute, p < 0.027) than the other postures (ME: 0.78 and 0.77 beats per minute for supine and standing). Partly due to this difference in performance across body postures and modalities, combining the three sensors outperformed each of the modalities alone. Interestingly, the combination of accelerometer and BVP slightly outperformed (p<0.316) any other combination for the standing position, yielding a mean absolute error of 0.92 beats per minute.
Table IV shows the mean absolute error for all the motion-based modalities when estimating BR. In this case, the position with worst performance was standing. This result is also in accordance with previous findings [9]. As can be seen, the gyroscope is significantly better than the accelerometer for all the postures (p < 0.031), which can help explain why the combination of the two sensors did not improve overall performance.
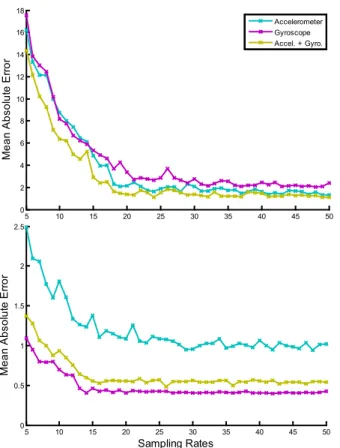
Sampling Rates: In this study we collected accelerometer
and gyroscope data at a sampling rate of 100 Hz. However, when for long-periods of time (e.g., days or months) the amount of stored data can quickly increase exceeding the currently available storage space of existing wearable devices. For instance, the sensor we used in our study (Samsung Galaxy Gear) has a storage memory of 4 GB, which could potentially store the equivalent of approximately 6.4 days of continuous monitoring with a sampling rate of 100 Hz. In order to assess whether we can reduce the sampling rate and still obtain reliable results, we undersampled the recorded data and re-computed the results. Fig. 6 shows the mean absolute error for heart (top graph) and breathing rate (bottom graph) estimation using gyroscope, accelerometer and their combination at different sampling rates (from 5 Hz to 50 Hz). As can be seen, similar performance to the one reported in the previous sections can be achieved with a sampling rate of only 20 Hz. This is partly to be expected as our methods monitor movements well under the frequency of 11 Hz. Sampling data at 20 Hz instead
50 60 70 80 90 100 110 120 -50 -40 -30 -20 -10 0 10 20 30 40 50
Average HRGold Standard and HRGyro+Accel (beats/min.)
HR G ol d S tandar d -H RG yr o+ A cce l (beat s/ m in. )
8 10 12 14 16 18 20 22 24 26 -10 -5 0 5 10
Average BRGold Standard and BRGyro (breaths/min.)
BR G ol d S tandar d -B RG yro (br eat hs /m in. )
Fig. 5. Bland-Altman plots for heart (left) and breathing rates (right) using the best combination of motion sensors for each case. The graphs show the agreement of 594 pairs (left) and 648 pairs (right) of measurements. Data from different participants are represented with dots of different colors. Mean error is depicted with slashed red and 95% limits are depicted with slashed green lines. (HR: Heart Rate, BR: Breathing Rate).
of 100 Hz enables storage of 5 times more data than before (i.e., 32 days of continuous monitoring). Due to the change of sampling rate, the battery life is also extended. For instance, while the Gear’s battery life lasted for around 6 hours when recording both accelerometer and gyroscope at a sampling rate of 100 Hz, the battery lasted for around 9 hours at a sampling rate of 20 Hz. Note, however, that while 20 Hz seems enough to gather accurate estimations of heart and breathing rates, higher sampling rates may be recommended for the analysis and estimation of other physiological measures such as heart rate variability [14], which requires very precise temporal resolution of peaks (not addressed in this work).
B. In-situ Sleep Measurement
In order to preliminary evaluate our findings in a real-life scenario we analyzed sensor data of two consecutive nights of sleep of three participants who voluntarily agreed to be recorded. All the sensors were switched on right before the participant went to bed for the night. To increase the likelihood that all participants were sleeping, we excluded the first hour of recorded data, yielding a total of 31.57 hours of sleep data.
Comparison across Sensors: For the analysis we
segmented the sleep measurements into 20-second segments with 95% overlap and used the same algorithms to estimate HR for each segment independently. Since cardiorespiratory movements can be easily occluded by large body motions, we implemented a noise removal rule to exclude some of the segments. In particular, we computed the first derivative of the raw accelerometer data, aggregated the squared components with a square root summation, and excluded the segments that
went above a certain threshold. This threshold was empirically set to 0.15 for part of the analysis, which was the maximum value observed during the validation study. After excluding segments with large motions, we were able to preserve around 85.87% of the recordings (yielding n = 97,510 samples, corresponding to 26.94 hours of in-situ sleep measurements). Table V shows the performance metrics obtained with the different motion-based sensors, the E3’s BVP, and the different combinations. As can be seen, the mean absolute errors are comparable to the results shown on Table III for the supine position. Thus, preliminary findings from wearing the sensor for sleeping at home matched the quality obtained from the laboratory environment. Similarly, the gyroscope (ME: 1.02) yielded significantly better performance than the accelerometer alone (ME: 1.45; Permutation-Test, p<0.001), and their combination outperformed each individually (ME: 0.95, p<0.001). Furthermore, the combination of all the sensors yielded significantly better performance (ME: 0.81, p<0.001) than E3’s BVP or motion-based sensors separately, providing further support that light-based and motion-based sensors contain complementary information.
Fig. 7 shows a representative example of one night of sleep for one of the participants. The top graph shows the gold-standard heart rate (obtained with the Alive sensor) and the heart rate estimation obtained when combining motion-based sensors. Due to the overlap during the segmentation, HR at each point was computed as the average of HRs obtained from each of the segments that contained that data point. As can be seen, both estimates are closely aligned for the whole duration of the recording. Red areas on the top graph indicate the sections that were excluded for the analysis due to excessive motion artifacts (threshold 0.15). For most of these areas, the effect of motion artifacts can be seen as abrupt sporadic changes of HR estimates. Note, however, that when analyzing signals over a long period of time, these sporadic peaks can be easily removed by encoding contextual rules that enforce smoothness of the changes. Nevertheless, for the purpose of this study, we wanted to avoid adding additional layers of complexity and enable a fair comparison across sensors. Raw accelerometer and gyroscope readings are shown on the middle and bottom graphs, respectively. These graphs illustrate that the gyroscope is less affected by motion than the accelerometer, which may be one reason why it, when used solo, outperforms the accelerometer.
Artifacts: During the previous analysis we excluded
segments that contained motion artifacts above a pre-defined
5 10 15 20 25 30 35 40 45 50 0 2 4 6 8 10 12 14 16 18 M ean A bs ol ut e E rror Accelerometer Gyroscope Accel. + Gyro. 5 10 15 20 25 30 35 40 45 50 0 0.5 1 1.5 2 2.5 Sampling Rates M ean A bs ol ut e E rror
Fig. 6. Mean absolute error for heart rate (top) and breathing rate estimation (bottom) when considering different sampling rates.
TABLEV.HEART RATE ESTIMATION DURING SLEEP (N:95,510)
Sensor ME STD RMSE CC Gyroscope 1.02 3.96 4.08 0.93 Accelerometer 1.45 5.30 5.79 0.88 E3 BVP 1.08 3.10 3.28 0.96 Gyro.+Accel. 0.95 3.48 3.61 0.95 Gyro.+Accel.+E3 0.81 2.37 2.51 0.97 Gyroscope+E3 0.83 2.44 2.57 0.97 Accelerometer+E3 0.97 2.85 3.01 0.96
ME = Mean absolute error (beats per minute), STD = Standard deviation of the absolute error, RMSE = Root mean squared error,
threshold based on our validation study, which enabled us to estimate heart rate for around 86% of the data. In order to assess the impact of this parameter on performance, we computed the mean absolute error for different artifact thresholds. Fig. 8 shows the amount of excluded information for different thresholds (left) and performance for different combinations of sensors (right). As expected, using smaller thresholds to remove motion artifacts yields better performance but also limits the amount of data that we could analyze. For instance, when using a threshold of 0.05, we can obtain a mean absolute error of 0.67 beats per minute when using the combination of all the sensors but we can only provide estimates for around 77% of the data. As can be seen on the right graph, the gyroscope has more tolerance to artifacts than the accelerometer and, therefore, shows better performance. On the other hand, the E3’s BVP sensor seems to degrade more slowly with the inclusion of larger motion artifacts. The combination of both motion-based sensors always outperformed each of the motion sensors alone, and outperformed the E3 for lower artifact thresholds (smaller than 0.33). Finally, the combination of all modalities always yielded
better performance than the others, irrespective of the artifact thresholds. Note that the results described in the previous section correspond to the results obtained when the artifact threshold is 0.15.
VI. DISCUSSION
Motivated by previous work with head-mounted sensors [9], this work has proposed low-complexity algorithms that estimate heart and breathing rates from motion sensors. These algorithms use traditional signal processing techniques to ensure minimal processing power in anticipation of designing a real-time vital signs monitor. The proposed methods were validated in a laboratory control study with 12 participants, across different body postures and HR and BR ranges: pre- and post- exercise. Among some of the main results, we have shown that traditional sensors for BCG such as accelerometers can sense heart and respiratory activity from the wrist, a more peripheral location than traditional studied locations (e.g., on the chest [6][13], ear [8], below the feet [11][22]) even when the sensor is not in contact with the chest. This finding has the potential of enhancing the Fig. 7. Representative example of heart estimation with motion-based sensors on the wrist (dashed-green) and chest ECG electrodes (blue) during one night of sleep. Raw accelerometer (middle) and gyroscope (bottom) readings. Red areas in the top graph indicate regions with excessive accelerometer motion.
0.1 0.15 0.2 0.25 0.3 0.35 0.4 0.45 0.5 76 78 80 82 84 86 88 90 92 94 Artifact Threshold G ood S am pl es (% ) Gyroscope Accelerometer E3 Gyro.+Accel. Gyro.+Accel.+E3 Gyroscope+E3 Accelerometer+E3
0.1 0.15 0.2 0.25 0.3 0.35 0.4 0.45 0.5 0.6 0.8 1 1.2 1.4 1.6 1.8 M ean A bs ol ut e E rror Artifact Threshold
capabilities of most currently available wrist-worn wearable devices, which already incorporate motion sensors for the purpose of artifact detection and behavioral understanding. We have also found that accelerometers outperformed the gyroscopes when estimating HR but gyroscopes outperformed the accelerometers for BR estimation. Furthermore, the combination of both sensors yielded slightly better performance for HR estimation. While accelerometers seem to be one of the preferred choices to sense BCG movements in the literature (e.g., [6][8][13][18]), gyroscopes have shown promising results that can complement and outperform acceleration measurements by capturing rotatory motions and being less prone to motion artifacts. Both the gyroscope and the accelerometer have also been compared with a state-of-the-art wrist-worn device that measures blood volume pulse from the wrist for HR estimation. While results from the light-based BVP measurements were better than from the motion sensors in the validation study that was not the case for the real-life sleep setting. Furthermore, the combination of all the sensors yielded better results. While motion-based BCG measurements usually contain more noise than light-based PPG measurements, the recording of BCG requires less energy and does not need to be tightly attached to the body to provide accurate readings. We have also provided results across different sampling rates and discussed their implications in terms of performance, battery power and storage space which are critical aspects in the design of wearable devices. Finally, we have shown preliminary results supporting generalization of these methods in real-life settings such as home sleep. While these results are very promising, future efforts need to focus on collecting information from a larger number of participants, and from more daily activities to characterize what portion of different kinds of daytime activities can yield reliable readings.
VII. CONCLUSIONS
This paper we presented methods for recovering cardiorespiratory signals from accelerometer and gyroscope measurements using a wrist-worn sensor, performed validation of two physiological measurements (HR, BR) in a controlled laboratory setting, provided preliminary validation of heart rate estimation from wrist-worn motion sensing in a real-life sleep setting, and demonstrated improved accuracy when combining wearable light-based and motion-based sensors. Our findings are very encouraging and promise to enhance the capabilities of existing wearables. We hope in the future similar approaches can be used not only to improve the accuracy of physiological assessments but also to facilitate low-cost and unobtrusive measurement of vital signs during daily life.
ACKNOWLEDGMENT
This work is based upon work supported by the National Science Foundation (NSF CCF-1029585), the Samsung Think Tank Team, and the MIT Media Lab Consortium.
REFERENCES
[1] J. Alametsa, J. Viik, J. Alakare, A. Varri, and A. Palomaki. “Ballistocardiography in sitting and horizontal positions.” Physiological Measurement, 29 (9), pp. 1071-1087, 2008.
[2] J. Allen, “Photoplethysmography and its application in clinical physiological measurement,” Physiol. Meas., 28 (3), pp. R1–39, 2007. [3] C. Brüser, S. Winter, S.Leonhardt, “Robust inter-beat interval estimation
in cardiac vibration signals.” Physiol. Meas., 34 (2), pp. 123-38, 2013. [4] M. Brink, C. H. Müller, and C. Schierz, “Contact-free measurement of
heart rate, respiration rate, and body movements during sleep,” Behavior Research Methods, 38 (3), pp. 511-521, 2006.
[5] S. Cook, M. Togni, M. C. Schaub, P. Wenaweser, and O. M. Hess, “High heart rate: a cardiovascular risk factor?” European Heart., 27 (20), pp. 2387–2393, 2006.
[6] A. Dinh, “Heart Activity Monitoring on Smartphone,” In Proc. of Int. Conf. on Biomedical Engineering and Technology, 11, pp. 45-49, 2011. [7] L. Giovangrandi, O. Inan, R. Wiard, M. Etemadi, and G. Kovacs,
“Ballistocardiography - a method worth revisiting.” In Proceedings of Engineering in Medicine and Biology Society, pp. 4279-4282, 2011. [8] D. D. He, E. S. Winokur, and C. G. Sodini, “An ear-worn continuous
ballistocardiogram (BCG) sensor for cardiovascular monitoring,” In Proc. of Eng. in Medicine and Biology Society, pp. 5030–3, 2012. [9] J. Hernandez, Y. Li, J. Rehg, R. W. Picard. “BioGlass: Physiological
Parameter Estimation Using a Head-mounted Wearable Device,” In Proc. of Wireless Mobile Comm. and Healthcare, pp. 55-58, 2014. [10] A. Holland. “Telehealth reduces hospital admission rates in patients with
COPD,” Physiotherapy, 59 (2), p. 129, 2013.
[11] O. T. Inan, M. Etermadi, R. M. Wiard, L. Giovangrandi, and G. T. Kovacs, “Robust ballistocardiogram acquisition for home monitoring,” Physiological Measurement, 30 (2), pp. 169-85, 2009.
[12] K. Kawamoto, H. Kuriyama, and S. Tajima, “Actigraphic Detection of REM Sleep Based on Respiratory Rate Estimation,” Medical and Bioengineering, 2 (1), pp. 20-25, 2013.
[13] S. Kwon, J. Lee, G. S. Chung, and K. S. Park, “Validation of heart rate extraction through an iPhone accelerometer.,” In Proceedings of Engineering in Medicine and Biology Society, pp. 5260–5263, 2011. [14] M. Malik, J. T. Bigger, A. J. Camm, R. E. Kleiger, A. Malliani, A. J.
Moss, and P. J. Schwartz. “Heart rate variability: Standards of measurement, physiological interpretation, and clinical use.” In European Heart Journal, 17 (3), pp. 354-381, 1996.
[15] M. Migliorini, A. Bianchi, D. Nisticò, J. Kortelainen, E. Arce-Santana, S. Cerutti, and M. Mendez, “Automatic sleep staging based on ballistocardiographic signals recorded through bed sensors.” In Proc. of Engineering in Medicine and Biology Society, pp 3273-6, 2010. [16] J. Paalasmaa, M. Waris, H. Toivonen, L. Leppäkorpi, and M. Partinen.
“Unobtrusive online monitoring of sleep at home.” In Proceedings of Engineering in Medicinne and Biology Society, pp. 3784-3788, 2012. [17] J. Pan and W. J. Tompkins, “A Real-Time QRS Detection Algorithm,”
IEEE Trans. on Biomedical Engineering, 32 (3), pp. 230-36, 1985. [18] D. H. Phan, S. Bonnet, R. Guillemaud, E. Castelli, N. Thi, “Estimation
of respiratory waveform and heart rate using an accelerometer,” In Proc. of Engineering in Medicine and Biology Society, pp. 4916-9, 2008. [19] E. Pinheiro, O. Postolache, P. Girão, “Theory and developments in an
unobtrusive cardiovascular system representation: ballistocardiography.” Open Biomedical Engineering, 4 (1), pp. 201-216, 2010.
[20] I. Starr, A. J. Rawson, H. A. Schroeder, and N. R. Joseph, “Studies on the estimation of cardiac output in man, and of abnormalities in cardiac function, from the hearts recoil and the bloods impacts; the ballistocardiogram,” American Journal of Physiology, 127 (1), 1939. [21] G. Troster, “The agenda of wearable healthcare,” IMIA Yearbook of
Med. Info. 2005: Ubiquitous Health Care Sys, pp. 125-138, 2004. [22] R. Wiard, O. Inan, B. Argyres, M. Etemadi, G. Kovacs, and L.
Giovangrandi. “Automatic detection of motion artifacts in the ballistocardiogram measured on a modified bathroom scale.” Medical and Biological Engineering and Computing., 49 (2), pp 213-220, 2011. [23] Y. Zheng, X. Ding, C.C. Poon, B.P. Lo, H. Zhang, X. Zhou, G. Yang, N.
Zhao, Y. Zhang. “Unobtrusive Sensing and Wearable Devices for Health Informatics,” In Biomedical Engineering, 61 (5), pp. 1538-54, 2014.