HAL Id: halshs-01626848
https://halshs.archives-ouvertes.fr/halshs-01626848
Submitted on 31 Oct 2017
HAL is a multi-disciplinary open access archive for the deposit and dissemination of sci-entific research documents, whether they are pub-lished or not. The documents may come from teaching and research institutions in France or abroad, or from public or private research centers.
L’archive ouverte pluridisciplinaire HAL, est destinée au dépôt et à la diffusion de documents scientifiques de niveau recherche, publiés ou non, émanant des établissements d’enseignement et de recherche français ou étrangers, des laboratoires publics ou privés.
20th Century
Jérôme Bourdieu, Lionel Kesztenbaum, Gilles Postel-Vinay, Akiko
Suwa-Eisenmann
To cite this version:
Jérôme Bourdieu, Lionel Kesztenbaum, Gilles Postel-Vinay, Akiko Suwa-Eisenmann. Intergenerational Wealth Mobility in France, 19th and 20th Century. Review of Income and Wealth, Wiley, 2019, 65 (1), pp.21-47. �10.1111/roiw.12336�. �halshs-01626848�
Intergenerational wealth mobility in France,
19th and 20th century
Jérôme Bourdieu (PSE-INRA and EHESS) Lionel Kesztenbaum (INED and PSE)
Gilles Postel-Vinay (PSE) Akiko Suwa-Eisenmann (PSE-INRA)
This version: September 2016. Preliminary
Abstract
This paper examines intergenerational wealth mobility between fathers and children in France between 1848 and 1960. Considering wealth mobility in the long run requires taking into account not only positional mobility (that is, how families move within a given distribution of wealth), but also structural mobility induced by changes in the distribution of wealth itself. Such changes are related to two structural phenomena: the rising number of nineteenth-century individuals leaving no estate at death and the post-World War One decline in the number of the very rich who could live off their wealth. The usual indicators of intergenerational mobility, such as intergenerational elasticity, must be improved accordingly.
Keywords: wealth distribution, intergenerational mobility, France, economic history JEL codes: D31, N3
Acknowledgements
This work was supported by the ANR research fund (grant ANR-11-INEG-0001). We are grateful to Denis Cogneau, Ryo Kambayashi and Daniel Waldenström for their useful comments and suggestions as well as participants at the workshop in HKUTS (November 2013); the XVIII ISA World Congress of Sociology (Yokohama, 2014); the All-UC Conference “Unequal Chances and Unequal Outcomes in Economic History” (CalTech, 2015); the 17th World Economic History Congress (Kyoto 2015); the workshop “Understanding inequalities” at the Institute for Social Studies University of Tokyo (Hitotsubashi, 2016); and the Applied Economics Lunch Seminar at the Paris School of Economics (2016).
1 Introduction
The study of mobility complements the characterization of a society obtained from examining inequality. Inequality gives a snapshot of the distribution of income or wealth within a society at one point in time, while mobility concerns following movements of individuals or families over time across the distribution (Jäntti and Jenkins, 2015). A high degree of (upward) mobility is perceived as dampening the impact of rising inequality as people hope to climb the ladder, even if the rungs are farther apart. Against the background of this “prospect of upward mobility”, Corak (2013) shows that countries with more inequality also experience less earnings mobility across generations, a negative correlation that has been labeled “the Great Gatsby curve” by various authors. But Chetty et al. (2014) find that income inequality and income mobility are not sensitive to the same parts of the income distribution. Inequality is driven by the extreme upper tail (the top 1%), while mobility is more sensitive to what happens to the middle class. We follow up on this idea of differential mobility across the distribution but instead on analyzing income, we focus on wealth. Indeed, people at the top or at the bottom of the wealth distribution are likely to save and transmit their social status in very different ways. As a consequence, intergenerational mobility is unlikely to be homogeneous across the wealth distribution.
An increasing number of papers look at mobility between generations, and they do so by comparing children to their fathers (Solon, 1992; Corak and Heisz, 1999; Black and Devereux, 2011; Björklund, Roine and Waldenström, 2012) or even their grandfathers (Solon, 2014; Adermon, Lindahl and Waldenström, 2015). Most of these papers use contemporaneous data from Europe and North America to examine income mobility. A few studies go back to the nineteenth century (Long and Ferrie, 2013, on occupational mobility) or look at wealth mobility (Clark and Cummins, 2015; Boserup, Kopczuk and Kreiner, 2014; Lindahl and Waldenström, 2015). It is for two reasons that examining mobility based on wealth data is a useful complement to results obtained from income data. First, wealth is considered to be a more permanent measure of economic status than yearly income; second, and moreover, inheritance might explain the persistence of inequality.
In this paper, we study the intergenerational mobility of wealth in France between 1848 and 1960. Our contribution comes from the length of our timeframe. For over more than a century, society has evolved: social groups have gained or lost importance, new opportunities have emerged and activities have shifted from one place to another. Hence, individuals have not only moved within a given distribution, but the shape of the overall distribution has also changed. In such a context, it is not sufficient to simply transpose the previous literature, which was devised mostly for shorter periods and for income. We argue that the long-run changes in the distribution of wealth across generations must be taken into account when studying wealth mobility. In particular, two factors shape the change in the distribution of wealth and, as a result, impact mobility across generations: the rise in wage earners and the decline in the very rich who could afford living off their capital.
We depart from works that abstract mobility based on changes in the structure of society. Papers that do so focus on positional mobility for instance by comparing ranks within a given distribution. Although they provide valuable results, they need to define “a hierarchy of positions” (Jäntti and Jenkins, 2015: 812). To do so for income is much easier than for wealth since a large share of the population do not have any wealth at all. In fact, due to the high degree of concentration of wealth, comparing individual ranks may have little sense: at one end of the distribution many people live without wealth whereas at the other end of the distribution the very rich own amounts of wealth that cannot compare with those of average individuals.
In addition, when looking in the long run, the very meaning of hierarchy changed a lot: the number of people in a given position not only varies over time, but also the very existence of that position itself, or even its desirability among other available positions in society. For instance, holding no assets in an agricultural society is not the same as in an industrialized society, where wage earning provides access to other resources (e.g., pensions) And in fact, it is the very phenomenon we are trying to capture.
Here we focus on gross total mobility between fathers and children: the pure variation between the wealth of an individual and that of his father (it’s the wealth equivalent of what Jäntti and Jenkins define for income as individual growth). We do however, take into account structural changes as we examine the variations in mobility between different groups whose shares are changing over time. We show that the degree of mobility varies over time and at different points in the wealth distribution. There is no constant correlation between mobility and inequality. The very high wealth inequality that existed up to the eve of the First World War went along with moderate (downward) mobility between the three wealth groups. Within those groups, mobility for children of middle group fathers was countercyclical, as it was higher during recessions than during periods of growth. During the interwar period, wealth inequality dropped while mobility rose both between and within groups. This changed after 1940, when fathers in the top wealth group were able to transmit their status better (hence, less mobility), even though the level of their wealth had been reduced.
The remainder of the paper is organized as follows. Section 2 describes the data and the context of wealth inequality in France. Section 3 presents mobility matrices between the three groups of wealth across generations. Section 4 discusses the estimates of mobility in relation to the evolution of inequality. Section 5 characterizes mobility by individual characteristics and movement directions. Section 6 concludes.
2 Data and context 2.1. Data
We use the TRA database, which is an extensive, long-term survey of the French population (Dupâquier and Kessler 1992; Bourdieu, Postel-Vinay, and Suwa-Eisenmann 2004; Bourdieu, Kesztenbaum, and Postel-Vinay 2013). This survey is representative of the French population
and collects data in various archives for all individuals whose names start with the letters “TRA”. It documents their situation at death, including age, marital status, profession, place of residence and estate (Bourdieu, Postel-Vinay, and Suwa-Eisenmann 2004). Two features of the TRA survey are of particular importance for studying intergenerational mobility: first, it enables reconstruction of genealogies; second, by following individuals all over the country, the survey overcomes the selection issue that would arise if one were limited to families who remained in the same place.
In this paper, we take adult children (boys and girls) whose father's situation is also fully documented in the database (see Appendix A).Our final sample encompasses 6,777 father-child pairs.1 Among them, there are 3,951 different fathers (some fathers have only one child in the sample, some have many). The variable used as an indicator of wealth is individual gross assets at death, deflated by a national cost of living index. The source also indicates explicitly if there is no estate at all.
As the sample selection considers individuals whose names begin with the letters “TRA”, the dataset includes men and women whose maiden name is “TRA”. Thus, we have pairs of fathers and boys or fathers and girls, but we lose mothers (as their children will be under their father’s name). Missing wealth transmitted by the mother biases mobility patterns, but this does not matter so much, as women did not enjoy financial autonomy at that time and, thus, their capacity to accumulate savings on their own was quite limited. Most of their wealth was likely to come from inheritance. If one tends to marry in their wealth group (assortative matching), the degree of mobility would be underestimated; but the evolution and comparison between groups would still be valid.
The source also indicates explicitly if there is no estate at all. The value of assets is based on information gathered by the Fiscal Department (l’Enregistrement), which – in order to levy universal inheritance taxes – carries out meticulous inquiries into the value and composition of the deceased’s assets. All assets were valued with equal attention by fiscal officials (Daumard 1973), and attempted fraud remained limited. Even though they had to deal with increasingly varied and sometimes complex assets, the fiscal officials developed and adapted an informational apparatus which allowed them to avoid a substantial increase in concealment. Indeed, no type of asset systematically escaped the attention of the Registration Department. On the one hand, rates were low for the wide majority of the population, who thus had very little incentive to cheat: they were only 1.25% on average (for direct-line succession at least) during the 19th century and, except for the very rich, they remained modest when the tax became progressive after 1901.2 On the other hand, the new types of assets – the financial assets, which were particularly important in the wealthiest estates – were
1 Men who died as soldiers during WWI (proxied by the fact that they were between 20 and 40 years old) are
dropped from the sample.
2 WWI ushered in a very serious effort to tilt the burden to the rich. By the 1930s the 1% was paying an estate
tax rate twice as high as the middle class. Though modest, the progressivity was indeed real, with the P70-90 group paying about 10% while the 1% paid above 20% on average in inheritance taxes.
well observed and valued by the fiscal apparatus.3 Moreover, the tax brought an important benefit that offset its cost: filing a return was an easy way to register changes in property titles. There is ample evidence that beneficiaries followed the law.
2.2. The French context
France was mostly rural at the beginning of the 19th century and has gradually become more urbanized and industrialized. As a consequence, the share of wage earners in the total population has increased. It should be noted, however, that the frontier between independent workers and wage earners was not always clear cut: wage earners used to finish their careers as independent workers, such as shopkeepers. People used to work past 60 years old, performing less physically demanding tasks, at least before the extension of pension benefits. Retirement schemes appeared in civil service and in a few industries such as mining and railroad companies before being extended after 1945.
Historians look at mobility in France mostly through the prism of a “metamorphosis of the social structure” (Marchand and Thélot 1997). The French Revolution broke down the société d’ordres (made up of nobility, clergy and the Tiers-Etat), and it was hoped that the society would be more fluid, with high mobility and the elimination of privileges. However, industrialization and the stagnation of wages resulted in poverty traps.
Wealth inequality was very high in France between 1848 and 1960. The Gini index was above 0.8 (Figure 1a). This high level of inequality took place in a period of growth (proxied here by
real per capita GDP in Figure 1b). The Gini index declined during the interwar period.
The real per capita GDP in Figure 1b is computed as a five-year moving average, thus
smoothing out economic cycles. After several decades of slow growth in the early nineteenth century and a deep crisis on the eve of the Second Republic (1848), industrialization accelerated under the Second Empire (1852–1870) and the stock market boomed. This sequence of prosperity was interrupted by war, the loss of two rich regions of Eastern France and the Commune in Paris. A long deceleration followed (1870-1895), during which agriculture suffered most while there was also a financial crisis and long lasting unemployment in the industrial sector. Growth resumed at the turn of the twentieth century (the "Belle Epoque"). France then entered a period of turmoil, as did most of Europe and large swaths of the world: war (1914-1918), inflation and crisis (1919-1938), and war again (1939-1945). Growth resumed in the 1950s. In the following, the century and a half under survey will be divided into five sub-periods4: 1848-1869 (industrialization during the Second Empire); 1870-1895 (deceleration); 1895-1913 (“Belle Epoque”); 1919-1939 and 1940-1960.
<Figure 1>
3 One important element that we leave for further research is the impact of estate taxation on the decline in
wealth inequality. However, for the purposes of this study, we have to keep in mind that inheritors from the late 1940s and ’50s are in fact the first to have received bequests that were substantially reduced by taxation.
Table 1 shows the amounts of wealth in 1912 francs, at various points in the distribution (including individuals without wealth). Mean wealth is around 10,000 Francs, and the median is at one-tenth of the mean. Wealth levels reach a maximum before 1914. After the First World War, the mean wealth is divided by half. These amounts are so low because the "distribution of wealth" actually includes many individuals who had no wealth at all and represent about a quarter of the whole sample.
<Table 1> <Figure 2>
Figure 2 shows another indicator of inequality: the ratio of wealth at various points in the distribution over the median wealth. Up to 1913, the ratios to the median increased, even more so for the top 5% of the distribution (p95). The phenomenon was even starker for the top 1% or the top 0.1% (Piketty 2010; Piketty, Postel-Vinay, and Rosenthal 2006). As the TRA survey does not over-sample the richest, it catches very few individuals from the top percentile of the national distribution of wealth. During the interwar period, the ratios decreased at all points in the distribution. While wealth stagnated on average after 1940, the wealth of the top decile increased by 25%. As a result, the P90/P50 wealth gap, which had receded during the interwar period, widened again in 1940-1960 to a ratio similar to the one observed before World War I. These wealth gaps confirm the high inequality during the second half of the nineteenth century and the Belle Epoque, which even increased at the top. This was followed by a decline in inequality after the First World War, but not in a parallel manner between the very top and the rest of the distribution.
2.3 The three wealth groups
Between 1848 and 1960, wealth did not evolve in the same way, depending on one’s place in the distribution. We choose to focus on three wealth groups. One group is made up of individuals who died without any assets. Another group is made up of the “very rich”, the people at the top of the distribution. In between comes the “middle group”.
We define the top group, the very rich, as individuals whose wealth is above a given threshold.5 The threshold needs to be exogenous in order to obtain meaningful comparisons
between periods. We define the top group as individuals whose wealth yields the average income at that time. Fixing a threshold is to some extent arbitrary. Here, we consider a group of people who – without working or having any other revenues, monetary or not – would earn a level of income matching the mean income of their contemporaries and not a subsistence wage. As incomplete as it may be, it is still a reasonable measure of the first step into the world of rentiers (those who could live off their wealth), even if most of them likely worked. More precisely, we compute the amount of wealth which would generate a yearly income
equivalent to the real per capita GDP, assuming a 5% interest rate.6 The resulting minimum wealth level of the top group is given in Table 1: the threshold goes from 12,600 Francs in 1848-1869 to 21,000 Francs in 1895-1913, up to 28,000 Francs in 1914-1939 and 35,000 in 1940-1960.7 These levels are close to the minimum wealth of the top 10% at the beginning of the period and above the minimum wealth of the top 5% at the end. Earning the average income might not actually be enough to live at ease in cities with servants and having one’s own means of transport. As Table 1 shows, the threshold to the top group increases by 35% in the interwar period while mean wealth drops by almost half. Thus, earning the average income out of wealth alone becomes increasingly difficult in times of rapid growth, such as after 1918.
The bottom group comprises people leaving no assets at death. This group contains the have-nots, those who have no measurable economic assets – or so little that it does not count. This means they cannot rely on their personal wealth for any purpose. All their current needs depend on the flow of income that they earn or can access by other means (family, charity or the state, for instance). The fiscal authority reported even basic furniture and clothes and checked thoroughly if there was suspicion of assets, whether at home or in some other place. The fact that individuals are observed without wealth does not reflect measurement errors or tax fraud (Bourdieu, Postel-Vinay, and Suwa-Eisenmann 2003). This corresponds to true behavior, as people were earning some income without the possibility – or the willingness – to save (Bourdieu, Kesztenbaum, and Postel-Vinay 2011). The bottom group represents one-quarter of father-child pairs in 1840; it rises to 32% in the early twentieth-century before receding to 29% in the post WWII period (Figure 3). The rise is related to structural shifts in production patterns from agriculture and towards industry and services, leading to the spread of wage earners. As more and more of them began to earn a constant flow of income, to rent flats in town, and some few of them (civil servants, employees in railroad and mining companies) became entitled to retirement benefits, they were spared the need to invest in professional assets and save for their senior years. Of course, part of the bottom group also includes the real “have-nots”: those struggling to get through their daily lives.
The middle group is made up of the people in between who save, but not enough to live off the capital. However, wealth matters for them: they can have a small savings to be used as a buffer stock or even more valuable assets, such as professional assets for their work or the house where they live with their family.
The share of the three groups is given in Figure 3. The middle class represents around 66% of the population. The top group was close to 8% until WWI, after which it drops by half. The changes in social structure cannot be ignored: the seven percent increase in the share of the bottom group indicates that many children of wealthy fathers ended up without assets. Conversely, the slight decline of the bottom group in 1940-1960 means that some children of
6 We take a three-year moving average of real GDP per capita, in order to smooth fluctuations.
7 Wealth amounts are reported in 1912 francs. At the eve of World War I, one-year wages represented 1,000 to 1,300 Francs, and a farm with a 10 ha plot was worth 10,000 to 15,000 francs.
wealthless fathers entered the middle class. At the other extreme, children of fathers in the top group found it increasingly difficult to maintain their standards of living after 1914.
<Figure 3>
These three groups are in a sense, three worlds. Belonging to the top group is very different from holding some buffer stock as a precautionary savings and, of course, from having nothing at all. Table 2 characterizes these three worlds. The top group not only has more wealth, but its composition is different: they are more likely to hold real estate than the middle group. But what really distinguishes them is that they hold financial assets. They are also more likely to be male and married. Table 2 shows that both the bottom and the top group are less likely to live in rural areas compared to the middle group. Indeed, cities are places with large inequality, as they bring together the richest, the working class and the Lumpenproletariat. Because the characteristics and types of assets are different between groups, the mechanism of wealth mobility is also likely to differ. We now turn to them and examine first the movements between the three groups.
3. The intergenerational mobility matrix
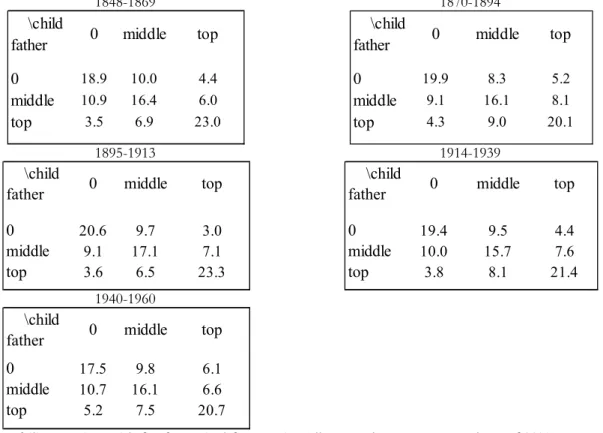
Table 3 presents intergenerational mobility matrices by periods (of children’s deaths). Each matrix shows the transition from one group to another between father and child. A first measure of mobility is the percentage of children that are not in the same group as their father. In the matrices, the cells off the diagonal increase from 37% of the sample in 1848-1869 to 42% in 1940-1960. The one exception is the crisis years of 1870-1895, when the share off the diagonal is down to 36%. Hence it seems that, overall, mobility has increased.
< Table 3>
It should be kept in mind, though, that mobility can be of two sorts. The common interpretation is upward mobility. However, in a society that becomes less dependent on capital ownership, the likely direction of mobility is rather downward, from wealthy father to wealthless children. And this is indeed the case (Figure 4): one out of five father-child pairs are on a downward trend of mobility, while less than one out of six are on an upward trend. Downward mobility is driven by the rising share of the bottom group: as there are more children than fathers in the bottom group, the “positions” in the bottom group are filled by children falling from higher classes. After 1914, the reverse occurs. Upward mobility increases and is driven mostly by children of wealthless fathers reaching the middle group, a move which is consistent with the fact that the size of the bottom group is now shrinking across generations.
When comparing matrices of different periods, however, we mix two types of mobility: (i) structural mobility, arising from the fact that the distribution of fathers and children in the three groups changes over time; (ii) positional mobility, which is related to the association between fathers’ and children’s wealth. One way of computing the positional mobility is to
transform the initial matrix into one, with the marginal frequencies held fixed for all periods (Mosteller 1968; Altham and Ferrie 2007). Such a transformation is achieved by multiplying the rows and the columns of the matrix by arbitrary constants, which do not alter the underlying associations between cells. Mobility matrices with fixed marginal frequencies are presented in the Appendix (Table A 2). In these matrices, the size of the three groups is the same throughout the periods, each weighting one-third of the total population. The resulting upward and downward mobility are illustrated in Figure 4. As expected, mobility (measured by the share of off-diagonal cells), is higher once structural changes are omitted. This is due to upward mobility toward the top, which is magnified once the “top” is assumed to represent 30% of the distribution. Positional mobility (the sum of upward and downward mobility in the matrix with fixed margins) moves opposite to total mobility, which includes the structural changes (computed with the initial matrix) that occurred during the nineteenth century. For instance, positional mobility increases in 1870-1894 and is at its lowest in 1895-1913. Total mobility, influenced by the structural changes resulting from the share of the bottom group, is slightly lower in 1870-1894. After 1914, both positional and total mobility rise. Overall mobility is driven by upward movements (from the bottom to the middle class), while both directions are at play for positional mobility.
<Figure 4>
4. The intergenerational elasticity of wealth
4.1. Intergenerational elasticity in the three worlds
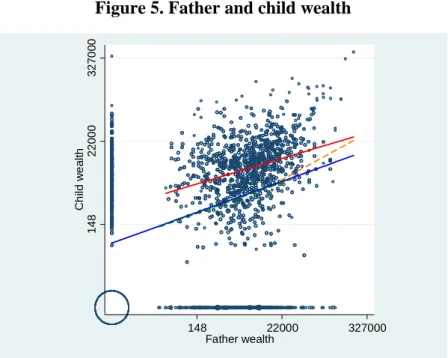
Figure 5 plots the actual distribution of wealth for fathers and children. Each dot represents a combination of a father’s and a child’s wealth, weighted by the frequency of that combination – this matters mostly for the large number of (0,0) pairs, hence the large circle at the origin. Along the X and the Y axis appear individuals with zero wealth, either children (on the Y-axis) or fathers (on the X-Y-axis). At the center lies the cloud of positive wealth pairs.
Figure 5 reveals a positive relationship between the wealth of fathers and children. A perfect transmission of wealth from father to child would be indicated by the 45° line. The red line represents the fit when both father and child have a positive asset: if the slope is positive but less than the 45° line, there is a correlation between the father’s and child’s wealth, but with some mobility. The blue line is the fit for all father and child pairs, including those without wealth. The blue line is below the red line and extends to the vertical axis (as the sample now includes wealthless fathers). The blue line intersects the Y-axis at a positive value (around 140 francs): among the children of the bottom group fathers, some do have positive wealth; thus, on average the wealth of that group is above zero. The slope of the blue line is also slightly steeper than that of the red line, as it accounts for the fact that there are pairs of fathers and children who are both without wealth. We can also isolate fathers in the top group. If the father belongs to the top group (the orange dotted line), the slope becomes much steeper
at close to the 45° line of perfect transmission. There is less mobility in the top group than in the middle group.
<Figure 5>
A standard measure of intergenerational income mobility is Intergenerational Elasticity (IGE), which measures the relation between the log of child’s income and the log of father’s income, controlling for age (Solon 1992, Corak 2004). An IGE equal to 1 means complete immobility and persistence of income hierarchy across generations. An IGE equal to 0 means complete mobility and reshuffling of social positions. A useful interpretation of the IGE coefficient is that it indicates how many generations it takes to dilute some initial level of inequality. With an IGE of 0.2, initial inequality vanishes in two generations; with an IGE of 0.8, 64% of the initial inequality remains in the second generation. As such, the IGE measures the speed of the reversal to the mean.
Transposing this measure to estimate intergenerational wealth mobility is not straightforward. First, at the bottom of the wealth distribution are a large number of non-asset owners with no counterpart when considering income. Second, since wealth is very concentrated, the transmission mechanisms differ at the top of the distribution. As a result of complete absence and extreme concentration of wealth at both ends of the wealth distribution, it is misleading to summarize intergenerational wealth mobility with one coefficient of elasticity. Thus, we augment the standard IGE approach in order to capture the non-linear aspect of wealth transmission between fathers and children. We introduce the two dummies d and D for, respectively, children of fathers in the bottom group and fathers belonging to the top group.
w =α+β β W*D + β D + β d γ1Zi + γ2zi + δ + εi (1)
with wi (resp. Wi) being the wealth of the child (resp. father) in family i. To take into account
both the extreme concentration at one end of the wealth distribution and the absence of wealth at the other end, we transform wealth with an inverse hyperbolic sine function. This function is identical to a logarithm, except that f(0)=0.8 The variables Z and z control for individual characteristics of father and child: life-cycle behavior, namely the fact that wealth decreases after retirement (approximated here at age 60), and differences in inheritance and wealth accumulation between men and women (for children only). Equation (1) also includes a dummy for periods of children’s deaths.
The usual IGE would be β. In the case of wealth, we characterize mobility by adding to β the three coefficients β , β .and β , which capture the heterogeneity of the process of wealth transmission. Thus, the IGE for the middle group of fathers is β. The IGE for the top group of fathers is β β . The average wealth obtained by children whose fathers are in the bottom group is β .
4.2. Results of the standard IGE estimation
To begin, we present the usual estimation of the intergenerational elasticity of wealth (IGE) between fathers and children in order to compare it with previous works (Bourdieu, Postel-Vinay, and Suwa-Eisenmann 2008, Solon 2002). Hence, we estimate equation (1) with β , β and β set to 0. Panel(a) in Table 4 ignores the existence of 0 values and presents the results estimated on the sample of father and children with positive wealth: if we consider all periods, β is equal to 0.32 .
If we now introduce the 0 values (panel (b)), the IGE for all periods is slightly higher at 0.35. This means that if a father's wealth is twice above the mean of his generation (100% higher), his child will still be 35% above the mean wealth of his/her own generation. Thus, it takes three generations to dilute initial inequality. The estimated IGE for wealth is of the same order of magnitude as contemporary estimates of IGE for income, which are around 0.4 (Corak 2013).
Taking into account the zero values matter for the chronology. In panel (a), β varies from 0.36 in 1848-1869 to 0.18 in 1940-1960, with a drop to 0.31 in 1870-1894. With the zero values, the IGE also begins at 0.36 in 1848-1869 but increases continuously until reaching a maximum of 0.40 in 1913 before decreasing to 0.23 in 1940-1960.
The intergenerational correlation of log wealth (IGC) takes into account generational differences in inequality between fathers and children. It is less often used than the IGE because it is more subject to measurement errors. The IGC is reported at the bottom of Table 4, where we can see that it evolves in parallel with the IGE: it is lower than the elasticity until 1914 (because wealth inequality is increasing), and then becomes higher afterwards (when wealth inequality decreases between generations). As both indicators report the same evolution, we report the IGE only in the following estimates.
<Table 4>
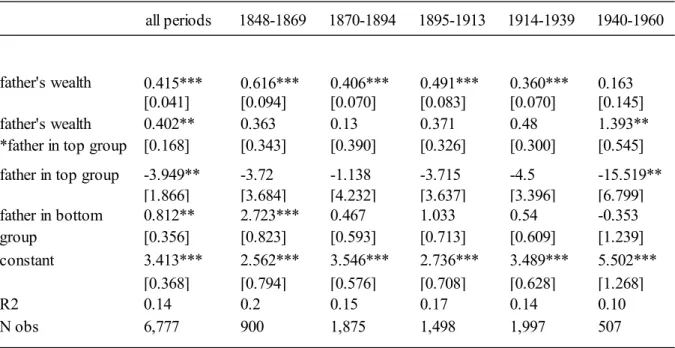
Table 5 presents the results of equation (1). Now, the coefficient β is the IGE for children with fathers in the middle group. For all periods, it is equal to 0.41, higher than in the naive estimate. The IGE for fathers in the top group is β β , equal to 0.81. The top group is thus characterized by lower mobility than the middle group. Children who have not received any inheritance from their fathers are not systematically handicapped; they end on average with positive wealth, albeit small (β3 is positive and significant). Actually, this is true only during
the halcyon days of the Second Empire: for the other periods, the effect of having a father in the bottom group does not appear significant.
In 1848-1869 and again in 1895-1913, both growth periods for the children's generations, the coefficient β is high (meaning lower mobility), whereas it is rather low (meaning higher mobility) during recessions, such as the period of hardship that followed the Second Empire. To have a father in the richest group means an overall advantage, with the coefficient always around 0.4; although this is not significant when we detail by period. The last period,
1940-1960, is quite peculiar with a very high estimated coefficient for the children of the wealthiest. This can be linked to the economic growth in that period, which makes the threshold of remaining in the top group much higher. Hence, it is harder to get to the top in that period, and this translates into a clear advantage for those with a father in the top group. Despite the fact that the parents’ wealth level was lower in that period, the top group managed to transmit their wealth to their children better than the middle group did.
4.3. Inequality and mobility
The augmented IGE estimates shows that for children in the middle group (the largest one), wealth mobility declined during economic growth and increased during recessions in the nineteenth century. This result is similar to the lesson taken from positional mobility between groups in the mobility matrices. Hence, during the second half of the nineteenth century, intergenerational mobility was the result of two factors: movement between groups, which was mostly downward because more positions had to be filled in the bottom group; and counter-cycle mobility for children of middle group fathers, which was high during recessions and low during economic booms. It is likely that children lose more in comparison to their fathers during recessions. The picture of mobility that emerges is not the intuitive one of permanent upward mobility. Rather, mobility also comprises movements down the social ladder, first within the middle class and then from the middle class to the bottom group. Meanwhile, inequality skyrocketed because of the increasing wealth gap between the upper tail of the distribution (P95 and up) and the median wealth (see Figure 2 above). Hence, it seems that inequality is driven by what happens at the top, while mobility is determined by what happens both between the bottom and the middle group and within the middle group. The relationship that emerges between inequality and mobility is one of disconnection. Both phenomena respond to factors that occur at different places in the wealth distribution.
After 1914, mobility for children of middle group fathers increased. In 1940-1960, the β coefficient linking child wealth to the wealth of middle group fathers is not even significant. However, the top group retained its specificity and achieved a high degree of persistence in that period, even though the level of wealth was globally lower. The transition matrices also show more movements between the wealth groups after 1914: an upward move from bottom to top, as the share of the bottom group stabilizes and declines; and a downward move from top to middle, as the top group declines. That group is cut by half, as their children cannot live off their wealth anymore and often end up in the middle group. The relationship between inequality and mobility after 1914 is something we are more used to: higher (upward) mobility goes along with a decrease in inequality.
<Table 5>
4.4. Robustness
We tested alternative definitions for the two extremes of the wealth distribution (Table A3 in Appendix). First, for the top group: we define it as the top wealth decile (panel 1) or omit the top centile (panel 2). Second, for the bottom group: we include fathers whose wealth is
positive but very small, here below 100 francs (panel 3); or we attribute to wealthless individuals (both father and child) a hypothetical positive value randomly drawn from the bottom decile of positive wealth (panel 5a and 5b)9. Finally, we estimated a Tobit function for those with no wealth.
The IGE for children of middle group fathers is of the same order of magnitude (around 0.4), and the IGE for children of top group fathers is consistently higher (at around 0.8) in all specifications except one. The exception is, understandably, the specification where we attribute positive (and not negligible) values to the wealthless: the IGE for children of middle group fathers decreases to 0.22 for all periods, while the IGE for children of top group fathers is at 0.7. By periods, all specifications show the same pattern of lower mobility in 1895-1913 and rising mobility afterwards.
The different specifications show our results are robust to small changes in the borders of the three groups under study. In addition, we also estimated different polynomial specifications, but they make little difference (results not shown). This reinforces our main findings that wealth mobility varies in different parts of the wealth distribution, which is particularly lower at the top. As an additional robustness test, we look at wealth mobility over three generations.
4.5. Three generations
For a smaller sample, we do have information on wealth at death over three generations: grandfathers, fathers, and children. Using this sample, we test the effect of the grandfather's wealth (Table 6). First, we include it along with the father's wealth in an OLS estimation. In that case, the grandfather's wealth has no significant effect on the grandchild's wealth, once controlled for the father's wealth. Second, we use the grandfather's wealth as an instrument for the father's wealth in the IGE estimation (here, we do not interact with a dummy for the top group, due to sample size). The coefficient of the father's wealth is equal to 0.33, close to the 0.35 figure estimated for the IGE with two generations (Table 4, panel b). The coefficient of the grandfather's wealth on the father's wealth is equal to 0.54, higher than the IGE estimated between father and child. This might come from the fact that the grandfather-father pairs are more selected: both are men, must have been married and have a child that survived until adulthood. The IV estimate of the IGE is 0.346, of a similar magnitude to the simple OLS estimate.
In the end, we get similar results to our main estimate both by including the wealth of the grandfather in the OLS estimates and by using the IV estimate as an instrument for the wealth of the father.
<Table 6>
5. Characterizing mobility 5.1. Demographic heterogeneity
We now turn to a characterization of the people behind this mobility, without pretending to detect any causality. Wealth mobility is influenced by family environment. Some children may not have actually inherited anything from their father because they died before him, or they may have had to share their inheritance with their siblings.
Demographic context does not alter the mechanisms underlying intergenerational mobility, as the coefficients of the IGE and associated dummies for the father's group remain stable (Table 7). However, demographic variables change the level of wealth. First, child wealth is higher for sons than for daughters (column 1). It also changes depending on whether or not they have actually inherited from their father (column 2), and even more so if the death occurred recently compared to more than five years before (column 3) and if the father did not die too young (column 5). Child wealth is also higher if the father was a widower (column 4), if the child was older than 40 years (column 6), if they had no siblings (column 7) and if they were married.
Location also matters: having a father in a rural area is correlated with lower child wealth. However, the wealth of the child will be higher if they live in a rural area, because they are likely to own a plot or a farm.
<Table 7 >
Table 8 shows the interaction of the characteristics of fathers and children with father's wealth. Some features have a significant effect on the degree of mobility. If the father was a widower or lived in the countryside, mobility is higher (the coefficient of the interaction is negative). In contrast, if the child is single or both the father and child died less than 5 years apart, the similarity between the child’s and father's wealth is enhanced.
To conclude, demographic parameters influence the specific situation of each father-child pair. In families where the father died after his wife, mobility is higher. Within a given family, those who died too soon after their father experienced less mobility. At the aggregate level, the demographics change over time, but slowly. This might have some impact on wealth mobility, but we cannot test this right now due to sample limitations and therefore leave it for further research.
<Table 8>
5.2. In and out of the middle group
The IGE does not give clues on the direction of mobility. A complementary view is provided by the transition matrix. Once taken into account the structural changes in the distribution, we have seen that the story of mobility in the nineteenth century until 1913 is mostly downward, from the middle class to the bottom. On the other hand, mobility after 1914 goes upward from the bottom to the middle class and, for a smaller part, downward from the top to the middle class.
Table 9 gives the odds ratios (estimated with a logit function) of father-child pairs going down from middle class father to bottom class child (column 1) and of entering the middle class
from below (column 2) or from above (column 3). An odds ratio that is higher (resp. lower) than 1 means that the variable has a positive (resp. negative) impact on the outcome. For instance, being young (less than 40) when the father dies is correlated with a higher probability of sliding down from the middle group to the bottom and from the top group to the middle group. Having inherited from the father (which is the case if the father has died before the child) or from the mother (proxied by the fact that the father was a widower) alleviates these risks of downfall and increases the probability of an upward move (here, from the bottom to the middle group).
Interestingly, some characteristics affect mobility in a more subtle way. If the child is single, it increases his or her probability of a downward move from the top group to the middle group, but it prevents him or her from moving between the bottom and the middle group in either direction. If a rural father was in the top group and living in the countryside, this would have prevented the fall of his child from the top to the middle group. This is understandable, as rural fathers are likely to own a farm and pass it on to their offspring. However, if the father was rural and in the middle group, that would have increased the probability of the child ending up in the bottom group. Hence, in that case, if the father had a farm, it seems that the child would have not inherited it. Is this because of rural-urban migration? To explore this question, we add in column (2) a dummy that takes the value of 1 if there is any sign of such migration, namely, if the father was rural and the child urban. In that case, the probability of downward mobility from the middle to the bottom is indeed higher, while the probability of a downward move from the top group to the middle class is reduced. Rural-urban migration would "create" wealthless people, increasing the share of the bottom group, but it would also protect the very rich from declining socially.
The rising share of the bottom group is made up of children with fathers in the middle group, and it seems to correspond partly to rural-urban migration. This could be explained by the impoverishment of rural migrants working in city factories. But it could also be related to a new use of capital: in the rural areas, wealth was needed as a professional asset for earning a living and it was common to own one's house. In the cities, professional assets were no longer owned by employees working in industry or services, and the housing market provided more opportunities to rent.
<Table 9>
6. Conclusion
This paper examines the intergenerational wealth mobility between fathers and children in France between 1848 and 1960. Mobility is not constant, neither over time nor across the wealth distribution. It is not correlated to growth; on the contrary, mobility in the nineteenth century is higher during recessions and lower during periods of growth. It evolves at different speeds and trends at the bottom of the distribution (the bottom group), in the middle and at the top (those living off their capital).
Mobility is driven by sizable movements in the bottom and the middle groups, while inequality is determined by the two extremes of the bottom and the very top. During the
nineteenth century, intergenerational mobility was stable and oriented mostly downward, as the size of the bottom group continued to increase. Mobility increased after WWI, driven by the upward mobility from the bottom to the middle group. Meanwhile, the structure of society changed: the top group declined and the bottom group gained importance. However, in the process, the very meaning of "owning no asset" also changed: being without land in an agricultural society cannot be compared to being a wage earner and renting a flat in the city. Changes in the types of jobs as well as in the composition of wealth and its shift from professional to financial assets should run parallel to the evolution of wealth mobility.
References
Aaronson, Daniel, and Bhashkar Mazumder. 2008. “Intergenerational Economic Mobility in the US: 1940 to 2000.” Journal of Human Resources 43 (1):139–72.
Adermon, Adrian, Lindahl, Mikael, Waldenström, Daniel. 2015. Intergenerational wealth mobility and the role of inheritance: Evidence from multiple generations. mimeo
Altham, Patricia M. E., and Joseph P. Ferrie. 2007. “Comparing Contingency Tables: Tools for Analyzing Data from Two Groups Cross-Classified by Two Characteristics.” Historical Methods 40 (1): 3–16.
Atkinson, Anthony B. 2006. “Concentration among the Rich.” UNU-Wider.
Black, Sandra and Paul Devereux. 2011. Recent Developments in Intergenerational Mobility. Handbook of Labor Economics, vol 4b, chap. 16,1487-1541. Elsevier.
Bourdieu, Jérôme, Lionel Kesztenbaum, and Gilles Postel-Vinay. 2011. “Thrifty Pensioners: Pensions and Savings in France at the Turn of the Twentieth Century.” Journal of Economic History 71 (2): 386–415.
———. 2013. L’enquête TRA, Histoire D’un Outil, Outil Pour L’histoire. Tome I, 1793-1902. Paris: éditions de l’Ined.
Bourdieu, Jérôme, Gilles Postel-Vinay, and Akiko Suwa-Eisenmann. 2003. “Pourquoi La Richesse Ne S’est-Elle Pas Diffusée Avec La Croissance ? Le Degré Zéro de L’inégalité Son Évolution En France, 1800-1940.” Histoire Mesure XVIII (1-2): 147–98.
———. 2004. “Défense et Illustration de l’enquête 3 000 Familles.” Annales de Démographie Historique, 19–52.
———. 2008. “Mobilité Intergénérationnelle du Patrimoine en France aux XIXe et XXe siècles.” Economie et Statistique 417-418: 173–89.
Chetty, Raj, Hendren, Nathaniel, Kline, Patrick, Saez, Emmanuel and Nicholas Turner. 2014. "Is the United States Still a Land of Opportunity ? Recent Trends in Intergenerational Mobility", American Economic Review: Papers and Proceedings, 104(5):141-147.
Corak, Miles. 2004. “Generational Income Mobility in North America and Europe: An Introduction.” In Generational Income Mobility in North America and Europe, edited by Miles Corak, 1–37. Cambridge: Cambridge University Press.
———. 2013. Income Inequality, Equality of Opportunity and Intergenerational Mobility, Journal of Economic Perspectives, 27(3):79-102, Summer.
Corak, Miles, and Heisz, Andrew. 1999. “The Intergenerational Earnings and Income Mobility of Canadian Men: Evidence from Longitudinal Income Tax Data.” The Journal of Human Resources 34 (3): 504–33.
Daumard, Adeline. 1973. Les Fortunes Françaises au XIXe Siècle. Enquête sur la Répartition et la Composition des Capitaux Privés à Paris, Lille, Lyon, Bordeaux et Toulouse d’après l’Enregistrement des Déclarations de Succession. Paris: Mouton.
Dupâquier, Jacques, and Denis Kessler. 1992. La Société Française au XIXe Siècle. Tradition, Transition, Transformations. Paris: Fayard.
INSEE. 1966. Annuaire Statistique de La France. Résumé Rétrospectif. Paris: INSEE.
Long, Jason, and Ferrie, Joseph P. 2013. “Intergenerational Occupational Mobility in Great Britain and the United States since 1850.” American Economic Review 103 (4): 1109–37. Marchand, Olivier, and Claude Thélot. 1997. Le Travail en France : 1800-2000. Edited by Bayet, Alain, and collab. Essais & Recherches. Paris: Nathan.
Mayer, Susan E., and Leonard M. Lopoo. 2005. “Has the Intergenerational Transmission of Economic Status Changed?” Journal of Human Resources 40 (1): 169–85.
Mosteller, Frederick. 1968. “Association and Estimation in Contingency Tables.” Journal of the American Statistical Association 63 (321): 1–28.
Piketty, Thomas. 2001. Les hauts revenus en France au XXe siècle : inégalités et redistributions, 1901-1998. Paris, Grasset.
Piketty, Thomas. 2010. “On the Long Run Evolution of Inheritance – France 1820-2050.” Piketty, Thomas, Gilles Postel-Vinay, and Jean-Laurent Rosenthal. 2006. “Wealth Concentration in a Developing Economy: Paris and France, 1807-1994.” American Economic Review 96 (1): 236–56.
Solon, Gary. 1992. “Intergenerational Income Mobility in the United States.” The American Economic Review 82 (3): 393–408.
Solon Gary. 2002, “Cross-Country Differences in Intergenerational Earnings Mobility”, Journal of Economic Perspectives, vol. 16(3): 59-66.
Solon, Gary. 2014. "Theoretical Models of Inequality Transmission across Multiple Generations" Research in Social Stratification and Mobility 35 (March), 13-18.
Table 1 Wealth at different parts of the distribution
Source: TRA-database, father-child pairs, deceased over 20 years old, all (including 0 wealth) Note: wealth in 1912 francs (see text)
Table 2. The three worlds
Table 3. Intergenerational mobility matrices
1848-1869 1870-1894
1895-1913 1914-1939
1940-1960
Note: Periods are defined by the child’s year of death. In 1848-1869, 20.7% of children were from fathers with 0 wealth. 9.1% had no assets themselves, and 0.9% reached the top group. Conversely, 1.4% children with fathers in the top group had no assets at the end of their life.
P50 P75 P90 P95 mean std-error threshold to top
1848-1869 997 3 766 11 038 21 231 9 183 58 828 12 639
1870-1894 980 4 113 12 742 27 275 8 705 67 971 15 194
1895-1913 1 234 5 125 15 976 36 550 10 534 64 655 21 053
1914-1939 931 4 007 10 618 22 018 5 475 24 524 28 382
1940-1958 958 4 312 13 118 27 152 5 274 13 243 34 891
bottom middle top
age 61.2 61.4 61.2
single 0.09 0.09 0.06
child is a boy 0.55 0.54 0.60
rural 0.41 0.70 0.45
with real estate 0.59 0.70
with financial assets 0.19 0.55
\child father bottom 9.1 10.7 0.9 20.7 middle 14.8 49.4 3.4 67.7 top 1.4 6.2 4.0 11.7 total child 25.3 66.3 8.3 100
0 middle top total
father \child father bottom 11.6 9.8 1.2 22.6 middle 13.9 49.2 5.0 68.1 top 1.3 5.5 2.5 9.3 total child 26.8 64.5 8.7 100 top total father middle 0 \child father bottom 15.3 13.0 0.8 29.0 middle 13.0 44.2 3.6 60.9 top 1.5 5.0 3.5 10.1 total child 29.8 62.2 7.9 100
0 middle top total
father \child father bottom 17.3 17.0 0.7 35.0 middle 13.8 43.0 1.8 58.6 top 1.0 4.4 1.0 6.4 total child 32.1 64.4 3.5 100
0 middle top total
father \child father bottom 15.6 20.1 1.4 37.1 middle 11.9 41.1 1.9 54.8 top 1.5 5.0 1.6 8.1 total child 29.0 66.2 4.9 100
0 middle top total
Table 4. Intergenerational elasticity, 1848-1960
Dependent variable: child’s wealth
Note: Robust standard errors are in brackets. * p<0.1; ** p<0.05; *** p<0.01. The regression on all periods includes (child's) period fixed effects.
Table 5. Intergenerational mobility by father's wealth group
Note : robust standard errors in brackets.. * p<0.1; ** p<0.05; *** p<0.01. The regression on all periods includes (child's) and period fixed effects.
all periods 1848-1869 1870-1894 1895-1913 1914-1939 1940-1960 (a) father and child both with positive wealth
father's wealth 0.324*** 0.365*** 0.316*** 0.369*** 0.311*** 0.183** [0.020] [0.045] [0.036] [0.039] [0.035] [0.072] constant 5.792*** 5.509*** 5.870*** 5.631*** 5.876*** 6.734*** [0.186] [0.381] [0.313] [0.361] [0.328] [0.721] R2 0.16 0.21 0.13 0.18 0.18 0.09 N obs 3,016 568 971 589 714 174
(b) all fathers and children (including 0 values)
father's wealth 0.350*** 0.365*** 0.370*** 0.405*** 0.323*** 0.229*** [0.012] [0.034] [0.024] [0.026] [0.021] [0.040] constant 4.016*** 4.684*** 3.893*** 3.560*** 3.956*** 5.134*** [0.178] [0.367] [0.248] [0.268] [0.216] [0.453] R2 0.14 0.18 0.15 0.17 0.14 0.09 N obs 6,777 900 1,875 1,498 1,997 507
std-error father's wealth 4.05 3.68 3.73 4.09 4.21 4.42 std-error child's wealth 4.10 3.88 4.00 4.22 4.14 4.06
IGC 0.35 0.35 0.34 0.39 0.33 0.25 all periods 1848-1869 1870-1894 1895-1913 1914-1939 1940-1960 father's wealth 0.415*** 0.616*** 0.406*** 0.491*** 0.360*** 0.163 [0.041] [0.094] [0.070] [0.083] [0.070] [0.145] 0.402** 0.363 0.13 0.371 0.48 1.393** [0.168] [0.343] [0.390] [0.326] [0.300] [0.545]
father in top group -3.949** -3.72 -1.138 -3.715 -4.5 -15.519**
[1.866] [3.684] [4.232] [3.637] [3.396] [6.799] 0.812** 2.723*** 0.467 1.033 0.54 -0.353 [0.356] [0.823] [0.593] [0.713] [0.609] [1.239] constant 3.413*** 2.562*** 3.546*** 2.736*** 3.489*** 5.502*** [0.368] [0.794] [0.576] [0.708] [0.628] [1.268] R2 0.14 0.2 0.15 0.17 0.14 0.10 N obs 6,777 900 1,875 1,498 1,997 507 father's wealth *father in top group
father in bottom group
Table 6. Three generations
Note: Subset of grandfather/father/child triplets. All controls of table 3 are included. Simple OLS. IV: Father's wealth is instrumented by all controls plus grandfather's wealth, and grandfather's age difference to 60 (level and squared).
Table 7. Demographic heterogeneity
OLS IV first step father's wealth 0.329*** 0.346*** [0.026] [0.079] grand-father's wealth 0.019 0.537*** [0.047] [0.046] constant 4.093*** 3.903*** 3.806*** [0.632] [0.780] [0.620] R2 0.14 0.13 0.108 N obs 1,731 1,731 1,731 F-test 14.23 (1) (2) (3) (4) (5) (6) (7) (8) (9) (10) father's wealth 0.415*** 0.414*** 0.414*** 0.424*** 0.412*** 0.422*** 0.413*** 0.416*** 0.389*** 0.397*** [0.041] [0.041] [0.041] [0.041] [0.041] [0.043] [0.041] [0.042] [0.041] [0.043] 0.402** 0.404** 0.407** 0.358** 0.394** 0.409** 0.392** 0.401** 0.590*** 0.546*** [0.168] [0.168] [0.167] [0.167] [0.168] [0.173] [0.169] [0.168] [0.173] [0.181] -3.949** -3.984** -4.010** -3.444* -3.858** -3.990** -3.831** -3.930** -5.849*** -5.305*** [1.866] [1.871] [1.855] [1.861] [1.874] [1.927] [1.878] [1.866] [1.915] [2.000] 0.812** 0.827** 0.810** 0.851** 0.786** 0.851** 0.794** 0.825** 0.864** 0.868** [0.356] [0.355] [0.356] [0.355] [0.355] [0.375] [0.356] [0.357] [0.348] [0.368] child is a boy 0.191** 0.184** 0.191** 0.186** 0.192** 0.271*** 0.183** 0.220** 0.189** 0.267*** [0.092] [0.092] [0.091] [0.092] [0.091] [0.096] [0.092] [0.092] [0.091] [0.096] 0.872*** 0.949** [0.194] [0.412] 0.616*** 0.262 [0.181] [0.206] 0.471*** 0.345*** [0.123] [0.127] father was >40 0.864* 0.723 [0.454] [0.443] -0.448*** -0.403*** [0.139] [0.141] only child 0.315** 0.303** [0.136] [0.144] child is single -0.414** -0.05 [0.164] [0.179] -0.499*** -0.578*** [0.150] [0.155] 1.491*** 1.540*** [0.130] [0.137] constant 3.413*** 2.557*** 3.420*** 3.252*** 2.571*** 3.795*** 3.387*** 3.410*** 2.890*** 1.501** [0.368] [0.411] [0.368] [0.371] [0.572] [0.405] [0.368] [0.369] [0.377] [0.717] R2 0.14 0.15 0.15 0.15 0.14 0.14 0.15 0.14 0.17 0.17 N obs 6,777 6,777 6,777 6,710 6,777 6,098 6,777 6,740 6,777 6,011 father in rural area child in rural area father wealth*father in top group
father died less than 5 yrs before child child was <40 when father died father in top group father in bottom group father died before child father was widower
Table 8. Interacting mobility with demographic characteristics (1) (2) (4) (5) (6) (7) (8) father's wealth 0.341*** 0.379*** 0.334*** 0.340*** 0.387*** 0.370*** 0.352*** [0.014] [0.018] [0.026] [0.014] [0.023] [0.021] [0.015] 0.124** -0.067** 0.027 0.112** -0.071** -0.093*** -0.06 [0.049] [0.029] [0.030] [0.046] [0.029] [0.027] [0.039] z is :
father died before
-0.095
[0.403]
father was widower 0.842***
[0.226]
-0.593**
[0.248]
child is single -1.139***
[0.375]
father was rural 0.608***
[0.215]
child is rural 1.624***
[0.195]
rural father and urban child -1.246***
[0.267]
R2 0.14 0.14 0.14 0.14 0.14 0.16 0.16
N obs 6,777 6,710 6,098 6,740 6,777 6,777 6,777 child was <40 yrs
old when father died father died less than 5 years before child father's wealth * z
Table 9 Logit estimation: in and out the middle group
Note: With period fixed effects
(1) (2) (3) (4) (5) (6) child is a boy 0.919 0.916* 1.434*** 1.437*** 0.908*** 0.902*** [0.051] [0.048] [0.081] [0.084] [0.020] [0.018] 1.286*** 1.280*** 0.960*** 0.966*** 1.327*** 1.333*** [0.006] [0.008] [0.002] [0.003] [0.006] [0.004] 0.548*** 0.553*** 0.913*** 0.911*** 1.313*** 1.312*** [0.005] [0.006] [0.009] [0.009] [0.026] [0.025] child is single 0.704*** 0.701*** 0.525*** 0.531*** 1.711*** 1.701*** [0.010] [0.007] [0.028] [0.030] [0.048] [0.051] 0.426*** 0.428*** 1.269*** 1.313*** 1.164*** 1.137*** [0.007] [0.007] [0.012] [0.008] [0.011] [0.011] 0.512*** 0.515*** 2.362*** 2.393*** 0.827*** 0.826*** [0.000] [0.000] [0.011] [0.018] [0.009] [0.010] only child 0.902 0.897 1.051 1.099** 0.627*** 0.617*** [0.068] [0.065] [0.042] [0.048] [0.089] [0.085]
father was widower 0.710*** 0.713*** 1.967*** 1.930*** 0.487*** 0.489***
[0.010] [0.011] [0.032] [0.035] [0.011] [0.011]
father in the south 1.033 1.025 0.945 0.944 1.268** 1.269**
[0.028] [0.030] [0.048] [0.039] [0.133] [0.132]
father was rural 2.858*** 0.451*** 0.845***
[0.048] [0.053] [0.013] child is rural 0.399*** 1.360** 1.414*** [0.008] [0.186] [0.006] 3.005*** 0.739*** 0.609*** [0.011] [0.076] [0.024] constant 0.440*** 0.457*** 0.047*** 0.033*** 0.057*** 0.068*** [0.004] [0.003] [0.002] [0.002] [0.002] [0.002] N obs 5,978 5,978 5,978 5,978 5,978 5,978 rural father-urban child
from middle to bottom from bottom to middle from top to middle
father died before child
father died less than 5 years before child child was <40 yrs old when father died father was >40 yrs
Figure 1. Wealth inequality and growth
(a) Gini index of wealth inequality
(b) real GDP per capita
Source: TRA-database, deceased over 20 years old. GDP: Bourguignon and Lévy-Leboyer (1985), Toutain, Piketty (1996), annexe G. Population: Vallin. Real GDP per capita in 1914 francs, averaged over 5 years.
Note: Gini index on all individuals including those without wealth.
Figure 2. Wealth ratios to median wealth
Note: Wealth at a given percentile, as a ratio to median wealth (P50), amounts in 1912 francs. Source: Father-adult child pairs from the TRA database.
0.5 0.55 0.6 0.65 0.7 0.75 0.8 0.85 0.9 0.95 1848-1869 1870-1894 1895-1913 1914-1939 1940-1960 0 500 1000 1500 2000 2500 3000 3500 4000 1840 1850 1860 1870 1880 1890 1900 1910 1920 1930 1940 1950 ‐ 5.0 10.0 15.0 20.0 25.0 30.0 35.0 1848‐1869 1870‐1894 1895‐1913 1914‐1939 1940‐1958 P75 P90 P95 mean
Figure 3. The three groups
Note : Share of the three groups (bottom, middle, top) on the total number of adult children per period in the father-child samples from the TRA database.
Figure 4.Upward and downward intergenerational mobility
Note: Upward and downward mobility computed on initial matrices and matrices with fixed marginal
frequencies. Upward (resp. downward) mobility is the share of children that are in a strictly higher (resp. lower) group than their father.
0% 10% 20% 30% 40% 50% 60% 70% 80% 90% 100% 1848‐1869 1870‐1894 1895‐1913 1914‐1939 1940‐1960
bottom middle top
14.0 19.0 24.0 29.0 34.0 39.0 44.0 49.0 1848‐1869 1870‐1894 1895‐1913 1914‐1939 1940‐1960 upward (init) upward (fix margin) downward (init) downward (fix margin) total mob (init) total mob (fix)
Figure 5. Father and child wealth
Source : TRA dataset.
Note: Father and child wealth (inverse hyperbolic sine function). The blue line is the fit between father and child wealth, zero wealth included; the red line is the fit between father and child having both positive values of wealth. The values on the axes are in 1912 francs.
Appendix
Appendix A. Sample definition
The TRA database relies on two main sources. The first source (Table de Successions et d’Absences) indicates if the deceased has left an estate. It also reports the amount and broad composition of wealth until 1870. Thereafter, a second source (Registres de Mutations par Décès) lists the details of the estate. The first source was collected in an exhaustive way for the TRA database for the entire period; but not the second source. Hence, after 1870, some individuals are known to have a positive estate, based on the Table de Successions et d’Absences, while the corresponding entry in the Registres de Mutations par Décès, which report the details of the estate, was not collected. In that case, individuals whose wealth is both positive and known after 1870 are given a weight in order to represent similar individuals (same period, same area type, i.e., rural or urban) with wealth that is positive but unknown.
The wealth data are based on estate tax returns, which did not always report all liabilities. While liabilities internal to the couple are deducted during the whole period, other liabilities are reported only after 1901. We choose to have a constant definition of wealth over the whole period. Wealth is gross assets at death, meaning that only liabilities left by the deceased to the spouse are taken out.
This is an individual definition; hence, only half of married couples’ commonly owned assets are included. 14 8 22 00 0 32 70 00 Ch ild we al th 148 22000 327000 Father wealth
The asset values reported in tax registers are estimated at the asset market prices that were prevailing on the day of death. In the paper, they are deflated by a cost of living index and defined in constant1912 Francs.
Regarding tax rates, the first of two reforms was adopted in 1901, which introduced progressive taxation and deductions for liabilities. However, the tax rates of direct transmission from father to children were still low, and the practice of levying taxes from the first franc remained. Hence, the 1901 reform did not affect the quality of the variables used in this paper. A second reform in 1956 raised the threshold, below which the declaration of wealth to tax authorities was not mandatory for up to 1 million current francs. For a short period after the reform until 1960, wealth was still mostly declared. Indeed, in the data, we do not see a rise in individuals without wealth; on the contrary, their share gets smaller after 1940 than during the interwar period.
Table A 1. Father and child wealth: descriptive statistics
Note: a: inverse hyperbolic sine transformation. log(y+(y^2 + 1 )^(1/2)) log(0)=0
mean std-error mean std-error
1848-1869 6.18 3.88 6.37 3.68
1870-1894 6.10 4.00 6.20 3.73
1895-1913 6.06 4.22 5.84 4.09
1914-1939 5.71 4.14 5.39 4.21
1940-1958 5.91 4.06 5.38 4.42
child's wealth a father's wealth a
Variable Obs Mean Std-dev Min Max
child's wealth a 6,777 4.72 4.41 0 15.35
father's wealth a 6,777 5.45 4.14 0 15.12
father has no wealth 6,777 0.33 0.47 0 1
father in top wealth group 6,777 0.08 0.28 0 1
age 6,777 60.2 17.8 20.0 99.0
child's age - 60 6,777 0.2 17.8 -40.0 39.0
child's gender (male=1) 6,777 0.6 0.5 0 1
child is single 6,740 0.09 0.29 0 1
father's age - 60 6,777 6.66 13.15 -37 40
father was a widower 6,710 0.33 0.47 0 1
father died before child 6,777 0.89 0.31 0 1
child died less than 5 years after father 6,777 0.60 0.24 0 1
Table A 2. Intergenerational mobility matrices: adjusted marginal frequencies
1848-1869 1870-1894
1895-1913 1914-1939
1940-1960
Note: Mobility matrices with fixed marginal frequencies (all groups have a constant share of 33%).
\child father
0 18.9 10.0 4.4
middle 10.9 16.4 6.0
top 3.5 6.9 23.0
0 middle top \child
father 0 19.9 8.3 5.2 middle 9.1 16.1 8.1 top 4.3 9.0 20.1 0 middle top \child father 0 20.6 9.7 3.0 middle 9.1 17.1 7.1 top 3.6 6.5 23.3
0 middle top \child
father 0 19.4 9.5 4.4 middle 10.0 15.7 7.6 top 3.8 8.1 21.4 top 0 middle \child father 0 17.5 9.8 6.1 middle 10.7 16.1 6.6 top 5.2 7.5 20.7 0 middle top
Table A 3. Robustness
Note: (1) Level of P90 defined over 1848-1960 and not per period. (2) Excluding top percentiles of father and child wealth. (2) Fathers and children with 0 wealth are given a positive amount of wealth, randomly drawn in a uniform distribution within the bottom decile in the wealth distribution (between 1 and 281 1912 francs). (3) Tobit estimation. All regressions include gender of the child, age difference to 60 (and squared) for both child and father. Regression on "all periods" includes a period fixed effect. The period is defined by the child's year of death.
R2 N obs (1) top as top decile
all periods 0.426*** [0.038] 0.389** [0.167] -3.793** [1.865] 0.886*** [0.298] 0.14 6,777 1848-1869 0.295*** [0.098] 0.690** [0.344] -6.319* [3.695] -0.139 [0.755] 0.19 900 1870-1894 0.379*** [0.065] 0.156 [0.389] -1.329 [4.236] 0.214 [0.485] 0.15 1,875 1895-1913 0.521*** [0.073] 0.348 [0.321] -3.486 [3.597] 1.261** [0.576] 0.17 1,498 1914-1939 0.486*** [0.061] 0.353 [0.299] -3.369 [3.394] 1.628*** [0.502] 0.15 1,997 1940-1960 0.429*** [0.137] 1.143** [0.540] -13.405** [6.766] 1.977* [1.141] 0.1 507 (2) without top1% all periods 0.411*** [0.042] -0.173 [0.313] 2.127 [3.379] 0.763** [0.356] 0.13 6,609 1848-1869 0.599*** [0.094] -1.746** [0.801] 18.373** [8.374] 2.554*** [0.821] 0.17 875 1870-1894 0.402*** [0.070] 0.227 [0.559] -2.268 [6.011] 0.444 [0.594] 0.14 1,830 1895-1913 0.493*** [0.083] 0.128 [0.689] -1.242 [7.482] 1.043 [0.715] 0.15 1,460 1914-1939 0.358*** [0.070] -0.194 [0.604] 2.675 [6.581] 0.491 [0.613] 0.14 1,956 1940-1960 0.151 [0.145] 0.709 [1.374] -7.964 [15.676] -0.45 [1.236] 0.08 488
(3) father in bottom group up to 100F
all periods 0.426*** [0.038] 0.389** [0.167] -3.793** [1.865] 0.886*** [0.298] 0.14 6,777 1848-1869 0.295*** [0.098] 0.690** [0.344] -6.319* [3.695] -0.139 [0.755] 0.19 900 1870-1894 0.379*** [0.065] 0.156 [0.389] -1.329 [4.236] 0.214 [0.485] 0.15 1,875 1895-1913 0.521*** [0.073] 0.348 [0.321] -3.486 [3.597] 1.261** [0.576] 0.17 1,498 1914-1939 0.486*** [0.061] 0.353 [0.299] -3.369 [3.394] 1.628*** [0.502] 0.15 1,997 1940-1960 0.429*** [0.137] 1.143** [0.540] -13.405** [6.766] 1.977* [1.141] 0.1 507 (4) Tobit all periods 0.463*** [0.023] 0.395** [0.195] -3.789* [2.202] 6,777 1848-1869 0.420*** [0.060] 0.618* [0.362] -5.673 [3.965] 900 1870-1894 0.496*** [0.042] 0.037 [0.450] -0.231 [4.927] 1,875 1895-1913 0.541*** [0.048] 0.349 [0.375] -3.452 [4.256] 1,498 1914-1939 0.444*** [0.036] 0.383 [0.369] -3.266 [4.247] 1,997 1940-1960 0.290*** [0.063] 1.601** [0.680] -18.250** [8.671] 507
(5a) 0 wealth set to positive values drawn in bottom 10%
all periods 0.338*** [0.015] 0.14 6,777 1848-1869 0.402*** [0.035] 0.23 900 1870-1894 0.340*** [0.027] 0.14 1,875 1895-1913 0.401*** [0.029] 0.18 1,498 1914-1939 0.303*** [0.023] 0.14 1,997 1940-1960 0.207*** [0.047] 0.07 507
(5b) 0 wealth set to positive values drawn in bottom 10%
all periods 0.220*** [0.021] 0.475*** [0.115] -4.497*** [1.266] -0.367*** [0.080] 0.16 6,777 1848-1869 0.302*** [0.043] 0.537* [0.277] -5.100* [2.941] -0.142 [0.196] 0.24 900 1870-1894 0.239*** [0.039] 0.323 [0.274] -3.026 [2.968] -0.435*** [0.152] 0.15 1,875 1895-1913 0.256*** [0.043] 0.486** [0.226] -4.489* [2.498] -0.436*** [0.163] 0.19 1,498 1914-1939 0.198*** [0.034] 0.570*** [0.176] -5.529*** [1.966] -0.327** [0.134] 0.15 1,997 1940-1960 0.038 [0.079] 0.912*** [0.333] -9.694** [4.053] -0.564** [0.280] 0.09 507
father's wealth father's wealth* father at father at top father at bottom top
Figure A 1. Robustness: mobility with extended bottom group
Note: Bottom group includes positive wealth up to 100F.
14.0 19.0 24.0 29.0 34.0 39.0 44.0 49.0 1848‐1869 1870‐1894 1895‐1913 1914‐1939 1940‐1960 upward (init) upward (fix margin) downward (init) downward (fix margin) total mob (init) total mob (fix)


![Table 8. Interacting mobility with demographic characteristics (1)(2)(4)(5)(6)(7)(8)father's wealth0.341***0.379***0.334*** 0.340***0.387***0.370***0.352***[0.014][0.018][0.026][0.014][0.023][0.021][0.015]0.124**-0.067**0.0270.112**-0.071**-0.093*** -0.0](https://thumb-eu.123doks.com/thumbv2/123doknet/13401987.406368/23.892.109.783.138.652/table-interacting-mobility-demographic-characteristics-father-s-wealth.webp)