Publisher’s version / Version de l'éditeur:
Vous avez des questions? Nous pouvons vous aider. Pour communiquer directement avec un auteur, consultez la première page de la revue dans laquelle son article a été publié afin de trouver ses coordonnées. Si vous n’arrivez pas à les repérer, communiquez avec nous à PublicationsArchive-ArchivesPublications@nrc-cnrc.gc.ca.
Questions? Contact the NRC Publications Archive team at
PublicationsArchive-ArchivesPublications@nrc-cnrc.gc.ca. If you wish to email the authors directly, please see the first page of the publication for their contact information.
https://publications-cnrc.canada.ca/fra/droits
L’accès à ce site Web et l’utilisation de son contenu sont assujettis aux conditions présentées dans le site LISEZ CES CONDITIONS ATTENTIVEMENT AVANT D’UTILISER CE SITE WEB.
Proceedings of the Buildings Simulation 2005, pp. 1-8, 2005-08-01
READ THESE TERMS AND CONDITIONS CAREFULLY BEFORE USING THIS WEBSITE. https://nrc-publications.canada.ca/eng/copyright
NRC Publications Archive Record / Notice des Archives des publications du CNRC :
https://nrc-publications.canada.ca/eng/view/object/?id=74619d9f-68e7-464b-8788-55e1c9e46700
https://publications-cnrc.canada.ca/fra/voir/objet/?id=74619d9f-68e7-464b-8788-55e1c9e46700
NRC Publications Archive
Archives des publications du CNRC
This publication could be one of several versions: author’s original, accepted manuscript or the publisher’s version. / La version de cette publication peut être l’une des suivantes : la version prépublication de l’auteur, la version acceptée du manuscrit ou la version de l’éditeur.
Access and use of this website and the material on it are subject to the Terms and Conditions set forth at
Assessing the total energy impact occupant behavioural response to
manual and automated lighting systems
http://irc.nrc-cnrc.gc.ca
Asse ssing t he t ot a l e ne rgy im pa c t of
oc c upa nt be havioura l re sponse t o
m a nua l a nd a ut om at e d light ing syst e m s
N R C C - 4 8 6 5 8
B o u r g e o i s , D . ; R e i n h a r t , C . ;
M a c d o n a l d , I . A .
A version of this document is published in / Une version de ce document se trouve dans:
1
ASSESSING THE TOTAL ENERGY IMPACT OF OCCUPANT BEHAVIOURAL
RESPONSE TO MANUAL AND AUTOMATED LIGHTING SYSTEMS
Denis Bourgeois
1, Christoph Reinhart
2, Iain A. Macdonald
31
École d'architecture, Université Laval, Québec, Canada
2Institute for Research in Construction, NRC, Ottawa, Canada
3
ESRU, University of Strathclyde, Glasgow, Scotland
ABSTRACT
Behavioural models derived from on-going field studies can provide the basis for predicting personal action taken to adjust lighting levels or remedy direct glare in response to physical conditions. SHOCC, a sub-hourly occupancy-based control model, provides building energy simulation programs, such as ESP-r, access to advanced behavioural models, such as the Lightswitch2002 algorithms intended manual and automated lighting systems. The effectiveness of the approach is demonstrated through annual energy simulations aiming at quantifying the total energy impact of manual control over lights and window blinds. Results show that by enabling manual control, as opposed to using predefined lighting profiles for core zones, total primary energy expenditure is reduced by as much as 62%. This underlines the importance of defining suitable reference cases for benchmarking the performance of automated lighting controls. Results also show that reduced lighting use through automated control may not always produce anticipated savings in primary energy for indoor climate control; in some cases, reduced lighting use is shown to even increase primary energy expenditure for indoor climate control, trimming down initial primary energy savings in lighting alone. This supports the use of integrated approaches rather than simple guidelines in designing lighting solutions.
INTRODUCTION
Recent advances in daylighting and lighting control modelling include the development of advanced behavioural models in response to short term changes in luminous conditions in buildings. The integration of the Lightswitch2002 behavioural algorithms (Reinhart 2004) in the online design support tool Lightswitch Wizard1 and the expert daylighting analysis software DAYSIM2, allows for a more realistic estimate of lighting use under dynamic conditions. The current downside of these approaches is that the whole building energy impact of manual changes in blind settings and lighting use is not considered. Enabling advanced behavioural
1 www.buildwiz.com 2 www.daysim.com
models in whole-building energy programs would provide greater simulation accuracy in estimating heating and cooling requirements and coincident peak electricity demands, key variables in assessing the cost-effectiveness and sustainability of related strategies and technologies. The first part of this paper provides an overview of the Lightswitch2002 user behaviour model, as well as current approaches to modelling building occupants and personal control in energy simulation. In the second part, a sub-hourly occupancy-based control (SHOCC) model is presented, which allows advanced behavioural models to be integrated in whole building energy simulation programs, e.g. ESP-r. The enhanced functionality is demonstrated through annual energy simulations in a private office. LIGHTSWITCH2002
Existing methods of modelling personal blind and light control are reviewed in Reinhart (2004). The findings point out that blind control models are often based on invariable thresholds, such as static glare or overheating criteria, while lighting systems in reference cases are commonly assumed to be operating on a continuous basis during occupied hours. Based strictly on field evidence, Reinhart derived the Lightswitch2002 algorithms to predict personal control of lights and blinds. Key concepts include population clustering into active versus
passive users (Love 1998), stochastic functionality,
and dynamic responses to short term changes in luminous conditions and occupancy patterns, i.e. at 5 minute intervals. Occupant responses are adapted to various lighting control options, from manual ON/OFF switching to various combinations of dimming and occupancy-sensing technology. The model’s name underlines that it has been developed in the same spirit as Newsham et al.’s original model (Newsham et al. 1995) and that the algorithms are expected to evolve over time along with future advances in the field.
By enabling the Lightswitch2002 algorithms within DAYSIM, a Radiance-based (Ward 1994) daylighting simulation method, Reinhart (2004) demonstrates the impact of manual control on predicted electric lighting energy demand. The current shortcoming of this integration is that the whole building energy impact of manual lighting
control, e.g. on heating and cooling demand, is not considered. While it is obvious that reduced lighting use through personal control will lower cooling loads in office environments, just how much remains difficult to estimate without proper assessment methods. Enabling advanced behavioural models in energy simulation is the desired next step.
CURRENT APPROACHES
Diversity profiles
A widely-used technique in energy simulation is to model the influence of occupants through diversity factors, a solution passed down from the previous generation of hourly simulation programs. Diversity factors are numbers between zero and one, and are used as multipliers of some user-defined maximum load, e.g. occupants, lighting, equipment, etc. Load variability, due to absenteeism or power management features of IT equipment, is defined by associating different sets of 24-hour diversity factors, or diversity profiles, for weekdays, weekends, holidays, etc. Abushakra et al. (2004) provide an overview of existing methods for deriving diversity profiles.
Recent developments in this area include findings from the ASHRAE Research Project 1093 (Abushakra et al. 2001). The goal of this project was to compile a library of schedules and diversity factors based on measured electricity use data for energy simulations and peak cooling load calculations in office buildings. This research project derived sets of diversity factors from measured lighting and receptacle loads in 32 office buildings (Claridge et al. 2004). Occupancy was not monitored under RP-1093, yet another study from Claridge et al. (2001) established a strong correlation between observed occupancy levels and lighting loads, suggesting that valid occupancy diversity profiles may be derived from lighting use using linear regression.
Diversity profiles are often adequate as average input data models for large, core zones containing multiple spaces. If lighting and office equipment use in a given building is considered predictable for a given set of day-types, e.g. if their use is independent of weather patterns, then the technique is often quite valid. One significant shortcoming of the RP-1093 diversity profiles is that they are derived independently of meteorological data. This may be a valid assumption when considering core zones, but hardly so for perimeter spaces. Correlating occupancy from these lighting profiles would lead to obvious errors. Yet as many North American buildings have very low envelope-to-floor area ratios, these errors are considered by some to be minor. In cases where greater envelope-to-floor area ratios are found, or even in some cases where there are no core zones at all, the use of generic diversity profiles becomes difficult to justify. This would
certainly be the case for building designs aiming at high daylight autonomy levels and/or offering outside views to most occupants, such as prescribed by certain daylighting design guides (DGCCB 2002), required by related standards such as Germany’s DIN 5034 (1999), or recommended by green building rating systems like LEED (2002). Other studies have shown that using hourly diversity profiles can lead to considerable errors when applying control strategies that are sensible to short-term variations in occupancy. This consideration fuelled the original Lightswitch model, whose outputs are adapted diversity profiles for DOE-2.1E (Winkelmann et al. 1993). Similar work has been done by Degelman (1999) and Keith (1997).
The aforementioned studies focus on improving occupancy prediction to better assess the energy savings from occupancy sensors, but fail to address the lingering misconception in energy simulation that occupants are, in Newsham’s words, fixed
metabolic heat generators passively experiencing
the indoor environment (Newsham 1994).
Occupants instead respond to various, often sudden environmental stimuli, triggering abrupt manual changes in window blind settings and artificial light use, in turn affecting electrical energy use and demand. This restates the necessity of introducing valid behavioural models to predict occupant perception and response to environmental stimuli.
Behavioural modelling in ESP-r
Within ESP-r (ESRU 2002), a building comprises a collection of interacting technical domains, each solved by exploiting the specific nature of the underlying physical and mathematical theories. A few notable, typically coupled, domains include natural illuminance prediction, building thermal processes, intra-room airflow, and electrical demand and embedded power systems. Clarke (2001) describes the approaches taken to solve the governing equations while preserving domain interaction.
Occupant effects in ESP-r are often simply modelled as casual gains, defined as 24-hour load profiles expressed in W or W/m²; a variant of the diversity profile approach presented earlier. Within each technical domain, a number of controls can be enabled to dynamically adjust certain component definitions during simulation. These controls are often used to emulate personal control. Examples include mimicking blind/shutter control by dynamically substituting transparent surface optical properties, or reproducing operable window closure by adjusting the area of a crack component within an airflow network. Certain component changes will affect the system more globally than others. For example, blind/shutter control enabled during the solar calculations will influence the sensed illuminance in the daylighting calculations, which can in turn affect the lighting load on the electrical
3 network and how power is used from embedded renewable components, if such systems are defined. Almost all control laws in ESP-r use static thresholds as triggering mechanisms, a significant limitation in behavioural modelling as suggested by Reinhart (2004). As an exception to this rule, ESP-r includes the original Hunt (1979) stochastic algorithm for manually switching on lights. However, unlike the Lightswitch2002 algorithms, ESP-r’s Hunt algorithm may not be combined with other control functions, such as dimming or occupancy-sensing control. Bookkeeping arises as a major challenge in regards to occupancy-related input and control in ESP-r, or in any other advanced simulation package for that matter. In ESP-r, each control law provides its own definitions for describing occupancy, whether by specifying arrival and departure times in Hunt’s algorithm or by setting a temporal window when control is enabled, e.g. 08:00 to 17:00. Considerable effort can be required to harmonize casual gain definitions and control law definitions to ensure, for instance, that metabolic heat from occupants is indeed injected simultaneously when personal computers are operated, and when lights are turned on, and when windows are opened, etc. The potential for incorrect data specification increases with the number of zones, occupants, nested domains and control laws. Clearly, a more robust solution is desired.
SHOCC
SHOCC has been developed to integrate advanced occupancy-based control within whole building energy simulation programs. Its design rejects the traditional concept of merely modelling the state of clustered objects rather than the individual objects themselves. For instance, rather than tracking lumped heat injections from a group of occupants or a set of PCs, SHOCC instead tracks individual instances of occupants and occupant-controlled objects, the state of which depends on personal mobility and control. Rather than burdening current whole building energy simulation programs with the additional required functionality, which can spread over many technical domains, SHOCC is instead designed as a self-contained simulation module that is concerned with all building occupant related events in a building. As such, SHOCC can be integrated within different whole building energy simulation programs with few very changes in either application.
For every instance of encapsulation, a routine library is provided to probe and update specific bits of information within the self-contained data structures through a high-level interface. This constitutes the basic building blocks of advanced controls in SHOCC, such as occupancy-sensing controls, advanced power management (APM) profiles (Roberson et al. 2002), and even advanced behavioural models. The Lightswitch2002
algorithms, for instance, are enabled in SHOCC as one out of many self-contained control libraries. ENABLING SHOCC WITHIN ESP-R
At the early stages of a design, it is typical to rely on basic definitions, such as lighting diversity profiles, when running ESP-r. As the design evolves, and more information becomes available, it then becomes possible to override these definitions by enabling more complex calculation methods. For instance, ESP-r’s advanced daylighting methods are designed to override lighting diversity profiles. SHOCC works much in the same way within ESP-r, yet it does this by operating in parallel to ESP-r rather than being constrained to a specific domain.
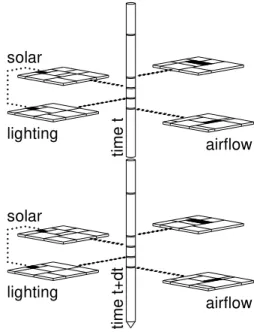
lighting lighting solar solar time t airflow airflow time t+d t
Figure 1 ESP-r simulator’s sequential run-time access to technical domains.
To better illustrate this process, the basic operation of ESP-r is described in Figure 1. At every time step (time t, time t+dt, etc.), the ESP-r simulator sequentially updates boundary conditions for each technical domain, computes new domain solutions, and moves on to solve the next domain equations, often sending the preceding solutions as boundary conditions for the next set of domain equations to solve. This process is repeated until the end of the simulation. In the figure, only a few domains of note are illustrated, with the dark areas in each domain symbolizing the parts of the code which can be considered as behaviour-related. Pertaining to lighting control, the status of each transparent surface (i.e. blinds open/drawn) is determined during the solar calculations; which becomes input for natural illuminance calculations, required to set lighting output during casual gain computations. Data is passed from one domain to another by directly accessing global data structures, as illustrated by the connection between solar and lighting domains.
airflow ti me t lighting solar airflow ti me t + d t lighting solar
Figure 2 ESP-r simulator’s sequential run-time access with SHOCC enabled.
Once enabled, SHOCC operates in parallel alongside the ESP-r simulator, updating targeted technical domain boundary conditions as illustrated in Figure 2. First, the ESP-r simulator calls SHOCC directly to update the status of its own internal representations of occupants, e.g. daily arrivals and departures, short-term mobility at every time step, etc. Then SHOCC is called to update and retrieve only specific bits of information useful to a given technical domain. For instance, SHOCC is called during the casual gain calculations a first time to update the status of its own internal representations of IT equipment and lighting systems, and then called a second time to send back the summed heat injections and/or electrical loads of these systems for ESP-r’s own computations. Data exchange between technical domains, at least data associated to occupants, is no longer done directly as in Figure 1, but rather via SHOCC. The advantage of the latter approach is that data pertaining to occupants, e.g. mobility, behavioural control, etc., are no longer spread throughout ESP-r’s technical domains, minimizing the aforementioned risk of incorrect data specification. As SHOCC is fully expandable, this approach offers a high degree of resolution for populating a building model without this being cumbersome for energy simulation programs. More on SHOCC is provided in the principal author’s thesis (Bourgeois 2005).
EXAMPLE APPLICATION
Scope of the investigation
The impact of introducing manual light switching, dimming and occupancy-sensing control in whole building energy simulation is demonstrated through a series of ESP-r/SHOCC/Lightswitch2002 simulations. The chosen test case is a single
occupancy perimeter office. Three control options are investigated: constant, i.e. continual overhead lighting use during occupied hours with no blind control (i.e. blinds retracted); manual, i.e. manual ON/OFF light switching with manual blind control; and automated, i.e. manual ON/OFF light switching with ideal dimming and occupancy OFF switching and manual blind control.
The first option represents an approach commonly found in building simulation practice. The underlying assumptions, that lighting is always activated during occupied hours and that shading devices aren’t used, stems from and is adequate for core zones. Its use for perimeter zones, however, tends to yield unrealistic results. The second option relies on the Lightswitch2002 behavioural models for manual light switching and blind control. As discussed in Reinhart (2004), manual control is considered by the Illuminating Engineering Society of North America as the most common practice and should function as a reference system, relative to which energy savings of automated lighting controls should be expressed (IESNA 2000). Depending on which reference system is chosen, constant or
manual, estimated energy savings from automated
control may differ.
All simulations are carried out using a 5-minute time-step; a suitable frequency to capture short-term occupancy patterns and dynamic responses to luminous conditions. All three control options are investigated for two locations: Québec City, Canada (heating dominant) and Rome, Italy (cooling dominant). Model description 1280 5000 1687 300 0 950 368 2440 1280
Figure 3 Cross section of modelled test office
The office's south facing wall is in contact with the outdoor environment, while interior partitions, ceiling and floor are considered to be in an adiabatic state with similar indoor conditions. A cross-section of the office is provided in Figure 3. Although access to outside views in office environments is rarely regulated, and specifically not in Canada, the south facing wall integrates a wood-framed, insulated double glazing unit (DGU), with size and placement (e.g. height from floor, width, etc.) matching the prescriptive requirements of the
5 German standard DIN 5035 (1990). This is an attempt to fix the window’s geometry within the scope of this study, regardless of office lighting/climate-control energy use. The DGU is provided with a spectrally-selective low-e coating on the interior face of the outer pane. Variations in blind position, i.e. drawn or retracted, are simulated in ESP-r by alternately choosing paired optical data sets, illustrated in Figure 4a and Figure 4b. The DGU’s direct normal visible transmittance (VT) is 69% when blinds are retracted, and drops to 15% when blinds are drawn. Preliminary simulations show that by lowering blinds, absorbed solar heat gain in the office only drops slightly given the initial solar performance of the glazing assembly and the limited secondary heat rejection capabilities of interior blinds. The increase in artificial lighting use, due to the drop in the DGU’s VT when blinds are drawn, is found to be a much more significant factor in total energy expenditure than solar absorption patterns in the office. For this reason, manual light control and blind control are considered to go hand in hand within the scope of this demonstration. All multilayered constructions conform to prescriptive requirements of the Model National Energy Code of Canada for Buildings (1997) and the Regulation Respecting Energy Conservation in New Buildings in Québec (1992). More details can be found in the main author's thesis (Bourgeois 2005).
Figure 4a Direct solar transmittances and pane absorptances for the double glazing unit, when blinds are retracted; and 4b - when blinds are
drawn
In all simulated cases, a SHOCC individual occupies the space on weekdays, typically arriving at 08:30 and then leaving at 17:00, with lunch and morning/afternoon breaks splitting the time spent in the office cell into four equal shifts, based on the Lightswitch2002 occupancy predictor. In cases where manual control is enabled using the Lightswitch2002 algorithms, it is assumed that the individual indeed considers daylight and adjusts blind and lighting settings accordingly (active lighting and blind control). As scheduling is the same in all simulated cases, annual heat injections from the individual and the laptop would remain equally constant. This produces an average annual metabolic heat injection of 128.4 kWh in the sensible range, and an average annual injection of
72.0 kWh for the laptop.
The study specifically targets loads directly influencing the luminous and thermal conditions within the office. This includes energy required for operational tasks, e.g. overhead lighting and the laptop, as well as heating and cooling requirements. Space heating is provided locally through a hot-water system, while cooling is provided through a local AC unit. Primary air is nonetheless delivered at a constant 21°C at a rate of 10 L/s (weekdays, from 7h00 to 20h00), which is indicative of a dedicated outdoor air delivery approach. Background infiltration is set at a constant 0.25 L/s per m² of building envelope area. Overhead lighting is provided through fluorescent fixtures, with a nominal lighting power density of 15 W/m2. Desk-level natural illuminance is computed using ESP-r's Radiance-based daylight coefficient method (Janak & Macdonald 1999, Janak 1997).
RESULTS
Annual electrical energy use for lighting, as well as cooling and heating requirements, are estimated for Rome (Figure 5) and Quebec (Figure 6).
8.1 0.8 38.1 30.6 34.4 59.6 11.5 9.4 6.2 0.0 20.0 40.0 60.0 80.0 100.0 120.0
constant manual automated
[ k W h /m ².y ] heating cooling lighting
Figure 5 Simulated annual electrical energy for lighting, cooling requirements and heating
requirements (kWh/m².y) for Rome Lighting
As constant lighting output is predefined independently of any meteorological boundary conditions, e.g. natural illuminance available in the room, annual lighting use is set equal for both climates, representing 38.1 kWh/m² per year. Once SHOCC enables manual control over lights and blinds by accessing the Lightswitch2002 behavioural models, annual lighting use is reduced significantly, down to 8.1 kWh/m² per year in Rome and 8.6 kWh/m² per year in Québec. This represents less than 23% of the initial estimate in lighting use. If
automated lighting control is added to manual
control, then lighting energy use is further reduced
0.0 0.1 0.2 0.3 0.4 0 20 40 60 80 angle of incidence [°] out. abs. int. abs. dir. trans. 0.0 0.1 0.2 0.3 0.4 0 20 40 60 80 angle of incidence [°] out. abs. int. abs. dir. trans. (a) (b)
to 0.8 kWh/m² is Rome and 2.0 kWh/m² in Québec. In both manual and automated control options, lighting use is less in Rome given the greater daylight availability. If energy savings from automated lighting controls are to be expressed as relative to some previously-defined reference case, as suggested by IESNA guidelines, then results in both figures clearly underline just how significant the selection of the reference case may be in this instance, as both manual control and constant lighting use are often considered as valid choices in simulation practice. 38.1 8.6 2.0 12.1 10.6 28.1 64.9 60.5 48.8 0.0 20.0 40.0 60.0 80.0 100.0 120.0
constant manual automated
[ k W h /m ².y ] heating cooling lighting
Figure 6 Simulated annual electrical energy for lighting, cooling requirements and heating
requirements (kWh/m².y) for Quebec Cooling
Cooling requirements, i.e. energy extracted to maintain office indoor temperatures below defined setpoints, are strongly affected by constant lighting use in Rome and Québec. Once manual control is enabled, cooling requirements in both cases drop dramatically; down to 58% of initial estimates for Rome, and 43% for Québec. Likewise, once
automated controls are added, cooling requirements
are further reduced to 51% of initial estimates for Rome, and 38% for Québec. Results support general knowledge that any reduction in lighting use will in turn reduce cooling requirements; amplifying the initial savings in lighting energy use alone. This amplification is well supported, independently of meteorological boundary conditions. By comparing the savings in lighting energy use, i.e. automated versus manual control, to related reductions in cooling requirements, it can be established that the amplification isn't linear. In general, it appears likely that anticipated reductions in cooling requirements are likely to flatten out along with incremental improvements in lighting technology and control.
Heating
A portion of the estimated savings in annual lighting energy use effectively reduces cooling requirements,
as discussed in the preceding section. The remaining portion is either influencing the extent of the free-running period for the investigated office, i.e. when neither cooling nor heating are required to stabilize indoor temperatures, or otherwise producing an increase in annual heating requirements. The latter is observed for both locations. This reiterates general knowledge that internal loads are sometimes useful in compensating heat loss through the building envelope. Just as with cooling requirements, the influence of reduced lighting use on heating requirements isn't linear, and increases in heating requirements are likely to flatten out along with incremental improvements in lighting solutions.
Primary energy use
Although reduced lighting use systematically lowers cooling requirements, heating increases by the same token. As the relationship between lighting use and energy required for indoor climate control appears to be non-linear, a single standard of measurement would be useful to compare the performance of advanced lighting control. As energy costs differ greatly between various locations in the world and usually depend on peak electricity demands as well,
primary energy conversion is selected in the
following for demonstration purposes only.
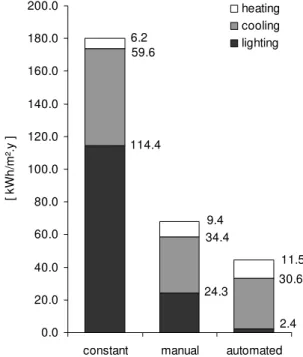
2.4 24.3 114.4 59.6 30.6 34.4 9.4 11.5 6.2 0.0 20.0 40.0 60.0 80.0 100.0 120.0 140.0 160.0 180.0 200.0
constant manual automated
[ k W h /m ².y ] heating cooling lighting
Figure 7 Annual primary energy requirements for lighting, cooling and heating (kwh/m².y), for various
lighting control options in Rome
We refer as primary, energy which is embodied in natural resources and has not yet undergone any anthropogenic conversion or transformation. Buildings generally rely on the thermal output of fossil fuels (e.g. coal, oil and natural gas) for space and hot water heating, with distribution and system losses averaged around 10%. Other building end uses, such as lighting, cooling, ventilation, etc.
7 operate on electricity, often generated by fossil fuel power plants. Mean conversion factors for fossil fuel power plants vary depending on a location’s energy mix, but an average 3:1 ratio is widely accepted. Primary energy conversion factors can be estimated using publicly available programs and databases such as the Global Emission Model for Integrated Systems (GEMIS)3. Figure 7 and Figure 8 provide the annual primary energy requirements for all three control options, when applied in Rome and Québec respectively, based on the aforementioned primary energy conversion factors for each end use and heating and cooling coefficients of performance (CoPs) of 1 and 3, respectively. The total primary energy requirements can be obtained by summing those for lighting, cooling and heating.
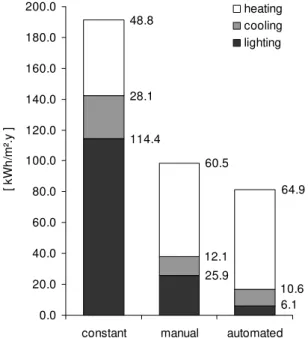
114.4 25.9 6.1 28.1 10.6 12.1 48.8 60.5 64.9 0.0 20.0 40.0 60.0 80.0 100.0 120.0 140.0 160.0 180.0 200.0
constant manual automated
[ k W h /m ².y ] heating cooling lighting
Figure 8 Annual primary energy requirements for lighting, cooling and heating (kWh/m².y), for various
lighting control options in Québec
Under constant use, lighting energy overwhelms total primary energy requirements, comprising more than 60% of total requirements for both locations. Once manual lighting and blind control is enabled, total annual primary energy requirements drop to 68.1 kWh/m² for Rome; merely 38% of initial estimates under constant lighting use. In Québec,
manual control reduces total primary energy
requirements to 51% of initial estimates. The differences in total primary energy expenditure between constant and manual control reiterate the significance of selecting suitable reference cases against which should be compared the relative performance of automated lighting control. When
automated control is applied in Rome, in addition to
manual control alone, total primary energy savings
in lighting are estimated at 21.9 kWh/m² per year.
3 http://www.oeko.de/service/gemis
This produces cooling primary energy savings of 3.8 kWh/m² per year, while primary energy for heating increases by 2.1 kWh/m²; a net reduction of 1.7 kWh/m² per year for indoor climate control. In other words, the initial estimated savings in annual primary energy requirements for lighting, resulting from the introduction of automated lighting control, is amplified by approximately 8%, due to overall savings in primary energy requirements for indoor climate control.
When the same strategy is applied in Québec, annual primary energy savings in lighting are estimated at 19.8 kWh/m². Similarly, primary energy for cooling drops by 1.5 kWh/m², while primary energy for heating increases by 4.4 kWh/m²; a net increase of 2.9 kWh/m² per year for indoor climate control. In this instance, initial estimated savings in annual primary energy requirements for lighting, resulting from the introduction of automated lighting control, are no longer amplified but trimmed down by approximately 15%, due to the overall increase in primary energy requirements for climate control. CONCLUSION
Results show that by enabling manual control in energy simulation, as opposed to using predefined core zone lighting diversity profiles, total primary energy expenditure is reduced by as much as 62%. This underlines the importance of defining suitable reference cases for comparing the performance of automated lighting controls. In addition, results show that reduced lighting use through automated control may not always produce anticipated additional savings in primary energy for indoor climate control. In some cases, reduced lighting use is shown to even increase primary energy expenditure for indoor climate control, trimming down initial primary energy savings in lighting use alone.
Of course, the preceding analysis would likely lead to different conclusions if, let's say, a location's primary energy mix were to be somewhat different. For instance in Québec, most of the electricity used in buildings is generated through hydroelectricity, with different conversion factors than with fossil fuel power generation (EQ 2001). In addition, electric-resistance heating is widely used in buildings in Québec for HVAC reheat applications (electrical heating coils) and zone requirements (baseboards heaters). Here, the lighting:cooling:heating ratio for primary energy conversion would be somewhere near 3:1:3, rather than the initial 3:1:1. These differences would likely affect total primary energy savings linked to lighting technology. If on the other hand, heating requirements were to be met by local, ground-coupled heat exchangers on a water loop, once again both the ratio for primary energy conversion and the total primary energy savings would be different. In the end, the argument to be made is that primary energy savings stemming from advanced lighting technology can hardly be estimated in isolation to
indoor climate control strategies and system efficiencies, as well as a location’s primary energy mix, supporting the need for integrated simulation. ACKNOWLEDGMENT
Denis Bourgeois holds a scholarship from the Fonds
de recherche sur la nature et les tecnhnologies, and
holds a research grant from the CANMET Energy Technology Centre (CETC) University Research Network (reference 409345)
REFERENCES
DGCCB 2002. Daylighting Guide for Canadian Commercial Buildings, Public Works and Government Services Canada (PWGSC). DIN 5034 1999. Tageslicht in Innenräumen,
Deutsches Institut für Normung.
DIN 5035 1990. Innenraumbeleuchtung mit
künstlichem Licht Richtwerte, Deutsches Institut für Normung.
EQ 2001. L'énergie au Québec, Les Publications du Québec: Sainte-Foy.
IESNA 2000. The Lighting Handbook 9th edition, Illuminating Engineering Society of North America, New York.
LEED v.2.1 2002. The Leadership in Energy and Environmental Design (LEED) Green Building Rating System for New Construction & Major Renovations (LEED-NC) Version 2.1, U.S. Green Building Council.
MNECB 1997. Model National Energy Code of Canada for Buildings, National Research Council of Canada, Institute of Research in Construction, Canadian Commission on Building and Fire Codes. RRECNB 1992. Regulation Respecting Energy
Conservation in New Buildings, QRR c.E-1.1, r.1, Gouvernement du Québec.
Abushakra, B., Haberl, J., Claridge, D.E. 2004. Overview of existing literature on diversity factors and schedules for energy and cooling load
calculations (1093-RP), ASHRAE Transactions, 110 (1).
Abushakra, B., Sreshthaputra, A., Haberl, J., Claridge, D.E. 2001. Compilation of diversity factors and schedules for energy and cooling load calculations, Report RP-1093, American Society of Heating, Refrigerating and Air-Conditioning Engineers.
Bourgeois, D. 2005. Integrating detailed occupancy prediction, occupancy-sensing control and advanced behavioural modelling in whole-building energy simulation, Faculté des études supérieures, Université Laval, PhD thesis.
Claridge, D.E., Abushakra, B., Haberl, J., Sreshthaputra, A. 2004. Electricity Diversity Profiles for Energy Simulation of Office Buildings, ASHRAE Transactions, 110 (1).
Claridge, D.E., Abushakra, B. 2001. Accounting for the occupancy variable in inverse building energy baselining models, in the Proceedings of the International Conference for Enhanced Building Operations (ICEBO), Austin.
Clarke, J.A. 2001. Energy Simulation in Building Design, Oxford, Butterworth-Heinemann. Degelman, L.O. 1999. A model for simulation of
daylighting and occupancy sensors as an energy control strategy for office buildings, in the
Proceedings of Building Simulation ’99, an IBPSA Conference, Kyoto, International Building
Performance Simulation Association, 571-578. ESRU 2002. The ESP-r system for building energy
simulation, user guide version 10 series. ESRU Manual U02/1, Glasgow, University of Strathclyde. Hunt, D.R.G. 1979. The use of artificial lighting in
relation to daylight levels and occupancy, Building and Environment, 14, 21-33.
Janak, M., Macdonald, I. 1999. Current state-of-the-art of integrated thermal and lighting simulation and future issues, in the Proceedings of Building Simulation '99, an IBPSA Conference, Kyoto, 1173-1180.
Janak, M. 1997. Coupling building energy and lighting simulation, in the Proceedings of the 5th International IBPSA Conference, Prague, 313-319. Keith, D.M. 1997. Use of peak occupancy data to
model the effects of occupancy-sensing lighting controls, Faculty of the Graduate School/Civil Engineering, University of Colorado, MSc thesis. Love, J.A. 1998. Manual switching patterns observed
in private offices, Lighting Research & Technology, 30 (1), 45-50.
Newsham, G.R., Mahdavi, A., Beausoleil-Morrison, I. 1995. Lightswitch: a stochastic model for predicting office lighting energy consumption, in the Proceedings of Right Light Three, the 3rd European Conference on Energy Efficient Lighting, Newcastle-upon-Tyne, 60-66.
Newsham, G.R. 1994. Manual control of window blinds and electric lighting: Implications for comfort and energy consumption, Indoor Environment, (3), 135-144.
Reinhart, C.F. 2004. Lightswitch 2002: a model for manual control of electric lighting and blinds, Solar Energy, 77 (1), 15-28.
Roberson, J.A., Homan, G.K., Mahajan, A., Nordman, B., Webber, C.A., Brown, R.E., McWhinney, M., Koomey, J.G. 2002. Energy use and power levels in new monitors and personal computers, LBNL-48581, Berkeley, Energy Analysis Department, Environmental Energy Technologies Division, Ernest Orlando Lawrence Berkeley National Laboratory, University of California.
Ward, G. 1994. The RADIANCE 2.4 Synthetic Imaging System, University of California.