Publisher’s version / Version de l'éditeur:
Vous avez des questions? Nous pouvons vous aider. Pour communiquer directement avec un auteur, consultez la première page de la revue dans laquelle son article a été publié afin de trouver ses coordonnées. Si vous n’arrivez pas à les repérer, communiquez avec nous à [email protected].
Questions? Contact the NRC Publications Archive team at
[email protected]. If you wish to email the authors directly, please see the first page of the publication for their contact information.
https://publications-cnrc.canada.ca/fra/droits
L’accès à ce site Web et l’utilisation de son contenu sont assujettis aux conditions présentées dans le site LISEZ CES CONDITIONS ATTENTIVEMENT AVANT D’UTILISER CE SITE WEB.
The 16th Annual Conference of the CFD Society of Canada [Proceedings], pp.
1-9, 2008-06-09
READ THESE TERMS AND CONDITIONS CAREFULLY BEFORE USING THIS WEBSITE. https://nrc-publications.canada.ca/eng/copyright
NRC Publications Archive Record / Notice des Archives des publications du CNRC : https://nrc-publications.canada.ca/eng/view/object/?id=fbb4c97d-082e-4f9b-9d19-de0a8a1d30e0 https://publications-cnrc.canada.ca/fra/voir/objet/?id=fbb4c97d-082e-4f9b-9d19-de0a8a1d30e0
NRC Publications Archive
Archives des publications du CNRC
This publication could be one of several versions: author’s original, accepted manuscript or the publisher’s version. / La version de cette publication peut être l’une des suivantes : la version prépublication de l’auteur, la version acceptée du manuscrit ou la version de l’éditeur.
Access and use of this website and the material on it are subject to the Terms and Conditions set forth at
CFD simulations for fully-developed fires in a room under different
ventilation conditions
http://irc.nrc-cnrc.gc.ca
C F D s i m u l a t i o n f o r f u l l y - d e v e l o p e d f i r e s i n a
r o o m u n d e r d i f f e r e n t v e n t i l a t i o n c o n d i t i o n s
N R C C - 5 0 5 7 0
S a b e r , H . H . ; K a s h e f , A .
A version of this document is published in / Une version de ce document se trouve dans:
16th Annual Conference of the CFD Society of Canada, Saskatoon, Sask., June 9-11,
2008, pp. 1-9
The material in this document is covered by the provisions of the Copyright Act, by Canadian laws, policies, regulations and international agreements. Such provisions serve to identify the information source and, in specific instances, to prohibit reproduction of materials without written permission. For more information visit http://laws.justice.gc.ca/en/showtdm/cs/C-42
Les renseignements dans ce document sont protégés par la Loi sur le droit d'auteur, par les lois, les politiques et les règlements du Canada et des accords internationaux. Ces dispositions permettent d'identifier la source de l'information et, dans certains cas, d'interdire la copie de documents sans permission écrite. Pour obtenir de plus amples renseignements : http://lois.justice.gc.ca/fr/showtdm/cs/C-42
CFD Simulations for Fully-Developed Fires in a Room
under Different Ventilation Conditions
Hamed H. Saber and Ahmed Kashef
National Research Council of Canada, Institute for Research in Construction 1200 Montreal Road, Bldg. M59, Ottawa, Ontario K1A 0R6 Canada
Email: [email protected], [email protected]
A
BSTRACTA number of ventilation scenarios were investigated in order to gain insight into the effect of ventilation scheme on fire development in a room of a size 4.2 m long, 3.8 m wide, and 2.4 m high. Parameters such as heat release rate, fuel total mass loss, temperature, airflow distribution, and fire duration were used to determine the effect of different ventilation schemes on fire dynamics. This work is part of the process for designing fire experiments in a project concerning the characteristics of fires in various rooms under different ventilation conditions. The fuel package consisted of a mock-up sofa made of polyurethane foam and two wood cribs underneath it. The two wood cribs provided additional fuel load to sustain a fully-developed fire. The selection of this fuel package is supported by fire statistics that many fatal residential fires begin with an item of upholstered furniture. The Fire Dynamics Simulator (FDS) Version 5 was used to conduct the numerical simulations. The CFD results showed that ventilation scenario SC8 had resulted in the highest maximum heat release rate while SC10 had the lowest one. The ventilation scenario SC11 resulted in the largest total mass loss of the fuel package while SC2 produced the lowest total mass loss.
1. I
NTRODUCTIONEstablishing proper design fire scenarios is a challenging task and an essential component for conducting a fire safety design of buildings. A design fire scenario is a qualitative description of a fire with time identifying key events that characterize the fire (ignition, growth, fully-developed, and decay stages of fire). In addition, it describes the ventilation conditions that will impact the course of a fire.
This paper presents a series of CFD numerical simulations that were conducted in order to investigate the effect of different ventilation settings
on fire dynamics in a room of a size of 4.2 m long, 3.8 m wide and 2.4 m high. The fire was initiated by igniting an item of upholstered furniture. A fuel package consisting of a mock-up sofa constructed with exposed polyurethane foam, the dominant combustible constituent of upholstered furniture, and two wood cribs was selected. The mock-up sofa was ignited first and the wood cribs provided the remaining fire load to sustain a fully-developed fire. The details of the fuel package and its characteristics are available in [1] and [2]. This mode of fire initiation is supported by fire statistics that indicate that many fatal residential fires begin with an item of upholstered furniture.
The ventilation schemes were based on using a window, door, or both (see Figure 1). Different sizes of windows and doors were investigated. In the next phase of this project, after identifying the proper ventilation scheme and conducting the tests, the numerical results will be compared with the experimental results. After verifying the CFD simulation, a parametric analysis will be performed to investigate the effect of different parameters of interest (e.g. fire size, fire location, geometry, etc) on the fire characteristics.
2. NUMERICAL ALGORITHM OF FDS
The Fire Dynamic Simulator (FDS) is a Large Eddy Simulation (LES) and Direct Numerical Simulation (DNS)-based fire simulation model developed to idealize fire-driven fluid flow. The model numerically solves a form of the Navier-Stokes equations appropriate for low-speed, thermally-driven flow, with an emphasis on smoke and heat transport from fires. The partial differential equations for conservation of mass, momentum, and energy are discretized in space using second order central differences and in time using explicit, second order, predictor-corrector scheme. Thermal radiation is computed using a finite volume technique on the same grid as the flow solver. Lagrangian particles
SC3:Window 2.0x1.5 m
SC6:Door 1.5x2.0 m
SC9:Window 2.0x1.5 m Fire Load at the corner
SC2:Window 1.5x1.5 m Door 0.9x2.0 m SC5:Door 0.9x2.0 m SC8:Window 1.0x1.0 m Door 0.9x2.0 m SC1:Window 1.5x1.5 m SC4:Window 1.0x1.0 m Door 0.9x2.0 m SC7:Window 1.0x1.5 m Door 0.9x2.0 m 4.2 m 3.8 m 2.4 m SC10:Window 1.0x1.0 m SC11:Window 1.4x1.2 m x y z SC3:Window 2.0x1.5 m SC3:Window 2.0x1.5 m SC6:Door 1.5x2.0 m SC6:Door 1.5x2.0 m SC9:Window 2.0x1.5 m Fire Load at the corner
SC9:Window 2.0x1.5 m Fire Load at the corner
SC2:Window 1.5x1.5 m Door 0.9x2.0 m SC2:Window 1.5x1.5 m Door 0.9x2.0 m SC5:Door 0.9x2.0 m SC5:Door 0.9x2.0 m SC8:Window 1.0x1.0 m Door 0.9x2.0 m SC8:Window 1.0x1.0 m Door 0.9x2.0 m SC1:Window 1.5x1.5 m SC1:Window 1.5x1.5 m SC4:Window 1.0x1.0 m Door 0.9x2.0 m SC4:Window 1.0x1.0 m Door 0.9x2.0 m SC7:Window 1.0x1.5 m Door 0.9x2.0 m SC7:Window 1.0x1.5 m Door 0.9x2.0 m 4.2 m 3.8 m 2.4 m SC10:Window 1.0x1.0 m SC10:Window 1.0x1.0 m SC11:Window 1.4x1.2 m SC11:Window 1.4x1.2 m x y z
Figure 1 Ventilation parameters for the different scenarios are used to simulate smoke movement. FDS
computes the temperature, density, pressure, velocity, and chemical composition within each numerical cell at each discrete time step. Additionally, FDS computes the temperature, heat flux, mass loss rate, and various other quantities at solid surfaces.
Only one mesh (stretched in x- and y-directions, and uniform in z-direction) was used for the simulations. Because the local heat release rate (HRR) is calculated from the local oxygen consumption rate at the flame surface, a fine mesh was necessary where the flame exists in order to capture the profile of the flame surface, and hence accurately predict the HRR. Also, the mesh was refined in the regions where large temporal and/or spatial gradients of key flow quantities are anticipated (e.g. in the vicinity of the door and window). Additionally, in order to capture the steep change of the key quantities with time, the time step (Δt) was selected as:
] / z) y, x, min[( t = Δ Δ Δ 2 α
Δ , where α is the thermal
diffusivity [α = k/ρ Cp)], and Δx, Δy, Δz are the cell size in x-, y- and z-directions, respectively.
A significant change has been made in the combustion model in FDS version 5 as compared with earlier versions. Figure 2 shows the process of burning the fire load (polyurethane sofa + wood
Fuel (solid)Æ Fuel (gas)
Fuel (gas)
Fuel (solid)
Pyrolysis Model
Fuel (solid)Æ Fuel (gas)
Reaction1: Fuel (gas) + O2Æ Fuel (gas) + O2
Reaction2: Fuel (gas) + O2Æ CO + Other Products
Reaction3: Fuel (gas) + O2Æ CO2+ Other Products
3 Parameters Combustion Mixture Fraction Model
cFÆ [0,1]
Extent to which Fuel
has reacted with O2
under reactions 2 & 3
c Æ [0,1] Extent to which gas mixture is composed of reactions 2 & 3
cCOÆ [0,1]
Extent to which CO has been converted
to CO2
Fuel (solid)Æ Fuel (gas)
Fuel (gas)
Fuel (solid)
Pyrolysis Model
Fuel (solid)Æ Fuel (gas)
Reaction1: Fuel (gas) + O2Æ Fuel (gas) + O2
Reaction2: Fuel (gas) + O2Æ CO + Other Products
Reaction3: Fuel (gas) + O2Æ CO2+ Other Products
3 Parameters Combustion Mixture Fraction Model
cFÆ [0,1]
Extent to which Fuel
has reacted with O2
under reactions 2 & 3
c Æ [0,1] Extent to which gas mixture is composed of reactions 2 & 3
cCOÆ [0,1]
Extent to which CO has been converted
to CO2
Figure 2 Procedure of burning polyurethane sofa and wood cribs in the FDS
cribs). The first step is basically the conversion of the solid fuel to gas fuel. For the polyurethane sofa, the conversion of the solid fuel to gas fuel consumes
energy (heat of vaporization, ΔHv = 1,500 kJ/kg). For the wood cribs, however, the modified pyrolysis model was used in the conversion of solid fuel to gas fuel. In this process the wood undergoes several reactions as described below.
Modified Pyrolysis Model
The pyrolysis model represents different reactive processes such as evaporation, charring and internal heating. This model considers that the solid fuels can undergo simultaneous reactions. Each material component may undergo several competing reactions, and each of these reactions may produce some other solid component (residue, char in this case), gaseous fuel, and/or water vapor. The wood cribs (70% cellulose, 20% lignin and 10% water by mass) undergoes the following reactions [5]:
Reaction 1:
Cellulose (solid) Æ Active Cellulose (solid), ΔHv = 0 Reaction 2:
Active Cellulose (solid) Æ Char (35% by mass) + Fuel (gas) (65% by mass), ΔHv = 418 kJ/kg
Reaction 3:
Active Cellulose (solid) Æ Fuel (gas), ΔHv = 418 kJ/kg
Reaction 4:
Water (liquid) Æ Water (vapor), ΔHv = 2260 kJ/kg The reaction rates of the above reactions are functions of local mass concentration and temperature, and are calculated using a combination of Arrhenius and power functions (see [4] and [5] fore more details).
There are two ways of defining a fire: the first is to specify a heat release rate per unit area (HRRPUA). The other is to specify the heat of reaction along with other thermal parameters. In this case, the burning rate of the fuel depends on the net heat feedback to the surface of the fuel. Once the solid fuels of both the polyurethane sofa and the wood cribs have been converted to gas fuels, the modified Mixture Fraction Combustion Model (MFCM) is used as explained below.
Modified Mixture Fraction Combustion Model In the previous versions of FDS, it was assumed that fuel and oxygen react instantaneously upon mixing (i.e. mixed is burned). However, for fire scenarios where it cannot be assumed that fuel and oxygen react completely upon mixing (e.g. under-ventilated fires), this assumption no longer holds. One of the new features in FDS version 5 is to account for mixing of fuel and oxygen without burning. Both the oxygen concentration and the temperature of gases in the vicinity of the flame sheet play an important role in whether burning can or cannot happen upon mixing of fuel and oxygen as shown in Figure 3.
0 5 10 15 20 0 200 400 600 800 1000 1200 1400 1600 No Burn Region Burn Region Gas Temperature (oC) Ox ygen Vol u m e F racti o n ( % )
Figure 3 Oxygen-temperature phase space showing where combustion is allowed to take place [4]. In the previous versions of FDS, it was assumed that combustion occurs with constant yield for CO (YCO),
and Soot (YSoot) that are based on post-flame
measurements. In other words, CO and Soot are created at the flame and transported with the combustion products with no further reaction. This is a reasonable assumption if the purpose of the simulation is to assess the impact of the fire in a large space. However, in under-ventilated fires, CO and Soot are produced at higher rates, and exist within the fuel-rich flame envelope at higher concentrations than would otherwise be predicted with a single set of fixed yields that are based on post-flame measurements. Another new feature in the FDS version 5 is the ability to account for the CO production and its eventual oxidation at the flame envelope or within a hot upper layer.
In order to account for both mixing of fuel and oxygen without burning and CO production, the modified mixture fraction combustion model in FDS version 5 considers the following three gas reactions (see Figure 2):
Reaction 1: (null reaction in the no burn region shown in Figure 3)
Fuel (gas) + O2 Æ Fuel (gas) + O2
Reaction 2: (incomplete reaction, burn region shown in Figure 3)
Fuel (gas) + O2 Æ CO + other Products
Reaction 3: (complete reaction, burn region shown in Figure 3)
Fuel (gas) + O2 Æ CO2 + other Products
This process is called the three parameters mixture fraction combustion model (see [4] and [5] for more details). In summary, using the modified combustion model in FDS version 5 allows for the investigation of different fire ventilation scenarios.
2.1 Boundary Conditions and
Assumptions
The walls, floor and ceiling of the room were assumed inert and insulated (adiabatic) for all scenarios (Figure 1). As such, the values of the heat release rates and the temperatures in the room would be the highest (the most severe case). In all scenarios, the windows and doors were lead to the exterior (i.e. open to the outside). The total local pressure (dynamic + static + gravitational) in the room with and without fire was equal to the atmospheric pressure. To satisfy this condition, the boundary conditions at the windows and doors were treated as open vents. Upon initiating the fire, the flow field inside the room was modified such that the total local pressure in the room is equal to the atmospheric pressure. Subsequently, the mass flow rates at the doors and windows were calculated and these values differed depending on the ventilation scenario.
3. M
ODELV
ERIFICATIONSFDS was developed and is maintained by the National Institute of Standards and Technology (NIST). NIST has conducted different verifications of FDS to ensure the accuracy of the numerical solution of the governing equations. This includes comparison of the FDS predictions with analytical solutions, code checking, and numerical tests (see [5] for more details).
Before conducting the CFD simulations for all scenarios, several numerical tests and debugging were carried out. One of these tests (Test Case I) was conducted to burn two wood cribs only, placed at the center of the room. Another numerical test (Test Case II) was conducted to burn the full fire load (polyurethane sofa and two wood cribs underneath it) in a fully-open room. In these tests, different mesh sizes were used in order to optimize mesh size. It was found that increasing the size of a stretched mesh (in x- and y- directions) beyond 720,000 in the room of size of 4.2 m long, 3.8 m wide, and 2.4 m high had no significant effect on the results. Moreover, the calculated effective heat of combustion of the wood was in good agreement (within ±13% and ±7.6% for Test Case I and II, respectively) with that calculated using Babrauskas’ correlation [7]. This good agreement confirmed the appropriateness of both the modified mixture friction combustion model and pyrolysis model in FDS version 5.0 (see [8] for more details). Based on the numerical results of Test Cases I and II, a stretched mesh in x- and y- directions of a size of 720,000 and burner of thermal
power of ~ 3 kW for a period of 30 s were used to conduct the CFD simulations for the ventilation scenarios shown in Figure 1.
4. R
ESULTS ANDD
ISCUSSIONSAn example for the calculation Heat Release Rate (HRR) is shown in
Figure 4 for scenario SC1. Snapshots for flame shapes at different time are shown in the inserts (a) through (f) of
Figure 4. As shown in this figure, the HRR increased rapidly with time and reached its maximum value (6,092 kW) at 24 s. At this time the size of the flame was large and filled a significant portion of the room (insert a). After 24 s, the HRR decreased rapidly with time until 37 s. In the period from 37 s to 269 s, the HRR was more or less constant and its mean value was 3,900 kW. In this period, the size of the flame was smaller (insert b, c) than that at 25 s (insert a), and the HRR was due to burning both the polyurethane sofa and wood cribs. After 269 s, the HRR decreased with time, reaching its minimum value (479 kW) at 325 s. At this time (325 s), the size of the flame reached its minimum size and the majority of the HRR was mainly due to burning the wood crib that was located further from the window (see insert d). After that the HRR and the flame size increased again with time, reaching a second peak (2,347 kW, insert e) at 400 s. After 400 s, the HRR decreased again with time. Eventually, the HRR decreased to ~1 kW at 600 s (see the amount of wood reaming in the insert (g) of
Figure 4).
Note that in the later stages of burning of the wood cribs, the predicted flame size above the wood crib located further from the window was larger than that above the wood crib located closer to the window (e.g. see the inserts d, e, f). As such, the amount of mass loss from the wood crib located further from the window was greater than that from the wood crib located closer to the window as shown in the insert (g). A similar trend for the HRR and predicted flame shapes were obtained for the other ventilation scenarios. More details about the fire characteristics (flow fields within the comportment, flow through the opening(s), location of the neutral plane(s) in the opening(s), fluctuations of the heat release rate with time in the period of burning both the sofa and the wood cribs and in the early stage of burning wood only, shapes and sizes of the flames, etc) are available in reference [8]. The effects of window and door sizes, and the fire load locations on the fire characteristics are investigated next.
0 1000 2000 3000 4000 5000 6000 7000 0 60 120 180 240 300 360 420 480 540 600 Wood ONLY Sofa + Wood Time (s) Heat Rele ase R a te (kW) at 600 s (en d o f b urnin g) (g) (a) at 25 s (b) at 120 s (c)
at 236s, sofa completely burned
(d) at 325 s (e ) at 400 s (f) at 445 s 0 1000 2000 3000 4000 5000 6000 7000 0 60 120 180 240 300 360 420 480 540 600 Wood ONLY Sofa + Wood Time (s) Heat Rele ase R a te (kW) at 600 s (en d o f b urnin g) (g) at 600 s (en d o f b urnin g) (g) (a) at 25 s (a) at 25 s (b) at 120 s (b) at 120 s (c)
at 236s, sofa completely burned
(c)
at 236s, sofa completely burned
(d) at 325 s (d) at 325 s (e ) at 400 s (e ) at 400 s (f) at 445 s (f) at 445 s Figure 4 Heat Release Rate of ventilation scenario SC1 (window 1.5x1.5 m
4.1 Investigate the Effect of Window
Size on the Fire Characteristics
In this subsection, the effect of different window sizes on the fire characteristics is investigated. This includes ventilation scenarios that: (1) use one window with different sizes, (2) use a window with different sizes and a door with the same size located in the opposite walls, and (3) use a window with different sizes and a door with the same size located in the same wall.
4.1.1 Ventilation scenarios using one window with different sizes
Figure 5 compares the HRRs for SC1, SC3, SC10 and SC11. Scenarios SC1 and SC10 had square windows of size of 1.5 m and 1.0 m, respectively. Scenario SC3 had a large rectangular window of a size of 2.0 m wide and 1.5 m high. Additionally, scenario SC11 was considered, which had a 1.4 m wide and 1.2 m high rectangular window, which is the average size of windows in multi-family dwellings based on a survey that has recently been conducted [3]. In these scenarios (Figure 1), the fire load was located at the center of the room, and the coordinates (in meters) of the center of the windows were located at (0.0,1.9,1.25), (0.0,1.9,1.25), (0.0,1.9,1.0) and (0.0,1.9,1.1) for SC1, SC3, SC10 and SC11, respectively.
As shown in Figure 5, the size of the window had a significant effect on the fire characteristics. A larger window size resulted in higher maximum
HRR and shorter period of burning. For example, the maximum HRR in SC3 with the largest window size was 6,940 kW compared to 4,400 kW for SC10 with the smallest window size. In all scenarios, ~60 s after ignition, and during the period of burning the polyurethane sofa and wood simultaneously, and the period of early stage of burning wood only, the HRR was more or less constant. There was, however, fluctuations in the HRR (see reference [8] for more details).
0 1000 2000 3000 4000 5000 6000 7000 0 60 120 180 240 300 360 420 480 540 600 660 720 780 840 900 SC10 SC10 SC11 SC11 Wood ONLY Sofa + Wood Wood ONLY Sofa + Wood SC1 SC3 Sofa + Wood WoodONLY
Wood ONLY Sofa + Wood SC3 SC1 Time (s) Heat Releas e Rate (k W)
Figure 5 Comparison of the HRRs for window with different sizes
It took a shorter time for the sofa to be completely burned in scenarios with a larger window size. For example, the sofa was completely burned at 192 s
in the scenario with the largest window size (SC3) compared to 779 s in the scenario with smallest window size (SC10). At the time the sofa was completely burned, the HRRs in SC1, SC3, SC10 and SC11 were ~4,120, 5,350, 1,390, and 2,930 kW, respectively.
As shown in Figure 5, the HRR dropped from the peak to its minimum value in the scenario with a larger window size earlier. For example, the minimum HRR in scenario SC3 (581 kW at 279 s) was reached 220 s earlier than in scenario SC11 (493 kW at 499 s). Similarly, the second peak of the HRR was reached earlier with a higher value in the scenario with a larger window size. For example, the value of the HRR at the second peak in scenario SC3 was 2,800 kW (at 358 s) compared to 2,350 kW (at 399 s) and 1,890 kW (at 583 s) in scenarios SC1 and SC11, respectively.
During the period from ~60 s – end of simulation (900 s) in the scenario with the smallest window size (SC10), the HRR was more or less constant. The duration of burning in this scenario was the longest (HRR ~1,500 kW at 900s). On the other hand, the fire was extinguished earlier in the scenario with a larger window size. The fire was extinguished after 545, 600, and 823 s in SC3 (2.0x1.5 m window), SC1 (1.5x1.5 m window), and SC11 (1.4x1.2 m window), respectively. 4.1.2 Ventilation scenarios using a window and door in the opposite walls
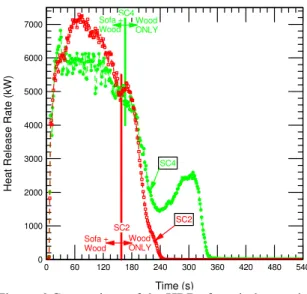
Figure 6 compares the HRR for SC2 and SC4. Scenarios SC2 and SC4 had a square window of a size of 1.5 m and 1.0 m, respectively. The coordinates (in meters) of the center of the windows were located at (0.0,1.9,1.25) and (0.0, 1.9, 1.5) for SC2 and SC4, respectively. Both scenarios had a 0.9 m wide and 2.0 m high door located in the wall opposite the window with its center located at (4.2, 1.9, 1.0) (Figure 1). The fire load was located at the center of the room in both scenarios.
Figure 6 shows that the HRRs in these scenarios were different. The scenario with a larger window size (SC2) resulted in a higher maximum HRR (7,292 kW in SC2 compared to 6,816 kW in SC4). The HRR at its second peak in the scenario with a larger window size (SC2) was much higher (5,258 kW) and achieved 141 s earlier (at 168 s) than that in the scenario with a smaller window size (SC4) (2,591 kW at 309 s). The minimum HRR before reaching its second peak in SC2 (4,744 kW at 156
s) was also much higher than that in SC4 (1,442 kW, at 238 s).
In these two scenarios, the sofa took about the same time to be completely burned (158 s and 166 s in SC2 and SC4, respectively). Also, at this time, the amount of mass loss from the wood was slightly larger in the scenario with a larger window size (49.0 kg in SC2 compared to 48.3 kg in SC4). 0 1000 2000 3000 4000 5000 6000 7000 0 60 120 180 240 300 360 420 480 540 SC2 SC4 Wood ONLY Sofa + Wood Sofa + Wood Wood ONLY SC4 SC2 Time (s) Heat R e lea s e Ra te (kW )
Figure 6 Comparison of the HRRs for window and door facing each other
The size of the openings and their locations plays an important role in the thermal feedback to the bulk fuel and its surface temperature, and hence on the fire development. Because of the larger amount of heat losses by convection and radiation through the openings in the scenario with a larger window size (SC2), the amount of net heat feedback to the wood surface was smaller. Moreover, a larger window size permits a larger amount of exterior fresh air into the compartment allowing for faster and more efficient fuel burning. As a result, the fire lasted for a shorter period in the scenario with a larger window size (300 s in SC2 compared to 435 s in SC4). At the end of burning duration, the remaining mass of wood cribs in scenario SC2 was 31% compared to 21% (by mass) in scenario SC4.
4.1.3 Ventilation scenarios using a window and door in the same wall
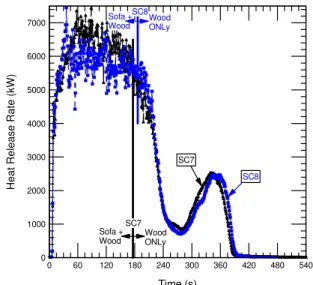
Figure 7 compares the HRR when both the window and the door were located in the same wall in scenarios SC7 and SC8. Scenario SC7 had a 1.0 m wide and 1.5 m high window, while SC8 had a square window of a size of 1.0 m x 1.0 m (Figure 1). The coordinates (in meters) of window centers were located at (4.2,2.85,1.25) and (4.2,2.85,1.5) in
SC7 and SC8, respectively. A 0.9 m wide and 2.0 m high door was used in both scenarios. As shown in Figure 7, there was insignificant difference in the fire characteristics during the whole period of burning in these scenarios. For example, the maximum HRRs were about the same in both scenarios (7,431 kW and 7,450 kW in SC7 and SC8, respectively). The sofa was completely burned at 176 s and 186 s in SC7 and SC8, respectively. Additionally, the remaining mass of the wood cribs was the same in both scenarios (20% by mass). More details about the flow field within the room, locations of the neutral planes in the window and door, etc are available in [8].
0 1000 2000 3000 4000 5000 6000 7000 0 60 120 180 240 300 360 420 480 540 SC7 Sofa + Wood WoodONLy
Sofa + Wood WoodONLy
SC8 SC8 SC7 Time (s) Hea t Rel ease Rate (kW)
Figure 7 Comparison of the HRRs for window and door located in the same wall
4.2 Investigate the Effect of Door Size
on the Fire Characteristics
The ventilation scenario SC6 was similar to scenario SC5 except for having a wider door in SC6 (1.5 m wide and 2.0 m high) compared to 0.9 m wide and 2.0 m high in the latter. The coordinate (in meters) of the center of the door in both scenarios was located at (4.2, 1.9, 1.0) (Figure 1). The fire load was located at the center of the room in both scenarios.
Figure 8 compares the HRR for scenarios SC5 and SC6. As shown in this figure, the door size had a significant effect on the HRR. In the first 15 s, the HRR increased rapidly in these scenarios. After that, the HRR increased further but with a lower rate and reached its first peak (7,069 kW) at 85 s in the scenario with a larger door size (SC6). In scenario SC5, however, the first peak of the HRR (4,983 kW) was achieved ~15 s after initiating the
fire, and then the HRR decreased rapidly with time from 4,983 kW to 3,460 kW.
As shown in Figure 8, The minimum HRR before reaching its second peak in the scenario with a larger door size (SC6) was much higher (4,156 kW) and reached 152 s earlier (at 167 s) than for scenario SC5 with a smaller door size (1,521 kW at 319 s). Furthermore, the HRR at the second peak in SC6 was much higher (4,513 kW) and reached 171 s earlier (at 180 s) than for scenario SC5 (1,961 kW at 351 s). The sofa was completely burned in SC6 at 167 s, compared to 249 s in scenario SC5. At this time, the amount of mass loss from the wood in the scenario with a smaller door size (SC5) was 52.4 kg (60% by mass) compared to 47.1 kg (54% by mass) in SC6. 0 1000 2000 3000 4000 5000 6000 7000 0 60 120 180 240 300 360 420 480 SC5 SC6 SC5 SC6 Wood ONLY Wood ONLY Sofa + Wood Sofa + Wood Time (s) Hea t Rel ease Rate (kW)
Figure 8 Comparison of the HRRs for door with different sizes
The larger exterior opening in SC6 resulted in more heat losses (by convection and radiation) than in SC5 and larger influx of fresh air into the room. As such, the net thermal feedback to the fuel in SC6 was lower than that in SC5. For this reason, it took a shorter time to completely extinguish the fire in SC6 (346 s) than in SC5 (536 s). At these times, the unburned mass of the wood was 25.6 kg (29% by mass) in SC6 compared to 18.3 kg (21% by mass) in SC5. Additionally, having a larger door size in SC6 resulted in a higher oxygen concentration inside the compartment. Accordingly, the amount of CO production in SC6 was smaller (due to converting most of the CO to CO2) than in SC5. As a result, the effective heat of combustion in scenario SC6 (17.2 MJ/kg) was greater than in scenario SC5 (15.9 MJ/kg) [8].
4.3 Investigate the Effect of Fire Load
Location on the Fire Characteristics
The ventilation scenario SC9 was similar to scenario SC3 except for placing the fire load in the northeast corner of the room in the former (located 100 mm from both the east and north walls) and at the center of the room in the latter (Figure 1). A 2.0 m wide and 1.5 m high window was used in these two scenarios. The coordinate (in meters) of the center of the window was located at (0.0,1.9,1.25). 0 1000 2000 3000 4000 5000 6000 7000 0 60 120 180 240 300 360 420 480 540 600 SC3 SC9 SC9 Wood ONLY Wood ONLY Sofa + Wood Sofa + Wood SC3 Time (s) Hea t Rel ease Rate (kW)
Figure 9 Comparison of the HRRs for different fire load locations
Figure 9 shows the HRR for scenarios SC3 and SC9. As shown in this figure, the maximum HRR in scenario SC3 was much higher (6,940 kW) and reached much earlier (at 39 s) than in scenario SC9 (4,760 kW at 282 s). The sofa took a longer period of time to be completely burned in SC9 (283 s) than in scenario SC3 (192 s). At this time, the mass loss from the wood cribs in scenario SC9 (53.4 kg, 62% by mass) was higher than in scenario SC3 (49.0 kg, 57% by mass). In both scenarios, after the sofa was burned, the HRR decreased and reached a minimum value of 581 kW at 279 s, and 594 kW at 375 s in SC3 and SC9, respectively. The second peak of the HRR in scenario SC3 was higher (2,800 kW) and reached 87 s earlier than in scenario SC9 (1,740 kW at 445 s).
Because the window was closer to the fire load in the scenario with the fire load at the room center (SC3), the amount of heat losses by convection and radiation through it was higher than in scenario SC9. Consequently, the amount of net heat feedback to the surface of fuel was lower in SC3 than in SC9. As a result, the duration of burning was 100 s shorter in scenario SC3 (545 s) than in
scenario SC9 (645 s). The total amount of mass loss in scenario SC9 was greater than in scenario SC3.
5. S
UMMARY ANDC
ONCLUSIONSEleven ventilation scenarios were investigated in order to study the effect of ventilation on fire dynamics in a room of a size of 4.2 m length x 3.8 m width x 2.4 m height. The fire load that was used in all scenarios consisted of a polyurethane sofa and two wood cribs located underneath it. In all scenarios but one (SC9), the fire load was located at the center of the room. In scenario SC9, the fire load was located in the northeast corner of the room.
The FDS version 5 was used to simulate the scenarios. Before conducting the CFD simulations, numerical tests and debugging were carried out in order to (a) find the optimum mesh size, and (b) test the validity of the new combustion model in FDS version 5. It was found that increasing the size of a stretched mesh (in x- and y- directions) beyond 720,000 had an insignificant effect on the results. Therefore, this mesh was used in all scenarios. Also, it was found that the predicted effective heat of combustion of wood was in good agreement with that obtained from Babrauskas’ correlation [7]. This good agreement confirmed the soundness of both the modified mixture friction combustion model and pyrolysis model in FDS version 5.
The CFD results showed that in the case with a window and door located in the same wall, the size of the window had an insignificant effect on the fire characteristics (in terms of maximum HRR, period of burning, remaining mass of the fire load, effective heat of combustion, etc) (see SC7 and SC8). However, the size of the window had a significant effect on the fire characteristics in the cases with a window and door facing each other (see SC2 and SC4), and only a window (see SC1, SC3, SC10 and SC11). Additionally, the results showed that the location of the fire load in the room had a significant effect on the fire characteristics.
A
CKNOWLEDGEMENTSThe authors acknowledge Dr. Gary Lougheed, Dr. Joseph Su and Dr. Alex Bwalya for their valuable feedback, comments and suggestions about this paper.
R
EFERENCES[1] A. Bwalya, D. Carpenter, M. Kanabus-Kaminska, G. Lougheed, J. Su, B. Taber, N. Bénichou, A. Kashef, C. McCartney, A. Bounagui, and R. Thomas. Development of a fuel package for use in the fire performance of houses project. Research Report:
IRC-RR-207, National Research Council, Ottawa,
March 2006.
[2] B. Taber, A. Bwalya, C. McCartney, N. Bénichou, A. Bounagui, D. Carpenter, G. Crampton, M. Kanabus-Kaminska, A. Kashef, P. Leroux, G. Lougheed, J. Su, and R. Thomas. Fire scenario tests in fire performance of houses test facility – data compilation. Research Report:
NRC-IRC-RR-208, National Research Council, Ottawa,
March 2006.
[3] A. Bwalya. Survey results of combustible contents and floor areas in multi-family dwellings. Research Report IRC-RR-253, National Research Council of Canada, Institute for Research in Construction, Ottawa (in progress).
[4] K. McGrattan, B. Klein, S. Hostikka, and J. Floyd. Fire Dynamics Simulator (Version 5)
Technical Reference Guide. NIST Special
Publication 1019-5, January 2008.
[5] K. McGrattan, B. Klein, S. Hostikka, and J. Floyd. Fire Dynamics Simulator (Version 5) User’s Guide. NIST Special Publication
1019-5, October 2007.
[6] K. B. McGrattan, H. R. Baum, R. G. Rehm, G. P. Forney, J. E. Floyd, S. Hostikka. Fire Dynamics Simulator (Version 4), Technical Reference Guide. Technical Report NISTIR
6783, National Institute of Standards and
Technology, Gaithersburg, Maryland, September 2003.
[7] V. Babrauskas. Effective heat of combustion for flaming combustion of conifers. Van. J.
For. Res, 36, pp. 659-663, 2006.
[8] H. H. Saber, A. Kashef, A. Bwalya, G. D. Lougheed, and M. A. Sultan. A numerical study on the effect of ventilation on fire development in a medium-sized residential room. Research Report # IRC-RR-241, National Research Council of Canada, Ottawa, Canada, February 2008.
[9] H. H. Saber, and A. Kashef. CFD simulations for different fire ventilation scenarios in a room. 5th NRC Symposium on Computational Fluid Dynamics and Multi-scale Modelling,

![Figure 3 Oxygen-temperature phase space showing where combustion is allowed to take place [4]](https://thumb-eu.123doks.com/thumbv2/123doknet/14164680.473673/5.918.491.787.105.355/figure-oxygen-temperature-phase-space-showing-combustion-allowed.webp)