Publisher’s version / Version de l'éditeur:
Vous avez des questions? Nous pouvons vous aider. Pour communiquer directement avec un auteur, consultez la première page de la revue dans laquelle son article a été publié afin de trouver ses coordonnées. Si vous n’arrivez pas à les repérer, communiquez avec nous à [email protected].
Questions? Contact the NRC Publications Archive team at
[email protected]. If you wish to email the authors directly, please see the first page of the publication for their contact information.
https://publications-cnrc.canada.ca/fra/droits
L’accès à ce site Web et l’utilisation de son contenu sont assujettis aux conditions présentées dans le site LISEZ CES CONDITIONS ATTENTIVEMENT AVANT D’UTILISER CE SITE WEB.
Internal Report (National Research Council of Canada. Institute for Research in
Construction), 2005-09-12
READ THESE TERMS AND CONDITIONS CAREFULLY BEFORE USING THIS WEBSITE. https://nrc-publications.canada.ca/eng/copyright
NRC Publications Archive Record / Notice des Archives des publications du CNRC :
https://nrc-publications.canada.ca/eng/view/object/?id=4072981a-20a2-4688-83a6-564179f9d157 https://publications-cnrc.canada.ca/fra/voir/objet/?id=4072981a-20a2-4688-83a6-564179f9d157
NRC Publications Archive
Archives des publications du CNRC
For the publisher’s version, please access the DOI link below./ Pour consulter la version de l’éditeur, utilisez le lien DOI ci-dessous.
https://doi.org/10.4224/20378355
Access and use of this website and the material on it are subject to the Terms and Conditions set forth at
Canadian fire statistics tool technical document
Canadian Fire Statistics Tool
Technical Document
IRC Internal Report No
.IR-867
Date: September 12, 2005
Authors:
Abderrazzaq Bounagui
Noureddine Bénichou
Jared Haines
Published byInstitute for Research in Construction National Research Council Canada Ottawa, Canada
TABLE OF CONTENTS
TABLE OF CONTENTS ...I
LIST OF TABLES...II
LIST OF FIGURES ...III
CANADIAN FIRE STATISTICS DATABASE TOOL ...1
INTRODUCTION ...1
1
DATABASES ...1
1.1 Residential Fire Data
... 1
1.1.1 Area of Origin
... 1
1.1.2 Condition of Casualty
... 2
1.1.3 Igniting Object
... 2
1.2 General Fire Incidents Data
... 3
1.2.1 Act or Omission
... 3
1.2.2 Assembly Occupancy... 3
1.2.3 Jurisdiction... 4
1.2.4 Property Classification... 5
1.2.5 Source of Ignition... 5
1.2.6 Summary... 6
1.2.7 Population... 6
2
FIRE STATISTICS TOOL...7
2.1 Purpose
... 7
2.2 Description... 8
2.2.1 Main Form... 8
2.2.2 Trend Graph... 9
2.2.3 Chart... 9
2.2.4 Update table... 10
3
CONCLUSION...11
APPENDIX ...12
LIST OF TABLES
Table 1: Area of Origin data structure ... 1
Table 2. Condition of Casualty data structure ... 2
Table 3. Igniting Object data structure ... 2
Table 4. Act or Omission data structure... 3
Table 5. Assembly Occupancy data structure... 3
Table 6. Jurisdiction data structure ... 4
Table 7. Property Classification data structure ... 5
Table 8. Source of Ignition data structure ... 5
Table 9. Summary data structure... 6
Table 10. Population data structure ... 6
Table 11. List of Controls for the main form (frmFireStatistics)... 12
Table 12. List of Controls for the trend form (frmTrend)... 13
Table 13. List of Controls for the graph form (frmGraph) ... 13
Table 14. List of Controls for the update form (frmDBUpdate)... 14
Table 15. frmFireStatistics functions and subroutines ... 15
Table 16. QueryBuilder functions and subroutines ... 16
Table 17. frmGraph functions and subroutines ... 17
Table 18. frmTrend functions and subroutines... 18
Table 19. frmDBUpdate functions and subroutines ... 19
LIST OF FIGURES
Figure 1. Relationships between Residential Fire Data tables... 7
Figure 2. The main interface of the Canadian Fire Statistics tool ... 8
Figure 3. Trend Graph... 9
Figure 4. Chart ... 10
Canadian Fire Statistics Database Tool
INTRODUCTION
The analysis of fire statistics can provide a great deal of information that can be used to understand a fire problem, factors affecting life safety and reveal general trends and patterns. Therefore, the Fire Research Program (FR) at the Institute for Research in Construction took the initiative to gather Canadian fire incidents data. This data was consolidated into two databases from which the data can be easily accessed and updated as new data becomes available. In addition, FR has developed a tool that provides a user interface to the databases, allowing the user to easily view and update the data. The tool is also capable of generating various charts and tables, which enables the user to quickly create informative reports on the data when needed. This report describes the design and the functionality of the Canadian Fire Statistics tool. The development of the Canadian Fire Statistics tool has used Microsoft Access 2000 to create the databases and Microsoft Visual Basic 6 to create the user interface that interacts with the databases.
1
DATABASES1.1 Residential Fire Data
This database contains a number of tables which hold fire incidents data recorded on residential fires. Currently this database is populated with data provided by Alberta, British Columbia and Ontario.
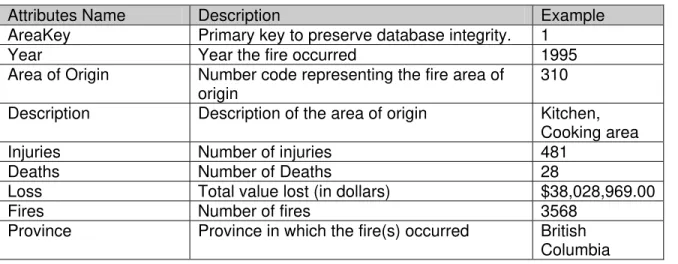
1.1.1 Area of Origin
Table 1 holds fire statistics organized by the location within the residence (area of origin) in which the fire started. It should be mentioned that in order to cut down on repetition, the Description field is held in a separate “Area of Origin (names)” table related to this table by Area of Origin codes. The same is true for all other tables using some form of number code, such as Igniting Object or Material First Ignited.
Table 1: Area of Origin data structure
Attributes Name Description Example
AreaKey Primary key to preserve database integrity. 1
Year Year the fire occurred 1995
Area of Origin Number code representing the fire area of origin
310
Description Description of the area of origin Kitchen,
Cooking area
Injuries Number of injuries 481
Deaths Number of Deaths 28
Loss Total value lost (in dollars) $38,028,969.00
Fires Number of fires 3568
Province Province in which the fire(s) occurred British
1.1.2 Condition of Casualty
The condition of casualty table holds information on recorded fire casualties and their condition at the time of the fire.
Table 2. Condition of Casualty data structure
Attributes Name Description Example
ConditionKey Primary key. 15
Year Year the fire(s) occurred 1995
Condition of Casualty Number code representing the physical & mental condition of the casualty
11
Description Description of the condition Asleep at
Time of Fire
Deaths Number of Deaths 16
Province Province in which the fire(s) occurred Ontario
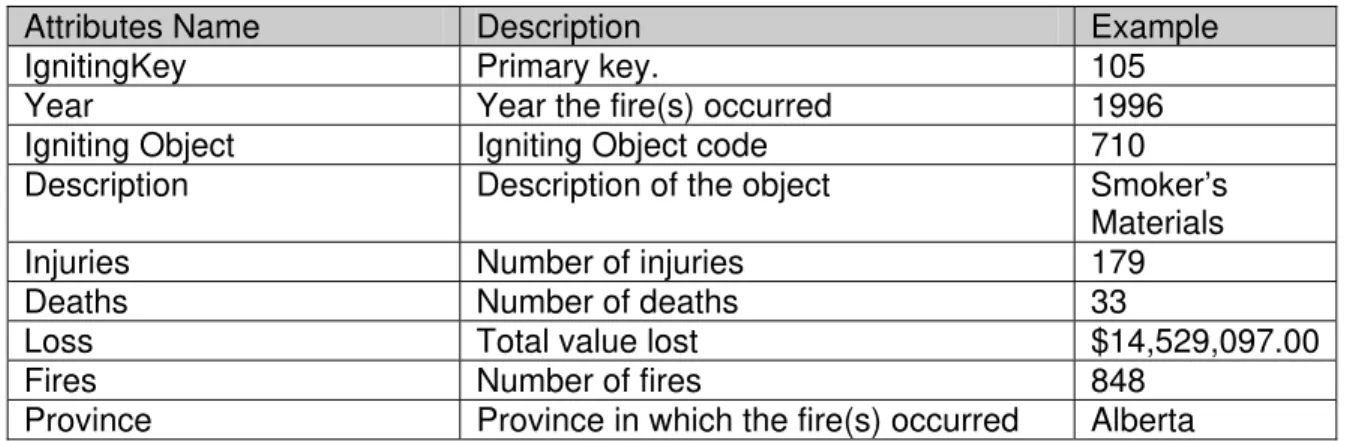
1.1.3 Igniting Object
Table 3 lists fire sources of ignition and the number of deaths, injuries, fires, and losses each is responsible for.
Table 3. Igniting Object data structure
Attributes Name Description Example
IgnitingKey Primary key. 105
Year Year the fire(s) occurred 1996
Igniting Object Igniting Object code 710
Description Description of the object Smoker’s
Materials
Injuries Number of injuries 179
Deaths Number of deaths 33
Loss Total value lost $14,529,097.00
Fires Number of fires 848
Province Province in which the fire(s) occurred Alberta
Similar tables were developed for the level of fire origin, material first ignited, and time of day; their structure is identical to that of the area of origin and igniting object tables. For each table in this database there is a related “Table Name (totals)” query. The query uses the parameters ‘beginning year’, ‘end year’, and ‘Province name’ and computes totals for each data field in that province over the specified time frame. These queries are used by the Canadian Fire Statistics Tool for calculating percentages.
1.2 General Fire Incidents Data
This database contains general fire incidents data generated from the Annual Reports on Fire Losses in Canada (1986-2000) that are published by the Council of Canadian Fire Marshals and Fire Commissioners.
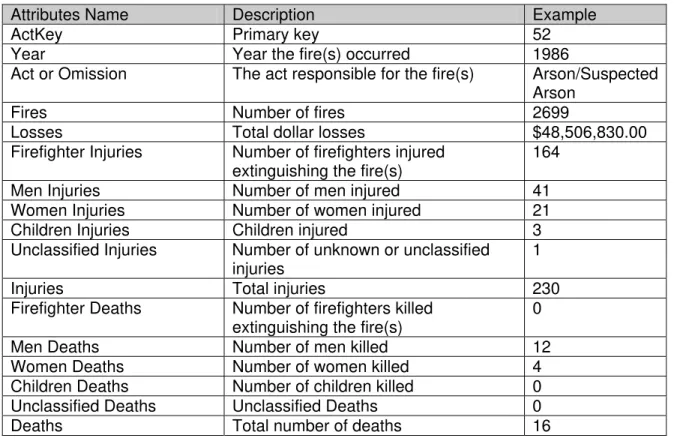
1.2.1 Act or Omission
Table 4 contains fire data organized by the action (or inaction) that caused the fire.
Table 4. Act or Omission data structure
Attributes Name Description Example
ActKey Primary key 52
Year Year the fire(s) occurred 1986
Act or Omission The act responsible for the fire(s) Arson/Suspected
Arson
Fires Number of fires 2699
Losses Total dollar losses $48,506,830.00
Firefighter Injuries Number of firefighters injured extinguishing the fire(s)
164
Men Injuries Number of men injured 41
Women Injuries Number of women injured 21
Children Injuries Children injured 3
Unclassified Injuries Number of unknown or unclassified injuries
1
Injuries Total injuries 230
Firefighter Deaths Number of firefighters killed extinguishing the fire(s)
0
Men Deaths Number of men killed 12
Women Deaths Number of women killed 4
Children Deaths Number of children killed 0
Unclassified Deaths Unclassified Deaths 0
Deaths Total number of deaths 16
1.2.2 Assembly Occupancy
The Assembly Occupancy table lists data recorded from fires occurring in assembly areas.
Table 5. Assembly Occupancy data structure
Attributes Name Description Example
AssemblyKey Primary key. 431
Year Year the fire(s) occurred 2000
Assembly Occupancy Description of the assembly area Food, beverage
establishment.
Fires Total number of fires 393
Injuries Number of injuries 16
Deaths Number of deaths 0
Similar tables exist for fires occurring in residential areas, institutional areas, and “special properties” such as vehicles and outdoor areas.
1.2.3 Jurisdiction
The largest table, jurisdiction, contains data grouped by the province in which the fire(s) occurred.
Table 6. Jurisdiction data structure
Attributes Name Description Example
JurisdictionKey Primary key 42
Year Year the fire(s) occurred 1987
Jurisdiction Province or other jurisdiction in which
the fire(s) occurred
Quebec
Fires Total Fires 13597
Losses Total Losses $263,415,262.00
Residential Property Fires Number of fires occurring in residences
7519 Residential Property Losses Residential Property Losses in
Canadian dollars
$113,272,958.00 Assembly Property Fires Number of fires occurring in assembly
areas.
480 Assembly Property Losses Assembly Property Losses in
Canadian dollars
$21,971,614.00 Institutional Property Fires Number of fires in institutional
properties such as prisons, hospitals and child-care facilities
117
Institutional Property Losses
Institutional Property Losses in Canadian dollars
$2,108,928.00 Business and Personal
Service Property Fires
Number of fires occurring in business properties such as office buildings
170 Business and Personal
Service Property Losses
Business and Personal Service Property Losses in Canadian dollars
$7,247,768.00 Mercantile Property Fires Total fires in shopping centres,
department stores, etc.
632
Mercantile Property Losses Mercantile Property Losses $31,861,087.00
Industrial Manufacturing Property Fires
Total fires in manufacturing areas 389 Industrial Manufacturing
Property Losses
Industrial Manufacturing Property Losses in Canadian dollars
$29,711,874.00 Storage Property Fires Number of fires occurring in storage
areas such as grain elevators and industrial storage facilities
268
Storage Property Losses Storage Property Losses in Canadian dollars
$16,044,961.00 Special Property Fires Total fires occurring in special
properties such as vehicles and outdoor areas
3480
Special Property Losses Special Property Losses in Canadian dollars
Attributes Name Description Example
Farm Property Fires Total fires occurring in farms. 197
Farm Property Losses Farm Property Losses in Canadian dollars
$14,940,254.00 Miscellaneous Property
Fires
Fires occurring in unknown or unclassified areas
345 Miscellaneous Property
Losses
Miscellaneous Property Losses in Canadian dollars
$7,059,574.00 Firefighter Deaths Total firefighters killed while
extinguishing fire(s)
3
Men Deaths Number of men killed 65
Women Deaths Total women killed 34
Children Deaths Number of children killed 0
Unclassified Deaths Number of unclassified deaths 0
Deaths Total deaths 102
Firefighter Injuries Number of Firefighter Injuries 182
Men Injuries Number of men injuries 248
Women Injuries Number of women injuries 139
Children Injuries Number of children injuries 0
Unclassified Injuries Number of Unclassified Injuries 0
Injuries Total injuries 569
1.2.4 Property Classification
Table 7 holds fire data grouped by the type of property the fire(s) occurred in.
Table 7. Property Classification data structure
Attributes Name Description Example
PropertyKey Primary key 13
Year Year in which the fire(s) occurred 2000
Property Classification Type of property in which the fire occurred
Residential
Fires Total fires 21206
Injuries Total injuries 1676
Deaths Total number of deaths 243
Loss Total value lost $529,516,309.00
1.2.5 Source of Ignition
The source of ignition table holds information on the source of each fire.
Table 8. Source of Ignition data structure
Attributes Name Description Example
SourceKey Primary key. 1502
Year Year of occurrence 1987
Source of Ignition Object responsible for starting the fire Cooking equipment
Attributes Name Description Example
Fires Number of fires 8914
Loss Total value loss in dollars. $55,414,565.00
Firefighter Injuries Number of firefighters injured extinguishing the fire(s).
73
Men Injuries Total men injured. 406
Women Injuries Number of women injured 248
Children Injuries Total number of children injured 60
Unclassified Injuries
Number of 5
Injuries Total injuries 792
Firefighter Deaths Number of firefighter deaths 0
Men Deaths Number of men deaths 30
Women Deaths Number of women deaths 12
Children Deaths Number of children deaths 6
Unclassified Deaths Number of unclassified deaths 0
Deaths Total number of deaths 48
1.2.6 Summary
The Summary table holds summarized fire statistics.
Table 9. Summary data structure
Attribute’s Name Description Example
Year Year of occurrence (Primary key). 1987
Fires Total number of fires occurring in Canada
during that year
67168
Deaths Total number of fire deaths 516
Injuries Total number of fire injuries 3843
Losses Total estimated value lost to fires in that year $956,207,142.00
1.2.7 Population
The Population table holds yearly population numbers for each Province.
Table 10. Population data structure
Attribute’s Name Description Example
Year Year (Primary key). 1987
Canada Population in Canada for that year. 26448855
Newfoundland Population in Newfoundland 575158
Prince Edward Island Population in Prince Edward Island 128573
Nova Scotia Population in Nova Scotia 893457
New Brunswick Population in New Brunswick 727880
Quebec Population in Quebec 6782537
Ontario Population in Ontario 9644258
Attribute’s Name Description Example
Saskatchewan Population in Saskatchewan 1032745
Alberta Population in Alberta 2435326
British Columbia Population in British Columbia 3050160
Yukon Population in Yukon 25700
Northwest Territories Population in Northwest Territories 55037
Nunavut Population in Nunavut -
For each table (with the exception of the “Summary” and “Population” tables) there exists a “Table Name (totals)” query which takes a beginning and end year as parameters and calculates totals for each field over this period. The Canadian Fire Statistics tool uses these queries to calculate percentages.
RELATIONSHIP BETWEEN TABLES
Figure 1 shows the relationships between tables in the residential fire database.
Figure 1. Relationships between Residential Fire Data tables
2
FIRE STATISTICS TOOL2.1 Purpose
The purposes of this tool are:
1. To simplify the report-generation process by automating many tasks such as summarizing data, calculating percentages, averages and totals, and producing pie charts, bar charts and trend graphs.
2. To provide an interface to the Residential and General Fire Statistic databases, through which the user may add new data or modify existing data.
2.2 Description
What follows is a listing of each form in the Canadian Fire Statistics tool and a brief description of its function:
2.2.1 Main Form
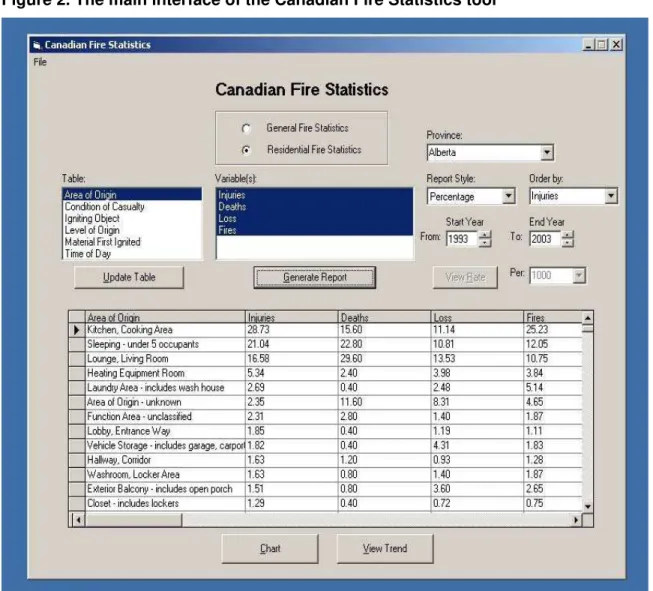
Figure 2. The main interface of the Canadian Fire Statistics tool
Figure 2 depicts the tool’s primary user interface. The user is able to choose either the general or residential fire statistics database. A list of tables is then populated, allowing the user to specify the table they wish to interact with, and the fields within that table they wish to view. It also allows the user the data format (total, average or percentage); the field by which to order the data; and, the time period (if not specified, the start and end years default to the minimum and maximum year found in the table). Once these parameters have been set they can generate a table populated by the formatted data.
2.2.2 Trend Graph Figure 3. Trend Graph
Once the user has specified a database, table, and one or more variables, they can generate a trend graph. This chart displays the variance of the selected fields with respect to time. Currently, the tool always graphs each field as a percentage.
2.2.3 Chart
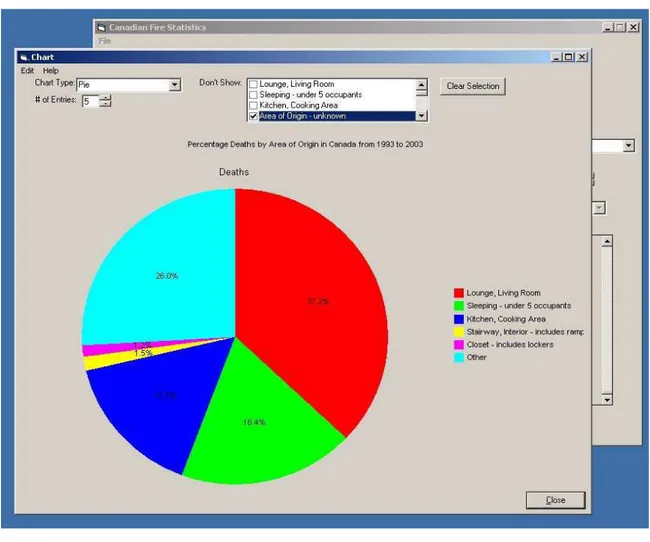
Once a table has been generated in the main form, the user is able to create a chart of that data. The chart type defaults to a bar chart, but the data can also be displayed as a pie chart. To ensure that the charts are readable, the user may select the number of entries to display. The entries not selected are summed up and that value is shown as “Other” on the chart. The user may also choose not to display specific entries by
checking the box beside them in the “Don’t Show” list; this is especially useful for filtering out the numerous “miscellaneous”, “unknown”, and “unclassified” entries that populate nearly every table. It should be noted that both the chart and trend graph interfaces have an “Edit->Copy” menu item that allows the user to paste the charts into an external application (such as Word or Excel) as either an image or a data table. Figure 4 shows an example of the chart generated.
Figure 4. Chart
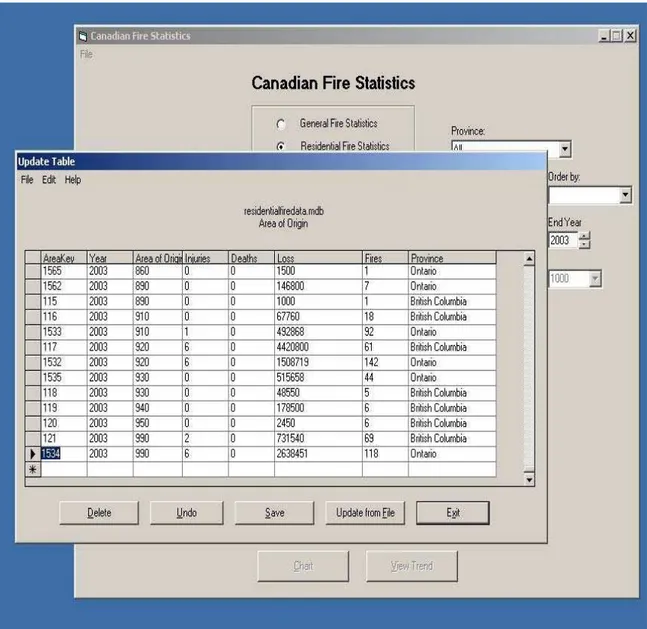
2.2.4 Update table
Once the user has selected a database and table on the main form, they are given the option to update that table. This generates a new form containing a data grid displaying the table’s contents. The user is able to add new records and edit or delete existing records. If the user needs to add a large volume of new entries, they are able to browse for a file containing the data and the tool will attempt to append the data contained in the file to the table. The supported formats of the file are Microsoft Excel format, tab
delimited (fields in the file are delimited by tabs) and csv delimited (fields in the file are delimited by commas). The header required is the attributes of the table to be updated and should be in the first row in the same order as the order of the attributes of the table. For exampleif the table Igniting Object (Page 2) needs to be updated, the headers required for the file are Year, Ignition Object, Description, Injuries Deaths, Loss, Fires Province. If the source file has too many fields the tool will generate an error message and exit. If the source file has too few fields, the user will be prompted for confirmation. Any missing value, represented by a blank, is treated as null value.
Figure 5. Update Table Interface
3
CONCLUSIONIn order to effectively analyze Canadian fire statistics, the available fire statistics were consolidated into two primary databases. In addition, a tool has been designed to simplify users interactions with the databases.
Appendix
The following tables lists the controls and functions that are used for each form in the Canadian Fire Statistics tool.
Table 11. List of Controls for the main form (frmFireStatistics)
Control Name Label/Caption Purpose
obDataChoice(Index) General Fire
Statistics/Residential Fire Statistics
Control array of option buttons which allow the user to select which database to connect to.
lbTable Table Displays a list of tables in the
database.
lbVariable Variable(s) Lists the available variables in the
currently selected table.
cboProvince Province If the residential fire statistics
database is currently in use, this allows the user to specify which Province to view data from.
cbReportStyle Report Style Allows the user to specify how
the report data is displayed (total, average, or percentage).
cbOrder Order by Lists all currently selected
variables, allowing the user to specify which variable to sort the output by.
txtStartYear/udStartYear Start Year Allows the user to specify the
earliest year from which to view data.
txtEndYear/udEndYear End Year Allows the user to specify the last
year from which to view data.
cmdUpdateTable Update Table Loads frmDBUpdate, allowing the
user to modify the contents of the currently selected table.
cmdGenerateReport Generate Report Queries the database according
to the input provided. The query output is displayed in
Control Name Label/Caption Purpose
cmdRate View Rate This control is only enabled when
the Jurisdiction table in the general fire statistics database is selected. Allows the user to view weighted death, injury, and loss data (losses are weighted by the number of fires, injuries and deaths are weighted by provincial population). Once clicked, the caption changes to “View Data” – clicking it again will return the form to the normal mode of operation.
cbRate Display Deaths/Injuries
per ____ people.
This control and its labels are only visible when viewing rates. This allows the user to determine how the weighted death and injury data is displayed (per 100000, 10000, or 1000 are the current options).
dgFireStats This datagrid is where report data
is displayed.
cmdChart Chart Loads frmGraph, displaying a
chart of the current data.
cmdTrend View Trend Loads frmTrend, displaying a
trend graph of the variable(s) selected.
Table 12. List of Controls for the trend form (frmTrend)
Control Name Label/Caption Purpose
chkPercent Display as percentages Allows the user to specify
whether or not the trend data will be displayed as percentages (useful when graphing several variables). By default this is unchecked.
chtTrend Trend data is graphed here.
cmdClose Close Closes the form, returning the
user to frmFireStatistics.
Table 13. List of Controls for the graph form (frmGraph)
Control Name Label/Caption Purpose
cbChartType Chart Type Allows the user to select either
“bar” or “pie” as the type of chart to display the data with.
Control Name Label/Caption Purpose
txtEntries/udEntries # of Entries Enables the user to increment or
decrement the number of records to display on the chart.
lbExclude Don’t Show The user may check items in this
list to omit them from the chart. The value of the hidden item(s) is added to the “Other” entry.
cmdClear Clear Selection Deselects all items in lbExclude.
chtGraph The chart is displayed here.
cmdClose Close Closes the form.
Table 14. List of Controls for the update form (frmDBUpdate)
Control Name Label/Caption Purpose
dgUpdate Displays the selected table’s
contents. This is an editable data grid, so the user is able to
add/modify elements.
cmdDelete Delete Prompts the user for
confirmation, and then deletes the currently selected row.
cmdUndo Undo Prompts the user for confirmation
and then reverts all changes made to the table since it was last saved.
cmdSave Save Prompts the user for confirmation
and then saves all changes made to the table.
cmdBrowse Update from File Loads a dialog box for the user to
locate a data file to update the table with.
cmdExit Exit Prompts the user to save or undo
all unsaved changes, then unloads the form.
3.1 Forms and Modules
Table 15. frmFireStatistics functions and subroutines
Function or Subroutine Input Outpu t
Calls Purpose Private Sub Form_Load() None None None Loads the form,
initializes some values Private Sub
cmdRate_Click()
None None None Prepares the form to display data as “rates” (only allowed when the “Jurisdiction” table is selected).
Private Sub cmdChart_Click()
None None frmGraph.Show() Loads frmGraph. Private Sub
cmdTrend_Click()
None None frmTrend.Show() Loads frmTrend. Private Sub
cmdUpdateTable_Click()
None None frmDBUpdate.Show(), reset()
Loads frmDBUpdate. Private Sub
cmdGenerateReport_Click ()
None None summaryQuery(), rateQuery(),
reportQuery(), executeQuery()
Calls the appropriate query-generating function
(summaryQuery(), rateQuery(), reportQuery()) and passes the output string into
executeQuery(). Loads the recordset generated by executeQuery into a datagrid.
Private Sub lbTable_Click()
None None CReadFiles.Read_DB (), getDBName()
Queries the table selected and populates a listbox with the variables contained in that table. If the table is from
residentialfiredata.mdb , a combobox is populated with a list of Provinces as well. Private Sub
lbVariable_Click()
None None Nothing Enables the “Generate Report” button, and populates the “Order By” comboBox with a list of all selected variables. Private Sub obDataChoice_Click() index as Intege r None CReadFiles.Read_DB (), getDBName()
Queries the database selected and creates a list of tables. Enables or disables the Province list
depending on which database is selected.
Function or Subroutine Input Outpu t
Calls Purpose Private Sub reset() None None None Clears the variable list
and closes the database connection.
Table 16. QueryBuilder functions and subroutines
Function or Subroutine
Input Output Calls Purpose
Public Function summaryQuer y() ByVal blnIsTrend As Boolean summaryQuery As String
None Generates a query for the Summary table in
firedata.mdb. If the blnIsTrend flag is set to “true” then every other column in the query contains duplicate “Year” entries so that the query may be used to generate a trend scatterplot. Public Function trendQuery() ByVal blnPercent As Boolean trendQuery As String
None Generates a query for any table other than Summary to be used for plotting a trend graph. Like summaryQuery(Tr ue), the query output of trendQuery contains duplicate “Year” columns. If blnPercent is set to “true”, values are calculated as percentages. Public Function rateQuery() None rateQuery As String
None Creates a query for the
“Jurisdiction” and “Population” tables in firedata.mdb in which values for each Province are weighted by population. Public Function reportQuery() None reportQuery As String getDBName(), getReportStyle() Creates a query to fill the DataGrid in frmFireStatistics. Private Function getReportStyl None reportStyle As String
None Checks which
“report style” (total, average, or
Function or Subroutine
Input Output Calls Purpose
e() percentage) is specified on frmFireStatistics and returns an appropriate string to be used in the query (e.g. “sum” for totals, “avg” for averages, etc.). Public Function getDBName() None getDBName As String
None Checks which
database is currently in use and returns a string containing the filename of the database. Public Function executeQuery () ByVal blnParamsRequir ed, ByVal strQuery executeQuery As ADODB.Record set CReadFiles.Read_ DB(), getDBNAme() Connects to the database and uses strQuery to query data and return it in a recordset. If blnParamsRequire d is set to “true” then the ADODB.Comman d Parameters() values are supplied with the appropriate parameters (start year, end year, and possibly Province name).
Table 17. frmGraph functions and subroutines
Function or Subroutine Input Output Calls Purpose Private Sub Form_Load() None None drawGraph() Initializes some
values, populates the “Don’t show” list (lbExclude).
Private Sub Form_Resize() None None None Resizes the chart and repositions some controls.
Private Sub Form_Unload None None None Clears the recordset reference.
Private Sub cmdClear_Click()
None None None Unchecks all checked items in lbExclude.
Private Sub cmdClose_Click()
None None None Unloads the form. Private Sub None None None Calls the chart’s
Function or Subroutine Input Output Calls Purpose
mnuCopy_Click() EditCopy() function,
copying its’ contents to the clipboard. Private Sub
mnuCopyInstructions_Click ()
None None None Displays a msgBox containing instructions on how to paste the chart into another application. Private Sub
cbChartType_Click()
None None drawGraph() Sets the chart type depending on which item is selected in cbChartType, and calls drawGraph() Private Sub lbExclude_ItemCheck() Item As Integer
None None If the number of unchecked items in the “Don’t show” list is less that the specified number of items to display, that number is decremented accordingly. The maximum number of displayable entries is also decremented or incremented to match the number of unchecked items. Private Sub lbExclude_Click()
None None drawGraph() Calls drawGraph() to redraw the chart. This event occurs after lbExclude_ItemCheck ().
Private Sub
txtEntries_Change()
None None drawGraph() Adjusts the number of items to display accordingly and calls drawGraph(). Private Sub drawGraph() None None sumRemainder
()
Generates a graph according to the options specified and labels axes, legend, title, etc. Private Function sumRemainder() None sumRemain der as Variant
None Sums up all recordset entries not currently displayed in the chart to be used for the “Other” value.
Table 18. frmTrend functions and subroutines
Function or Subroutine Input Output Calls Purpose Private Sub Form_Load() None None summaryQuery(),
trendQuery(), executeQuery(), drawGraph()
Sets the form caption and chart labels, then calls drawGraph()
Function or Subroutine Input Output Calls Purpose
Private Sub Form_Resize() None None None Resizes the chart and repositions some controls. Private Sub Form_Unload() None None None Closes the database
connection and clears the recordset.
Private Sub chkPercent_Click()
None None trendQuery(), executeQuery, drawGraph()
Sets the blnPercent flag to either true or false
(depending on whether the checkBox is checked or not), requeries the data, and calls drawGraph(). Private Sub
mnuCopy_Click()
None None None Copies the chart to the clipboard.
Private Sub
mnuCopyInstructions_Click( )
None None frmGraph.mnuCo pyInstructions_Cli ck() Displays copying instructions. Private Sub cmdClose_Click()
None None None Unloads the form. Private Sub drawGraph() None None None Plots the data and labels
the axes.
Table 19. frmDBUpdate functions and subroutines
Function or Subroutine
Input Output Calls Purpose
Private Sub Form_Load()
None None getDBName(), CReadFiles.Read_DB()
Creates a backup copy of the database (e.g. firedata.mdb.bak), then queries the selected table and populates a datagrid with the results.
Private Sub Form_Resize()
None None None Resizes and
repositions the datagrid. Private Sub
Form_Unload()
None None None Closes the
database connection. Private Sub
cmdBrowse_Click()
None None dataCopy() Shows a “browse for file” dialog box. Once a file has been selected the file name and path are passed to dataCopy(). Private Sub
cmdDelete_Click()
None None None Deletes the
currently selected record.
Function or Subroutine
Input Output Calls Purpose
cmdExit_Click() to specify whether
they want to save or discard their unsaved changes, and calls the appropriate function. Once this is complete it deletes the backup file and unloads the form. Private Sub
cmdUndo_Click()
None None Undo() Prompts the user to confirm they wish to undo all unsaved changes, then calls Undo(). Private
cmdSave_Click()
None None Save() Prompts the user to confirm they wish to save all changes, then calls Save(). Private Sub
mnuBrowse_Click()
None None cmdBrowse_Click() Private Sub
mnuDelete_Click()
None None cmdDelete_Click() Private Sub
mnuSave_Click()
None None cmdSave_Click() Private Sub
mnuUndo_Click()
None None cmdUndo_Click() Private Sub
mnuExit_Click()
None None cmdExit_Click()
Private Sub Undo() None None getDBName(), Form_Load() Closes the current database connection and overwrites the database with the backed-up file. Refreshes the form.
Private Sub Save() None None getDBName(), rsIsEmpty(), Form_Load()
Closes the database connection and re-loads the form, causing the backup file to be overwritten with a backup of the current database. Private Sub dataCopy() ByVal strPath As None CReadFiles.Read_Text_File(), CReadFiles.Read_Excel(), CReadFiles.Read_DB() Creates a new recordset containing the
Function or Subroutine
Input Output Calls Purpose
String, ByVal strName As String contents of the file specified by strPath and strName. The contents of the new recordset are appended to the current recordset. Private Function rsIsEmpty() None rsIsEmpty() As Boolean
None Returns “true” if
the current recordset row is empty, and “false” otherwise.
Table 20. CReadFiles functions and subroutines
Function or Subroutine
Input Output Calls Purpose
Public Function Read_Text_File() ByVal filePath As String, ByVal fileName As String Read_Text_File As ADODB.Recordset
None Connects to the delimited text file (e.g. CSV) specified by filePath and filename, and returns a recordset of the data. Public Function Read_Excel() ByVal filePath As String, ByVal fileName As String Read_Excel As ADODB.Connection
None Connects to an Excel worksheet and returns the connection object.
Public Function Read_DB() ByVal filePath As String, ByVal fileName As String Read_DB As ADODB.Connection
None Connects to a database and returns the