British Journal of Nutrition (1997), 78, 379-396 379
The sizes of the exchangeable pools
of
selenium in elderly
women and their relation to institutionalization
BY VERONIQUE DUCROS'*, PATRICE FAURE', MONIQUE
FERRY^,
FRANCOIS COUZY~, ISABELLE BIAJOUX~ AND ALAIN FAVIER''
Laboratoire de Biochimie C , H6pital Michallon, BP 21 7, 38043 Grenoble cedex 9, France Service de Ge'riatrie, Centre Hospitalier, 26953 Valence cedex 9, FranceNestle' Research Centre, 1000 Lausanne 26, Switzerland
(Received 19 December 1995 -Revised 20 January 1997- Accepted 18 February 1997)
Exchangeable pools of Se after an intravenous injection of 74Se-enriched isotope as sodium selenite were measured in two groups (n 9) of elderly women (free-living aged 64-82 years and institutionalized aged 68-82 years), and a comparison group (n 9) of young women aged 3 1 4 0 years to evaluate the effect of age and institutionalization on Se reserves. Dietary Se intake was not different among the three groups. Plasma Se and glutathione peroxidase (EC 1.11.1.9) levels were significantly lower in the institutionalized elderly women (P < 0.05). In each of the three groups, two pools were determined from our model. The size of the first pool and the sum of the two pools were lower in the group of institutionalized elderly women than in the other two groups. The significant correlation between plasma Se level and total Se pool size (r 0.66, P < 0.01) indicated that this last variable could serve as a new marker of Se status. Finally, these data suggest that the Se status of elderly women is more related to lifestyle, in terms of institutionalization or not, than to age per se. Selenium: Ageing: Stable isotopes
The increasing number of elderly people in most countries has prompted considerable research into their nutritional status because of its implications for public health care (Sahyoun et al. 1988; Bunker & Clayton, 1989; Volkert et al. 1992). Among nutrients, the role of trace elements in the elderly is only begining to be understood. Two essential trace elements (Zn and Se) have important biological functions, particularly in the immune response which is related to the ageing process (Sandstead & Henrisksen, 1982; Peretz et al. 1991). Many investigators have shown that the plasma measurement of trace elements is not always a good marker of trace-element nutritional status, especially when the defi- ciency is moderate (Bales et al. 1994). For this reason, our general aim was to measure the exchangeable pools of Se and Zn of elderly individuals and to use exchangeable pool size as a measure of trace-element nutritional status. However, the elderly form a heterogeneous population by the great variety of their state of health and its consequences on lifestyle factors such as mobility and appetite. On the one hand, most nutrient requirements of the elderly are considered to be at least equal to those of younger adults and on the other, among the elderly, housebound people are recognized as being at risk of suffering from malnutrition (Keller, 1993). To study the effects of age and institutionalization, three groups were chosen: one group of institutionalized elderly subjects, one group of free- living elderly subjects and one group of young adults living in the same area.
380 V. DUCROS E T A L .
In the present paper, only one trace element is discussed: Se, which is part of the enzyme glutathione peroxidase (EC 1.11.1.9; GSHPx), has a very important role in protecting the cell against free-radical attack (Rotruck et al. 1973). In addition, the protective effect of Se is manifest in its detoxicant role towards heavy metals which accumulate in tissues during ageing (Combs & Combs, 1986; Magos et al. 1987) and in its activator effect in drug metabolism (Combs & Combs, 1986). The aim of the present paper was to investigate whether age and/or lifestyle in terms of institutionalization or not, could be associated with exchangeable pools of Se in human subjects. Whereas previous studies on the exchangeable pools of Se (Janghorbani et al. 1984; Patterson et al. 1989; Swanson et al. 1991) have measured the total retention of the Se isotope in the body, our purpose was to determine only the rate of plasma disappearance of the Se tracer and to evaluate its reliability as a potential approach to the study of Se body status.
STUDY DESIGN AND METHODS
Subjects
Three groups of volunteers living in Valence, France were selected. Group 1 consisted of nine healthy young women aged 3 1-40 years who served as comparison subjects; Group 2 contained nine free-living elderly women aged 64-82 years recruited from a senior citizens’ association and Group 3 contained nine institutionalized elderly women aged 68- 82 years from the geriatric centre. The institutionalization of these women was mainly induced by loneliness, or difficulties in mobility and living alone.
The three groups were of the same sex (female); first because the number of subjects per group was small, and second because over the age of 65, more than two thirds of people are women.
All subjects were free from inflammatory diseases, cancer, digestive malabsorptions, liver or nephrotic diseases, ‘dementia’ syndrome (according to the criteria of DSM 111; American Psychiatric Association, 1980). None had undergone surgery during the last 3 months. None was taking minerals or vitamins. A medical examination was carried out by a doctor and blood tests were carried out. The subjects were informed as to the aim and purpose of the study, and signed an informed consent.
The study was approved by the local ethical committee and supported by the National French Institute of Health and Medical Research (INSERM contract no. 91 1202).
Anthropometric measurements Weight and height were measured by trained personnel.
Blood tests for the selection of subjects
Between 1 and 3 weeks before the time of dose administration, blood samples were taken after fasting to evaluate the overall nutritional state (albumin, transthyretin), to determine the presence of infectious or inflammatory disease (C-reactive protein, CI- 1 -acid
glycoprotein), and to measure the basal status of Zn, Se and GSHPx. All the proteins were measured by nephelometry
.
Total plasma Se was measured by electrothermal atomic absorption spectrophotometry as described by Arnaud et al. (1993). Lyophilized human reference serum Seronorm (batch 010017; Nycomed Pharma, Oslo, Norway) was assessed as quality control and analysed in each series of samples. Mean Se concentration was foundEXCHANGEABLE POOLS OF SELENIUM IN WOMEN 38 1
to be 100 (SD 3) pg/l for a recommended value of 100 (SD 6 ) pg/l. Plasma GSHPx was assayed using a modification of the method of Gunzler et al. (1974) with tert- butylhydroperoxide (Sigma chimie, Saint-Quentin-Fallavier, France) as the substrate instead of H202. The results were expressed as pmol NADPH (Boehringer Mannheim France, Meylan, France) oxidized/min per litre of plasma (U/l).
The preparation of the injectable solution
A 70Zn and 74Se stable-isotope tracer solution was prepared from ZnO (73.4 % 70Zn, a gift from Nest16 Research Institute) and from Se metal (98.2 % 74Se, Medgenix Diagnostics, Ratingen, Germany). ZnO was dissolved in 9.45 M-HCl Normatom (Prolabo, Paris, France) to obtain ZnC12. Se metal was transformed into sodium selenite as described by Ducros et al. ( 1 9 9 4 ~ ) . The two products were mixed, then the pH was adjusted to 6.4 by NaHC03- Na2C03 buffer, and made up to the required volume with isotonic NaC1. The bottling of this solution was carried out under a hood with laminar flow in sterile bottles after 0.2 pm filtration. Bacteriological and physico-chemical controls (osmolarity, pH, total Zn and Se) were performed.
Isotope administration
An accurately weighed dose of enriched isoto es was administered intravenously to each subject, providing 1OOpg 74Se and 1 mg 782n in lOml saline ( 9 g NaCl/l). Isotope administration was performed in fasting subjects by injection into a peripheral forearm vein. A catheter was placed for the first day to collect blood samples. Blood samples (15 ml) were drawn into trace-element-free heparinized plastic tubes at 1, 2, 4, 5 and 6 h post-injection, then at day +1, day +2, day +3, day +8, day +14, day +30 and finally once monthly for the next 6 months. The subjects were in the fasting state for dose day administration only. Plasma was separated after centrifugation at 1500g for 10 min and stored at - 20" until analysis.
Dietary investigation
Dietary data were collected from all subjects by a dietitian. A food frequency questionnaire (FFQ) was administered to the younger women and the free-living elderly women and a 3 d weighed food record was obtained from the institutionalized elderly women. The institutionalized elderly patients did not have a self-selected diet, thus a 3 d weighed food record was more convenient than a FFQ. A FFQ would be difficult to carry out given the memory problems more frequently found in the institutionalized elderly group and manifest in the results of memory tests we administered, and also because they were not involved in their meal preparation. For the free-living groups (i.e. young and elderly people) because diet was self-selected the FFQ was used.
The FFQ was based on a quantitative food frequency technique for a 6 month period. This evaluation was undertaken by a trained dietitian during face-to-face interviews by using photographic measures to quantify the food portions. Each individual interview lasted 1 to 2 h. The subjects were questioned on their usual food and beverage intakes from the time they awoke until the time they went to sleep, begining with breakfast: its composition, the weekly then monthly frequency of the consumption of the different components of breakfast. The same principle was used for the additional food intakes during meals or inter-meal periods. For each food, the frequencies of consumption and the
382 V. DUCROS E T A L .
consumed quantities at each intake were noted. The results were expressed for each food in g/d. The foods were grouped in seventy-two items and were then converted to nutrients by using the INSERM food composition table; the items and the table have been used in a Val-de-Marne epidemiological study (Hercberg et al. 1991). The Se database (Simonoff & Simonoff, 1991) was added to the INSERM food composition table. This Se database is derived from the Se analysis of French foods.
A weighed food intake record was completed for the institutionalized elderly subjects. Food and beverage portions were weighed and recorded before and after consumption by the subjects for three consecutive days preceding the study day. Members of the nursing staff were asked to record extra meals. At each meal, the served dish portion was measured by a meal observer (a member of the nursing staff) who was instructed by the survey dietitian. The intake recorded was based on what the residents actually ate. From the menu and with the technical help of the cook, the food ingredients of each dish were obtained. Finally, the amounts of each food were expressed in g/d and then converted to nutrients by using the same food composition table as was used for the FFQ data.
Sample preparation and analyses
Plasma (0.5 ml) was spiked with 0.5 ml enriched s2Se (100 ng/ml). Enriched 82Se (atomic abundance 96.7 %) in elemental form was purchased from the Oak Ridge Laboratory (Oak Ridge, TN, USA) and transformed to selenite in advance to be employed as an internal standard. A microwave digestion developed in our laborarory (Ducros et al. 1994b) was applied to these samples. Se isotopic ratios were determined by gas chromatography-mass spectrometry on a Nermag R 10-1OC (Quad service, Argenteuil, France) equipped with a DN 200 gas chromatograph (Perkin Elmer, Norwalk, CT, USA) as previously described (Ducros & Favier, 1992). A quality control of isotopic Se ratio was assessed by determining in each series of samples the "Se : 82Se ratio of the serum Seronorm spiked with the internal standard. The CV was found to be 7.8 % on the 80Se : 82Se ratio measured in twenty-six different series.
Data analysis
Our approach to studying the Se exchan eable pools was to measure the plasma Se lnetics following an intravenous injection of 7!3e-enriched isotope. The plasma 74Se decay over the time was estimated using a computer program of pharmacokinetic data modelling. The 'best-fit' data were obtained from the double exponential equation describing a two- compartment model. The interpretation of the results for the elderly was made from those obtained in young adults.
From measured isotopic ratios 74Se : 82Se and 80Se : 82Se, the quantities of natural Se and enriched 74Se were calculated in each sample. 74Se isotope enrichments were expressed by the 74Se: NSe mass ratio, where NSe is the natural Se in the sample. This definition of enrichment is identical to the tracer : tracee molar ratio which is widely used to express stable-isotope enrichment, particularly in the application of tracer kinetic and compartmental modelling methodologies (Cobelli et al. 1987). Moreover the advantage of this expression is to allow direct calculation of the Q size of the pool (Qpg = D,g/(74Se : NSe)) and not only the V volume of the pool (V, = D,g./74Se,g,l), where D is the dose of injected 74Se. For each subject, the semi-log plasma kinetic curve of the 74Se: NSe mass ratio over 4 months was plotted. Mean and SEM of these data are represented for each group in Fig. 1. For each group, details of the first 72 h are also given
EXCHANGEABLE POOLS OF SELENIUM IN WOMEN 383
for a better view of the first data in Fig. 2. A mathematical approach was used to convert these data into a pharmacokinetic model. By using the PHARM IV software from Roberto Gomeni (SIMED, Crkteil, France), the experimental curve was found to follow a double- exponential equation describing two-compartment kinetics. The model-fitting process used for parameter estimation was the peeling algorithm. The peeling algorithm allows the user to choose visually the number of phases and the number of observations belonging to each phase. The adequacy of the model-fitting was calculated by the distribution of the residual plots: 95 % of normalized residuals must be between
-
2 and+
2. For each subject, the data were fitted, parameter estimation (A, B, a, andp)
was calculated individually, and the adequacy of a two-compartment model was checked. The sizes of the two exchangeable pools or compartments (Qa, Qb), their half lives (t% A, t% B), their elimation rates (Kel) and the rates of exchange between these pools (Kab, Kba) were calculated from the known amount of 74Se injected (D) and the following decay equation: C, = AePclt+
Be-Bt describing a two-compartment model (Fig. 3). C, is the plasma concentration at time t; A, B, a, andp
are constants which define the two phases of the curve: the distribution phase (A zero-time intercept, a slope) and the elimination phase (B zero-time intercept,p
slope); Vd is the apparent volume of distribution and the AUC the area under curve. Model fits for one representative subject of each group are shown in Fig.4.
Statistics
Means, SEM, one-way ANOVA with subsequent Newman-Keuls test, and regression analysis were carried out using PCSM (Programme Conversationnel des statistiques pour les Sciences et le Marketing) software (Deltasoft, Meylan, France). For each parameter, one-way ANOVA was used to find if the ‘group’ factor had a significant value, and if so a Newman-Keuls test was performed to determine between which groups this significant difference was. The level of significance used in all analyses was P < 0.05. For comparison of anthropometric data between the two groups of elderly, Student’s t test at 5 % level of significance was carried out using PCSM software.
RESULTS Anthropometric data
The two groups of elderly people were not significantly different in age or weight but were significantly different in height ( P = 0.029). However, the BMI was not significantly different between these two groups (Table 1). The young adult group was taller and lighter than the two elderly groups. BMI was significantly lower in the younger group.
Selenium Status
Basal variables required to estimate the Se status are also reported in Table 1. Plasma Se values were similar in two groups: the young adults and the free-living elderly. Plasma Se values for the institutionalized elderly were lower than those of these two groups (approximately 20 % less). A significant difference ( P < 0-05) between the institutionalized elderly and the two other groups was found. Natural plasma Se levels measured during the kinetic study with 74Se in the institutionalized elderly were similarly low. Plasma GSHPx
3
84
V. DUCROS E T A L .h
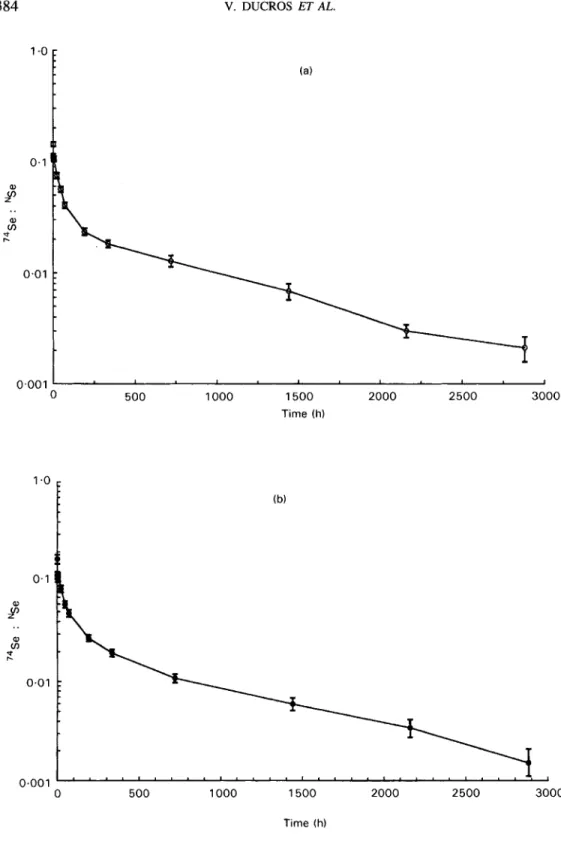
0.01 0.001 1 0 500 1000 1500 2000 2500 3000 0 500 1000 1500 2000 2500 3000 Time (h)Fig. 1. Semi-log plasma kinetic curves of the 74Se : NSe mass ratio v. time for (a) young adult women (b) free-living elderly women and (c) institutionalized elderly women who received an injection of 74Se as sodium selenite at time 0. Each curve represents the mean of each group (n 9); standard errors for each point are shown by vertical bars.
0.1
I
EXCHANGEABLE POOLS OF SELENIUM IN WOMEN
(c) 385 a, v) cn" r. 0.01 0.001 0 500 1000 1500 2000 2500 3000 Time (h) Fig. l(c).
levels were significantly different between the institutionalized elderly and the young adults. There was a correlation between plasma Se and GSHPx values ( r 0.45, P < 0.02).
Dietary Se intakes were not significantly different among the three groups. A significant correlation existed between the Se intake and the protein intake ( r 0.76, P < 0.01).
Plasma 74Se enrichment
The enrichment defined as 74Se:NSe mass ratio gave a higher curve for the institutionalized elderly group (Figs. 1 and 2). Indeed, they had slightly higher plasma 74Se levels than the two other groups but they also had lower natural plasma Se. Decay curves of plasma 74Se enrichment were plotted over
4
months only, because after this period of time, for all the subjects in the young adult and free-living elderly groups, no plasma 74Se isotope enrichment was found. From the data for the first 72 h (Fig. 2), we observed a decrease of the tracer between the 1 h and the 2 h data points and then a slightly rounded 'hump' between the 2 h or 4 h and the 6 h data points.Selenium pool size
The calculated sizes of the exchangeable pools Qa and Qb for the three groups are presented in Table 2. In the institutionalized elderly, a decrease of the two pool size Qa and Qb was found by compararison with the other two groups but the difference was significant ( P < 0.05) only for the first pool size. If this pool size was expressed per kg body weight, the difference became significant between the two elderly groups and the young adult group for the two pools.
386 V. DUCROS ET AL. (a) 0 24 48 Time (h) 72 0 24 48 72 Time (h)
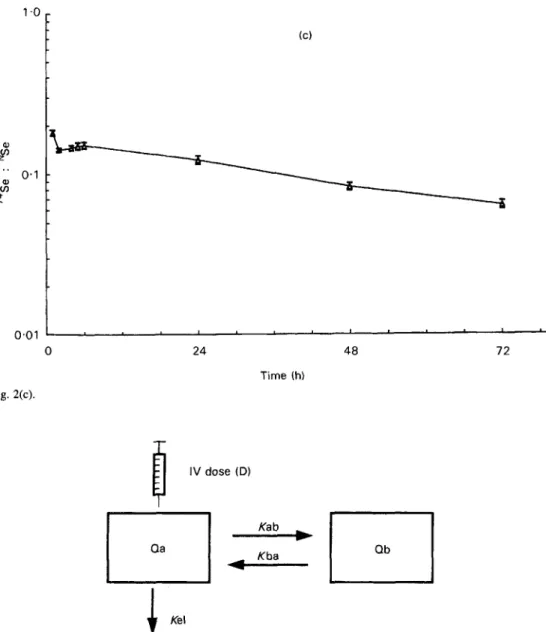
Fig. 2. Plasma kinetic curves of the 74Se : NSe mass ratio v. time for the first 72 h after injection of 74Se as sodium selenite in (a) young adult women, (b) free-living elderly women and (c) institutionalized elderly women. Each curve represents the mean of each group (n 9); standard errors for each point are shown by vertical bars.
EXCHANGEABLE POOLS OF SELENIUM IN WOMEN 387
H
" 0.1 0) v) * 0.01 Fig. 2(c). 0 24 48 Time (h) 7 2 T I V dose (D)0
Fig. 3. The concept of a two-compartment pharmacokinetic model. The model is described by the decay equation: C, = Ae-''
+
B e d t , where C, is the plasma concentration at time t; A, B, a and p are constants which define the two phases of the curve: the distribution phase (A, zero-time intercept, a slope) and the elimination phase (B, zero-time intercept, p slope). Qa=D/(A+B); Qb=Vd - Qa, where Vd is the apparent volume of distribution. Vd = D/(AUC x p), where AUC is the area under the curve. Kel, elimination rate; Kab, Kba, rates of exchangebetween the two exchangeable pools.
Selenium turnover
The half-lives of the pools t,A and t%B, the elimination rates Kel and the rate-constants defining fluxes between the pools (Kab and Kba) obtained from the model are shown in Table 3. The first half-life was just over 24h in young adults. A slight increase was observed among the elderly but this result was statistically different ( P < 0.05) only
388 V. DUCROS E T A L . 0.1 al v) 0 r. 0.01 0.001 0 500 1000 1500 2000 2500 3000 0 0 500 1000 1500 2000 2500 3000 Time (h) 0.1
H
al v) r? 0.01 0t
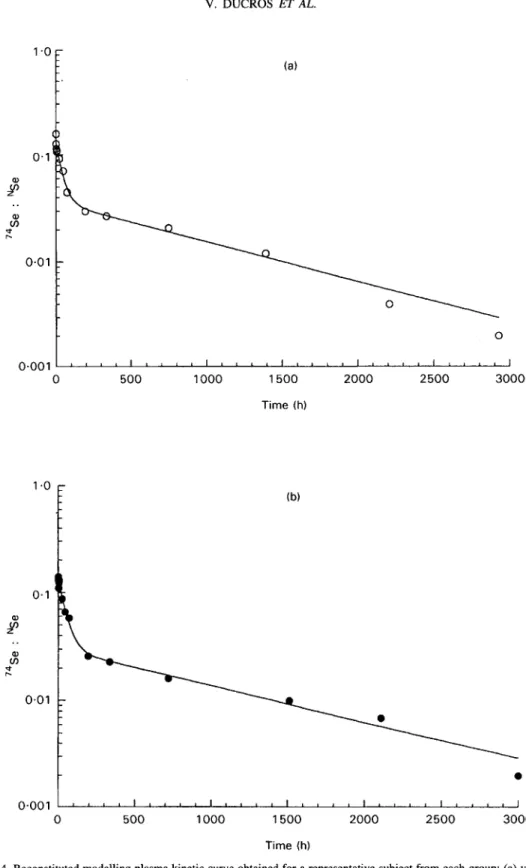
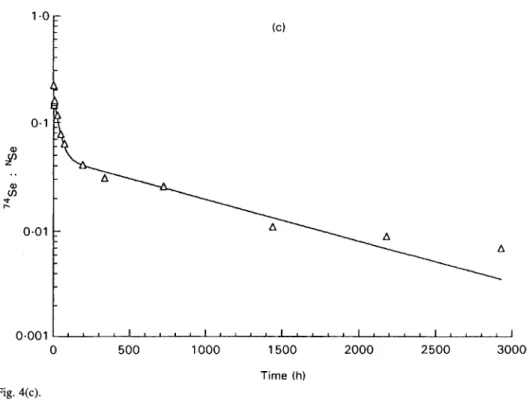
~ ~ ~ ~ 1 ~ " " ' " " " " " " " " " " " " ~ 0 500 1000 1500 2000 2500 3000 Time (h)Fig. 4. Reconstituted modelling plasma kinetic curve obtained for a representative subject from each group: (a) young adult women, (b) free-living elderly women, (c) institutionalized elderly women.
'I
EXCHANGEABLE POOLS OF SELENIUM IN WOMEN
( C ) 389 0.0011 " " I " " I " " " " " " " " " ' I 0 500 1000 1500 2000 2500 3000 Time ( h ) Fig. 4(c).
Table 1. Anthropometri data and basal selenium status of young adult, fre institutionalized elderly women
(Mean values with their standard errors for nine subjects per group)
living elderly and
Young adults Free-living elderly Institutionalized elderly
Variable Mean SEM Mean SEM Mean SEM
Age (years) 36 1 12* 2 13* 2 Weight (kg) 56.6 2.0 61.3* 3.2 62.3 3.3 Height (m) 1.64 0.01 1.59* 0.02 1.54*t 0.01 Plasma Se (pg/l) 84.3 4.7 81.6 4.0 65.8*t 2.2 Dietary Se intake (pg/d) 35.1 2.2 34.1 2.8 31.6 1.8 BMI (kg/m2) 21.0 0.7 2 6 . F 1.2 26.4* 1.3 Plasma GSHPx (U/l) 39 1 21 321 23 282* 29 GSHPx, glutathione peroxidase.
* Mean values were significantly different from those for young adults, P < 0.05.
t
Mean values were significantly different from those for free-living elderly, P < 0.05 (height only: Student's t test).between the young adults and the institutionalized subjects. The second half-life was about 30 d for the young adult group. A significant increase of this half-life was observed for the group of institutionalized elderly subjects compared with the other two groups. The elimination rate Kel was significantly lower in the institutionalized elderly pointing to a greater retention of 74Se in institutionalized elderly subjects. The rate-constants Kab and Kba were not significantly different among the three groups.
390 V. DUCROS ET AL.
Table 2. Sizes of the exchangeable pools of selenium obtained after an intravenous dose of Se in young adult, free-living elderly and institutionalized elderly women
74
(Mean values with their standard errors for nine subjects per group)
Young adults Free-living elderly Institutionalized elderly
Pool$ Mean SEM Mean SEM Mean SEM
Qa (w) 835 39 825 67 619*t 20
Q W g (Irg/kg) 44.1 4.4 33.4* 3.1 29.1 * 2.0
Qb (pg) 2473 233 2267 266 1767 61
Q a / k ( W k ) 14.9 0.8 12.3* 0.8 10.2* 0.6
QafQb ( W 3308 240 3093 311 2386*t 72
* Mean values were significantly different from those for young adults, P 4 0.05.
t Mean values were significantly different from those for free-living elderly, P < 0.05.
For details of pools, see Fig. 3.
Table 3 . Half-life and rate constants obtained from the$tted model after an intravenous dose of 74Se in young adult, free-living elderly and institutionalized elderly women
(Mean values with their standard errors for nine subjects per group)
Young adults Free-living elderly Institutionalized elderly
Constants Mean SEM Mean SEM Mean SEM
~ ~ ~ ~ _ _ _ _ _ _ _ ty, A (h) 27.6 1.5 30.2 1.6 34.9* 2.7 k B (h) 720.1 39.5 695.4 50.4 879.0*t 54.7 Kel (/h) 00040 0.0002 0.0038 0.0002 0.0030*t o m 0 1 Kab (/h) 0.0161 0.001 1 0.0143 0~0010 0.0130 0.010 f i a (/h) 0.0066 0.0006 0.0064 0.0003 0.0056 04)005 * Mean values were Significantly different from those for young adults, P < 0.05.
t Mean values were significantly different from those for free-living elderly, P < 0.05.
DISCUSSION Selenium intake
Se intake was similar in the three groups (32-35pg/d) but was below the 1989 recommended dietary allowance for Se (55 pg/d for adult females; National Research Council, 1989). Previous studies on Se intake in France have reported a daily Se intake of about 43-48 pg/d (Simonoff & Simonoff, 1991; Lamand et al. 1994; Pelus et al. 1994). These Se values were determined in healthy young men but in the present study, only women were involved and knowing that women generally eat about 20 % less than men, their average Se value of 35pg/d can be explained. Moreover in one of these French studies (Lamand et al. 1994) the mean dietary Se intakes are reported as a function of sex and age: 35 pg/d for 2540-year-old women and 29 pg/d for women over 60 years old.
Three procedures are recommended for estimating the human dietary intake of trace elements: (a) total diet collections of a market basket of food reflecting a defined total diet of a consumer, (b) selective studies of individual foodstuffs, (c) duplicate portion studies (Bro et al. 1990; Benemariya et al. 1993). The previous French evaluations of Se dietary intake were made by using one of these different techniques: duplicate diet (Pelus et al. 1994), market basket (Lamand et al. 1994) and food chemical analysis (Simonoff & Simonoff, 199 1).
EXCHANGEABLE POOLS OF SELENIUM IN WOMEN 391
In this current study, two different kinds of dietary assessment were used: a FFQ and a 3 d weighed food intake, both based on a food composition table. The calculation of Se intake from food tables presents some disadvantages: the data are usually incomplete, as the Se content of a number of relevant foodstuffs is not known or given; or if the data are available, they are not always representative of the foods consumed by the subjects. Food type is probably the most important variable in determining the amount of Se consumed (Stacchini et al. 1989; Benemariya et al. 1993).
To sum up, there is no accurate way to measure daily Se intake and a 3 d weighed intake can only be considered as a crude estimate of actual intake. However, our dietary Se intake results are close to those reported by previous French studies.
Selenium status
This study compared the information given by static variables (plasma Se and GSHPx activity) of Se status and metabolic investigations such as the utilization of stable isotopes. No decrease in the Se status of the free-living elderly group was found whereas significantly lower plasma Se and GSHPx concentrations were shown in institutionalized elderly women. Published studies are not in agreement concerning a progressive decrease of Se status with age. However, several studies (Bunker et al. 1988; Campbell et al. 1989; Bortoli et al. 1991) have reported reduced plasma Se levels in institutionalized elderly subjects. As GSHPx has an antioxidant function, lower plasma GSHPx in institutionalized elderly subjects may reflect a greater risk, in this group, of oxidative damage by lipoperoxides and, in particular, of age-related degenerative diseases such as cancer and heart disease. It may, therefore, be of interest to evaluate Se status of institutionalized elderly people with regard to improving population health and survival.
This decrease of Se status has been explained by the decrease of Se intake or by the decrease of protein intake (Bunker et al. 1988; Campbell et al. 1989). In the present study, the Se dietary intake was nearly identical between the two groups of elderly women (Table 1) and their protein intake too: mean 64.6 (SEM 5.4) g/d and mean 63.1 (SEM 3.6) g/d for the free-living elderly and the institutionalized elderly subjects respectively. Another explanation for the lower Se status in institutionalized elderly could be altered Se absorption induced by a nutrient-medication interaction. The institutionalized elderly population who tended to suffer from anxiety or depression often took medication (five institutionalized elderly women took an antidepressant drug and four took at least one anxiolytic).
Dose of 74Se injected
A stable isotope is always present in the body tissues contrary to a radioisotope, so the dose of stable isotope required to provide adequately enriched samples will be larger than a true ‘tracer’ dose as radioisotopic tracer is defined. For designing a stable-isotope study, the dose of isotope must be as small as possible so as not to perturb steady-state conditions in the body but two main factors must also be taken into consideration when calculating the dose to be used: the detection limit of the analytical technique used to determine the isotope enrichment in body fluids, and the time course of the study.
The 74Se dose of 1OOpg could be considered to be too high because this dose represents approximately three times the dietary Se intake of the three groups (about 35 pg/d) but our stable isotope study was not performed to study Se absorption. In fact, the injection of 100 pg Se into the first pool of average 835 pg would only be expected to
392 V. DUCROS ET AL.
increase Qa transiently by approximately 12 %. This is well within the range of variation in plasma Se concentrations found in the group of younger women and we consider, therefore, that 100 pg is a valid amount to use for these studies, especially when the time course is so long. However, this dose of tracer could have perturbed the rate constants.
Plasma 74Se enrichment
Some research has already been carried out by Patterson et al. (1989) for selenite and Swanson et al. (1991) for selenomethionine by using kinetic modelling. After ingestion of Se tracer as selenite or selenomethionine, its rate of appearance or disappearance in plasma, urine and faeces has been measured. The obtained multicompartmental models are very complex in order to reflect the complexity of Se metabolism in human subjects. Janghorbani e f al. (1990) have defined another type of model with a two-pool concept for body Se. This model is based on the known aspects of mammalian metabolism of Se. One pool (called the selenite-exchangeable metabolic pool or Se-EMP) takes into account the metabolism of all the different forms of selenocompounds originating from selenite and the second one consists of all selenomethionine-containing compounds. The size of this selenite-exchangeable pool can be determined at different periods of time and could approach the whole-body Se when determined at infinite time (Janghorbani et al. 1990). This model is simpler than multiexponential models described by the two other groups of researchers but is still based on the determination of the total Se body retention.
The measurement of the total retention of the Se-enriched isotope implies that Se- enriched isotope is measured in plasma, urine and faeces. Urine and faeces are not always easy to collect accurately among different population groups such as babies or institutionalized elderly people and therefore limit the use of the concept of the Se exchangeable pools as defined by previous studies (Janghorbani et al. 1984; Patterson et al. 1989; Swanson et al. 1991). Our aim was to find a simple model of long-term Se kinetics by which to compare Se metabolism modifications in different physiological or clinical situations. Because of its simplicity, this model has some drawbacks. In particular, our mathematical approach does not allow us to take into account, as another compartment, a very short period of time (between 1 and 2 h) because of the number of data points. In the same way, the slightly rounded ‘hump’ observed during the very first hours of dosing has not been isolated. However a three-compartment model was not suitable and the best fitting results were obtained for a two-compartment model.
The kinetic model
Using our kinetic modelling, two pools were defined in young adults: the mean size of the first pool was 0.84 mg with a half-life of about 1 d, and that of the second was 2.47 mg with a half-life of 30d.
Selenium pool size. If we compare the size of the first pool and the plasma pool (the size of plasma pool evaluated by the Se plasma concentration multiplied by the plasma volume), the size of this first pool was approximately equal to three times the size of the plasma pool in each group (Table 4). Only a few data are available concerning the size of the Se pools and most of them refer to a total pool size. Yet we can distinguish those estimating a whole-body Se content: 14.6 mg (Schroeder et al. 1970), and 3.5 mg (Stewart et al. 1978) and those referring to a selenite pool size: 10.3 mg (Janghorbani et al. 1984),
EXCHANGEABLE POOLS OF SELENIUM IN WOMEN 393
Table 4. Relation between the plasma pool size and the3rst pool size (Qa) of selenium in young adult, free-living elderly and institutionalized elderly women; data from the study of
Janghorbani et al. (1984) are given for comparison (Mean values for nine subjects per group in the present study)
Young Free-living Institutionalized Janghorbani et al.
adults elderly elderly (1984)t
Basal plasma Se (pg/l) 84.3 81.2 65.8 115
First pool size/plasma pool size 835/253 = 3.31 825/249 =3.31 619/197 = 3.14 1000/345 = 2.90
Plasma pool size* (pg) 253 249 197 345
* Plasma volume considered is 3 litres
t
n 4.and 9 4 m g (Martin et al. 1989). The size of the total pool determined by Stewart et al. (1978) is lower than the other three total pool sizes because it was determined in New Zealand subjects whose dietary Se intake is much lower (approximately 24 pg/d) than that of American subjects (approximately 110 pg/d). However, in one publication (Janghorbani et al. 1984) a first pool of 1 mg in young male adults is indicated which is in agreement with our own results. When the size of the pool was expressed per kg body weight, a mean value of 14-9 pg/kg was found for the group of young women which is comparable to the mean value of 14.3 pg/kg found in young men (Janghorbani et al. 1984). If a global pool (the sum of the two pools) is considered, a mean value of 3.3mg was obtained for the group of younger women which is in agreement with the published data (Stewart et al. 1978) (taking into account our dietary Se intake of 35 pg/d). The size of the total pool is correlated to the Se intake. Moreover there is a correlation between the size of each Se pool and the plasma Se levels. The correlations between plasma Se v . the first pool size ( r 0.62,
P < 0-01), v . the second pool size ( r 0.61, P < O.Ol), and v . the total pool size ( r 0.66,
P < 0.01) support the potential of Se pool size as a Se status indicator.
Selenium turnover. Estimates of mean residence time or half-life of selenite in the different pools have been made by several authors (Thomson & Stewart, 1974; Janghorbani et al. 1984; Martin et al. 1989; Patterson et al. 1989). To compare our results with the published data, we chose to express all the data in terms of half-life and we converted the residence time (RT) to half-life (tE) by the following equation: RT x ln2 = RT x 0-693 = tE. Some of these studies have estimated half-life of the pools from label retention in the human body (Thomson & Stewart, 1974; Janghorbani et al. 1984; Martin et al. 1989) but two studies used plasma Se kinetics to determine the different pools (Thomson & Stewart, 1974; Patterson et al. 1989). Our model gives us access to two compartments, the first one with a half-life of 0.9-1-4d was similar to the first plasma pool reported by Thomson & Stewart (1974) (0.7-1.4d) and to the P3 plasma pool reported by Patterson et al. (1989) (0-25-1.20d). Patterson et al. (1989) speculate that this pool may be identified with a protein or a selenoenzyme secreted or excreted by the liver (GSHPx and/or selenoprotein P) which is in agreement with the half-life of extracellular GSHPx estimated to be about 12 h (Hill & Burk, 1994). The second pool with a half-life of 22-37 d was shorter than the tissue compartment of Patterson et al. (1989) (80-197d) and shorter even than the third compartment of Thomson & Stewart (1974) (69-77d). Thomson & Stewart (1974) proposed that this final phase of the plasma kinetic represents long-term metabolism and reutilization of label incorporated into serum proteins with a slow turnover rate. A possible hypothesis is that this pool reflects label coming out of the peripheral tissues with a slow
394 V. DUCROS E T A L .
turnover such as kidneys, which are considered to be the main synthesis organ of plasma GSHPx in human subjects (Avissar et al. 1994).
Comparison of groups from the kinetic model
If we compare the young adults and the free-living elderly group, the smaller size of the pools does not seem to be linked to age but rather to the body weight of the subjects. A significant difference (P<O.O5) in the sizes of the pools was found when these were expressed per kg body weight (Table 2). A known proportion of our elderly subjects were overweight and this fat increase which is classic until 60-70 years can explain the modification of the pool size. However, no correlation existed between the pool size and the body weight. It would be interesting to investigate whether a correlation exists between the pool size and the lean body mass.
A significant difference existed for the first pool size and the total pool size between the institutionalized elderly and the other two groups. This lower size may be linked to the decline of physiological functions associated with ageing which is emphasized with the institutionalization. Different hypotheses may be relevant to explain the lower Se status of institutionalized elderly subjects: reduced intestinal absorption and reduced hepatic capture enhanced by medication and/or a decrease of blood flux to the organs linked to reduced physical activity (most of the institutionalized elderly remain immobile, just going from bed to chair).
The half-life of the pools was clearly increased in the institutionalized elderly group and particularly for the second pool. The function of hepatic microsomal enzymes responsible for biotransformation may be impaired not only by the age but by concomitant therapy in this grou The increase in the half-life of the pools may be explained by a defect in the use of Se for the synthesis of selenoproteins. The elimination rate constant Kel was significantly lower in institutionalized elderly women, showing a greater retention of 74Se. The elimination rate constant Kel reflects the renal elimination rate and/or the metabolic elimination rate. The renal function of the subjects (established from the values of the plasma creatinine, results not shown) was considered to be normal. So a modification of the metabolic elimination rate seems to be more relevant.
In conclusion, this study has demonstrated the applicability of a stable-isotope technique for studying the rate of 74Se plasma disappearance in humans and its potential for determining Se pool size and turnover. The work described here does not explain the origin of the lower Se status in institutionalized elderly subjects but demonstrates alterations in their Se kinetics because changes in Se turnover and distribution appear to be present. The results of this study suggest that ageing per se has no effect on Se status.
.p4
We wish to acknowledge the technical support of Nicole Belin and Daniel Ruffieux for the sample preparation and analysis; the two dietitians BCatrice Sidobre from Valence Hospital who carried out the dietary investigation and Michlle Deheeger from Paris (Dr S. Herc- berg, ISTNA, CNAM) who did the conversion from foods to nutrients. We thank Gilbert Schillinger for administering the enriched isotope intravenous injections and Michel Faber for his help in sterilizing this injectable solution. The authors are also grateful to the staff of the elderly unit and to the volunteers who made this investigation possible. This study was supported in part by the National French Institute of Health and Medical Research (INSERM contract no. 911202).
EXCHANGEABLE POOLS OF SELENIUM IN WOMEN 395
REFERENCES
American Psychiatric Association (1980). Diagnostic and Statistical Manual of Mental Disorders (DSM IIl).
Washington, DC: American Psychiatric Association.
Amaud, J., Prual, A., Preziosi, P., Favier, A. & Hercberg, S. (1993). Selenium determination in human milk in
Niger: influence of maternal status. Journal of Trace Elements and Electrolytes in Health and Diseases 7 ,
Avissar, N., Ornt, D. B., Yagil, Y., Horowitz S., Watkins, R. H., Kerl, E. A., Takahashi, K., Palmer, I. S. &
Cohen, H. J. (1994). Human kidney proximal tubules are the main source of plasma glutathione peroxidase.
American Journal of Physiology 266, C3674375.
Bales, C. W., DiSilvestro, R. A., Cume, K. L., Plaisted, C. S., Joung, H., Galanos, A. N. & Lin, P.-H. (1994). Marginal zinc deficiency in older adults: responsiveness of zinc status indicators. Journal of the American College of Nutrition 13, 455462.
Benemariya, H., Robberecht, H. & Deelstra, H. (1993). Daily dietary intake of copper, zinc and selenium by
different population groups in Burundi, Africa. Science of the Total Environment 136, 49-76.
Bortoli, A,, Fazzin, G., Marchiori, M., Mello, F., Brugiolo, R. & Martelli, F. (1991). Selenium status and effect of selenium supplementation in a group of elderly women. Journal of Trace Elements and Electrolytes in Health and Diseases 5, 19-21.
Bro, S., Sandstrom, B. & Heydorn, K. (1990). Intake of essential and toxic trace elements in a random sample of
Danish men as determined by the duplicate portion sampling technique. Journal of Trace Elements and
Electrolytes in Health and Diseases 4, 147-155.
Bunker, V. W. & Clayton, B. E. (1989). Research review: studies in the nutrition of elderly people with
particular reference to essential trace elements. Age and Ageing 18, 422429.
Bunker, V. W., Lawson, M. S., Stansfield, M. F. & Clayton, B. E. (1988). Selenium balance studies in apparently
healthy and housebound elderly people eating self-selected diets. British Journal of Nutrition 59, 171-180.
Campbell, D., Bunker, V. W., Thomas, A. J. & Clayton, B. E. (1989). Selenium and vitamin E status of healthy
and institutionalized elderly subjects: analysis of plasma, erythrocytes and platelets. British Journal of Nutrition 62, 221-227.
Cobelli, C., Toffolo, G., Bier, D. M. & Nosadini, R. (1987). Models to interpret kinetic data in stable isotope
tracer studies. American Journal of Physiology 253, E55 1-E564.
Combs, G. F. & Combs, S. B. (1986). The Role ofSelenium in Nutrition. Orlando: Academic Press.
Ducros, V. & Favier, A. (1992). Gas chromatographic-mass spectrometric method for the determination of
selenium in biological samples. Journal of Chromatography 583, 35-44.
Ducros, V., Richard, M. J. & Favier, A. (1994~). The distribution of selenium in human plasma proteins for 24
hours after ingestion of 74Se (in sodium selenite form). Journal of Inorganic Biochemistry 55, 157-163.
Ducros, V., Ruffieux, D., Belin, N. & Favier, A. (1994b). Comparison of two digestion methods for the
determination of selenium in biological samples. Analyst 119, 1715-1717.
Gunzler, W. A., Kremers, H. & Flohe, L. (1974). An improved coupled test procedure for glutathione peroxidase
in blood. Zeitschrif f i r Klinische Chemistry und Klinische Biochemistry 12, 444-448.
Hercberg, S., Preziosi, P., Galan, P., Deheeger, M., Papoz, L. & Dupin, H. (1991). Apports nutritionnels d'un tchantillon reprksentatif de la population de Val-de-Marne: 111. Les apports en mineraux et vitamines (Dietary
intake of a representative population sample in a district of Paris area (Val de Marne): In. Mineral and vitamin
intakes). Revue d'Epid6miologie et de S a d Publique 39, 245-261.
Hill, K. E. & Burk, R. F. (1994). Selenoprotein P - an extracellular protein containing multiple selenocysteines. In Selenium in Biology and Human Health, pp. 119-131 [R. F. Burk, editor]. New York Springer-Verlag.
Janghorbani, M., Kasper, L. J. & Young, V. R. (1984). Dynamics of selenite metabolism in young men: studies
with the stable isotope tracer method. American Journal of Clinical Nutrition 40, 208-218.
Janghorbani, M., Martin, R. F., Kasper, L. J., Sun, X. F. & Young, V. R. (1990). The selenite-exchangeable
metabolic pool in humans: a new concept for the assessment of selenium status. American Journal of Clinical
Nutrition 51, 6 7 M 7 7 .
Keller, H. H. (1993). Malnutrition in institutionalized elderly: how and why? Journal ofthe American Geriatric
Society 41, 1212-1218.
Lamand, M., Tressol, J. C. & Bellanger, J. (1994). The mineral and trace element composition in French food
items and intake levels in France. Journal of Trace Elements and Electrolytes in Health and Diseases 8, 195-
202.
Magos, L., Clarkson, T. W., Sparrow, S. & Hudson, A. R. (1987). Comparison of the protection given by
selenite, selenomethionine and biological selenium against the renotoxicity of mercury. Archives of
Toxicology 60, 422426.
Martin, R. F., Janghorbani, M. & Young, V. R. (1989). Experimental selenium restriction in healthy adult
humans: changes in selenium metabolism studied with stable-isotope methodology. American Journal of
Clinical Nutrition 49, 854-861.
National Research Council (1989). Recommended Dietary Allowances, 10th ed. Washington, DC: National
Academy Press. 199-204.
396 V. DUCROS E T A L .
Patterson, B. H., Levander, 0. A,, Helzlsouer, K., McAdam, P. A,, Lewis, S. A., Taylor, P. R., Veillon, C. & Zech, L. A. (1989). Human selenite metabolism: a kinetic model. American Journal of Physiology 257, R556- R567.
Pelus, E., Amaud, J., Ducros, V., Faure, H., Favier, A. & Roussel, A. M. (1994). Trace element (Cu, Zn, Fe, Mn, Se) intakes of a group of French men using duplicate diet technique. International Journal of Food Sciences and Nutrition 45, 63-70.
Peretz, A., Nkve, J., Desmedt, J., Duchateau, J., Dramaix, M. & Famaey, J. P. (1991). Lymphocyte response is enhanced by supplementation of elderly subjects with selenium-enriched yeast. American Journal of Clinical Nutrition 53, 1323-1328.
Rotruck, J., Pope, A., Ganther, A., Swanson, A,, Hafeman, D. & Hoekstra, W. (1973). Selenium: biochemical role as a component of glutathione peroxidase. Science 179, 588-590.
Sahyoun, N. R., Octradovec, C. L., Hartz, S. C., Jacob, R. A,, Peters, H., Russell, R. M. & McGandy, R. B. (1988). Dietary intakes and biochemical indicators of nutritional status in an elderly, institutionalized population. American Journal of Clinical Nutrition 47, 524-533.
Sandstead, H. H. & Henrisksen, L. K. (1982). Zinc nutriture in the elderly in relation to taste acuity, immune response, and wound healing. American Journal of Clinical Nutrition 36, 10461049.
Schroeder, H. A., Frost, D. V. & Balassa, J. J. (1970). Essential trace metals in man: selenium. Journal of Chronic Diseases 23, 227-243.
Simonoff, M. & Simonoff, G. (1991). LR S6lbium et la Vie. Paris: Masson.
Stacchini, A,, Coni, E., Baldini, M., Beccaloni, E. & Caroli, S. (1989). Selenium intake with diet in Italy: a pilot study. Journal of Trace Elements and Electrolytes in Health and Diseases 3, 193-198.
Stewart, R. D. H., Griffiths, N. M., Thomson, C. D. & Robinson, M. F. (1978). Quantitative selenium metabolism in normal New Zealand women. British Journal of Nutrition 40, 45-54.
Swanson, C. A,, Patterson, B. H., Levander, 0. A., Veillon, C., Taylor, P. R., Helzlsouer, K., McAdam, P. A. & Zech, L. A. (1991). Human [74Se] selenomethionine metabolism: a kinetic model. American Journal of Clinical Nutrition 54, 917-926.
Thomson, C. D. & Stewart, R. D. H. (1974). The metabolism of ['?3e] selenite in young women. British Journal of Nutrition 32, 47-57.
Volkert, D., Kruse, W., Oster, P. & Schlierf, G. (1992). Malnutrition in geriatric patients: diagnostic and prognostic significance of nutritional parameters. Annals of Nutrition and Metabolism 36, 97-1 12.