A Case Study of Human Factors Evaluation in Aircraft
System Certification
by
Eric S. Whitman
Submitted to the System Design and Management Program in Partial Fulfillment of the Requirements for the Degree of
Master of Science in Engineering and Management
at the
Massachusetts Institute of Technology February 2002
2002 Eric S. Whitman All rights reserved
The author hereby grants to MIT permission to reproduce and to
distribute publicly paper and electronic copies of this thesis document in whole or in part.
Signature of Author
Eric S. Whitman System Design and Management Program February 2002
Certified by
James Kuchar Thesis Supervisor Associate Professor of Aeronautics as Astronautics
Accepted by
Steven D. Eppinger Co-Director, LFM/SDM GM LFM Professor of Management Science and Engineering Systems
Accepted by
Paul A. Lagace Co-Director, LFM/SDM Professor of Aeronautics & Astronautics and Engineering Systems
MASSACHUSETTS INSTITUTE
OF TECHNOLOGY
JUL 1 8 2002
A Case Study of Human Factors Evaluation in Aircraft
System Certification
A
Case
Study of Human Factors Evaluation in
Aircraft System Certification
by
Eric S. Whitman
Submitted to the System Design and Management Program on January 11, 2002 in Partial Fulfillment of the
Requirements for the Degree of
Master of Science in Engineering and Management
ABSTRACT
A human factors evaluation was performed on a privately developed Multi-Function Display (MFD) intended for use in general aviation aircraft. The MFD was at the end of its product development process and the parent company was pursuing its flight certification with the Federal Aviation Administration. The new MFD is a large departure from the current industry design standard for these devices. The new design, it is hoped, would markedly improve pilot situational awareness and reduce the cockpit workload in general aviation aircraft.
The evaluation was performed to understand the effect that the MFD's larger display area, improved graphics, and unique pilot interfaces, would have on reducing the time it takes for a pilot to find information valuable for in-flight planning. The evaluation showed a strong positive correlation between pilots using the MFD requiring nearly twice as much time on average to retrieve desired information than pilots using only a paper VFR Sectional. Pilots utilizing the MFD to locate and report specific information averaged 19 seconds per question to complete a task. The same questions answered with a VFR Sectional only required 11 seconds per question on average.
Additionally, pilots committed nearly twice as many total errors using the MFD (65% of all errors) than with the paper system (35% of all errors). The evaluation only considered tasks related to information discovery and retrieval and was not a comprehensive look at all of the MFD's known functionality. The conclusion was that poor human factors design unnecessarily encumbered detailed information retrieval.
Eight test subjects were analyzed while working with four separate flight plans to determine the cause of the disparities in both time and error and recommend ways for correction. Analysis of the human factors tradeoffs and the product development process resulted in recommendations affecting the organization, content, and structure of the MFD and its graphical displays. Primarily, the device requires an improved map interface for direct pilot interaction. Additional recommendations concerning the product development process of the company were included to improve the process and avoid similar mistakes in the future.
Thesis Supervisor: James Kuchar
Dedication
Table of Contents
A B STR A C T ...
2
D edication...3
T able of C ontents...4
T able of Figures ...
5
1. Introduction ...
7
1.1 General Aviation M ishaps ... 7
1.2 Hum an Factors and General Aviation... 8
1.3 M ultifunction Displays and Hum an Factor Engineering ... 10
1.4 Purpose... 13
2. B ackground ...
14
2.1 General Aviation N avigation ... 14
2.2 Avidyne FlightM ax EX5000... 17
2.3 EX 5000 Operation and Arrangem ent ... 19
2.3.1 EX 5000 Setup Page ... 21
2.3.2 EX5000 Checklist Page ... 25
2.3.3 EX5000 N earest Page ... 25
2.3.4 EX 5000 Trip Page... 27
2.3.5 EX 5000 M ap Page ... 29
3. Experim ental Study...
31
3.1 Scope... 31
3.2 Description Of The Test Device ... 33
3.3 Flight Plans and Sectionals ... 34
3.4 Counterbalancing ... 35
3.5 Subject Pool ... 35
3.6 Subject Instructions and Procedures ... 36
3.7 Flight Plans and Data Recording ... 38
3.7.1 Flight Plan A (Fam iliarization Flight) ... 39
3.7.2 Flight Plan B ... 43 3.7.3 Flight Plan C ... 45 3.7.4 Flight Plan D ... 47 3.7.5 Flight Plan E ... 50 3.8 Subjective Evaluations... 52 3.8.1 Cooper-Harper Evaluations ... 52 3.8.2 Subjective Questionnaires... 55
4. R esults
...
55
4.1 Summ ary of Events and Tim es ... 56
4.2 Summ ary of Event Tim es by Event Type ... 59
4.3 Subject Errors ... 62
4.4 Cooper Harper Results ... 67
4.5 Results Summ ary ... 69
5.0 R ecom m endations
...
71
5.1 Interactive M ap ... 72
5.2 Basic Recomm endations ... 74
5 .2 .1 ... 7 4 5.2.2 ... 74
5.2.3 ... 75
5.3 Page Recomm endations ... 76
5.3.1 Data Blocks ... 76
5.3.2 Trip Page ... 77
5.3.3 Nearest Page(s) ... 79
5.3.4 M ap Page ... 81
5.4 Avidyne Product Developm ent Process ... 84
6.0 C onclusion
...
85
A ppendices
...
87
Appendix A : M FD Displayed Flight Plans ... 87
Flight Plan B ... 87
Flight Plan C ... 88
Flight Plan D ... 89
Flight Plan E ... 90
Appendix B: Evaluator Crib Sheets ... 91
Flight Plan A Fam iliarization DirectionsFlight Plan A ... 91
Flight Plan A ... 92
Flight Plan B ... 93
Flight Plan C ... 94
Flight Plan D ... 95
Flight Plan E ... 96
Appendix C: Sub ective Evaluations ... 97
Table of Figures
Figure 2. 1: Sample VFR Sectional ... 15Figure 2.2: Hand Held GPS- Garmin GPS III Pilot ... 16
Figure 2.4: EX5000C in Cirrus SR-22 Cockpit ... 19
Figure 2.5: EX5000C Bezel... 20
Figure 2.6: Setup Page ... 21
Figure 2.7: Airport Filter Page ... 22
Figure 2.8: Declutter Setup Page... 23
Figure 2.9: Data Block Edit Page ... 24
Figure 2.10: Nearest Page... 26
Figure 2.11: Airport Information Page- KMCO Orlando International Airport ... 26
Figure 2.12: Trip Page ... 27
Figure 2.13: Garm in GN S 430- Panel Flight M anagement System ... 28
Figure 2.14: M ap Page- Flight Plan A ... 29
Figure 3.1: Counterbalancing M atrix... 35
Figure 3.2: Default Data Block Settings ... 40
Figure 3.3: Summary of the Modified Cooper-Harper Flight Plan Tasks... 53
Figure 3.4: Sample M odified Cooper-Harper Scale ... 54
Figure 4.1: Total Event Times ... 57
Figure 4.2: Average Event Times... 57
Figure 4.3: Event Time Sum mary- M FD and Sectional ... 58
Figure 4.4: Event Summary by Type ... 60
Figure 4.5: Summary of Event Time by Type ... 61
Figure 4.6: Average Time per Event by Type ... 61
Figure 4.7: Percentage of Incorrect Answers by Resource ... 62
Figure 4.8: M FD Error distribution... 63
Figure 4.9: Errors by Type and Resource... 64
Figure 4.10: Average Course Estimation Error... 66
Figure 4.11: Average Distance Estimation Error ... 66
Figure 4.12: Cooper Harper Scores Summary ... 67
Figure 4.13: Cooper Harper Sectional Histogram ... 68
Figure 4.14: Cooper Harper M FD Histogram ... 68
1. Introduction
1.1 General Aviation Mishaps
In August of 2001, the United States General Accounting Office (GAO) reported to Congress that across the entire spectrum of aircraft, the mishap rate for all civil aircraft not flown by commercial airlines or the military is 24 times higher than the accident rate for commercial aircraft (GAO, 2001). This portion of the domestic aviation fleet is known as general aviation (GA) and accounts for three out of every four takeoffs and landings in the United States. The General Accounting Office further explained that the disparity between general aviation and commercial aircraft could be attributed to a variety of factors. Of particular note, however, is the finding that over "two-thirds of the general aviation aircrafts mishaps, both fatal and non-fatal, are caused by pilot error" (GAO, 2001). Pilot error can include mistakes related to procedure, skill, and judgment and can be both exacerbated and/or mitigated by how well pilots interact with the electronic and mechanical systems they manipulate to safely fly an aircraft.
Different segments of the general aviation community, however, have widely varying mishap rates. For example the corporate flying segment uses almost exclusively turbine aircraft and accounts for 10 percent of the total general aviation hours but only one percent of the fatal accidents. Conversely, the personal flying segment, populated by persons who fly for pleasure or personal transportation and not for business, comprised about one-third of total general aviation hours flown in 1998 but accounted for over three-quarters of the fatal accidents. The disparities are attributed to "differences in pilot experience and safety equipment installed" (GAO, 2001).
The modem aviation industry recognizes that there exists a large opportunity to compensate for both of these factors through advanced technologies that can potentially affect
both aircraft flying characteristics as well as a pilot's decision making ability. Perhaps the most significant recent technological advance to impact the pilot in the cockpit was the coming of age of the Global Positioning System (GPS) and the development of cheap, hand held devices to bring precise position information immediately to the pilot in the cockpit. Initially, this technology allowed pilots and early adopters to exactly plot their positions on paper sectionals and other plotting devices. As technology has advanced, the hand held device is giving way to fully integrated systems that can couple built-in databases of terrain maps, geography,
topography, local traffic, weather and anything else that can be imagined and associated with the GPS data to provide real-time, pilot manipulated, moving maps filled with data for pilots to use as they see fit. The real challenge in today's environment is to determine the best way to gather, display, disseminate, and interact with the immense amount of data that is now at the pilots' very fingertips.
1.2 Human Factors and General Aviation
Human factors (HF) engineering attempts to understand the strengths and limitations of human beings and then apply this knowledge to the machine interfaces that we must deal with on a daily basis. Originally, human factors research examined the interactions of humans with very specific devices. It has since expanded to cover an ever-broadening scope of engineering
disciplines, behavioral sciences, and human-machine interactions. Within the field of aviation, ever since Wilbur Wright chose the canard configuration for the first powered flyer because, among other reasons, he thought it was comforting to see the control surface during flight (Culick, 2001), engineers have been looking for ways to improve the way pilots, crew members, passengers, and now air traffic controllers and even ground personnel interact with aircraft and each other. The aviation human factors sciences cover everything from cushions and seat design,
to control interfaces, to cockpit crew interactions, and lately to information handling and cockpit displays.
As aircraft have become more complex, the FAA has become increasingly cognizant of the need to monitor and even regulate the ways in which aircraft meet certain human factors considerations. The FAA already tightly controls the criteria for determining an aircraft's suitability for flight through a comprehensive and meticulous certification process. Any aircraft or aircraft system slated for flight in US airspace must demonstrate compliance with criteria as established by the FAA before it is permitted to take to the skies. As aircraft are improved, systems are upgraded, or new systems are developed, the same flight certification process must be completed in whole or in part before the new or changed elements may be incorporated, let alone widely sold, for use in domestic aircraft. However, the dynamic and fast paced nature of technological evolution has made it extremely difficult for FAA regulations to keep pace. Particularly with regard to human factors, the result for today's manufacturers is a myriad of requirements and guidelines from multiple government and private agencies that are not only challenging to identify but can also be even harder to implement wisely. Indeed, FAA regulations rarely directly identify requirements as "human factors" related and a developer needs to thoroughly review a multitude of sources to determine their product's level of compliance.
In recent years, there has been independent effort to consolidate the human factors guidelines from all of the sources into a single working reference. The Human Factors Design Guide published by the US Department of Transportation and most recently updated in April 2001 makes a Herculean effort to review all of the current and relevant material regarding human factors best practices and requirements and then summarize this information in a user friendly
format (Department of Transportation, 2001). The most recently developed and most often requested update concerns the issue of computer-human interfaces. As may be suspected, the rapid technological advancements in the area of computer software, graphical interfaces, and associated hardware improvements have enabled an enormous wealth of information to be pumped into the cockpit from various sources, in different formats, and with a wide range of usability and applicability issues associated with it. The commercial airlines have always had high-tech cockpits and the first electronic display units were introduced to this industry as early
as the 1970s. However, the presence of electronic display units, now evolved into what is now known as multifunction displays (MFDs), have increased their functionality while becoming relatively affordable and thus enabling them to become more common in the general aviation market as well.
1.3 Multifunction Displays and Human Factor Engineering
Multifunction displays serve a variety of functions. Remembering that the most common cause of mishaps for general aviation aircraft is related pilot experience and safety equipment installed on a particular aircraft, the focus of many modern MFDs is to enhance the pilot's understanding of his environment. MFDs receive information from a variety of sources and then will attempt to layer that information onto a single display unit. For example, most current MFDs receive position information supplied by the GPS satellite network and then map that information onto an onboard database of information that can include such things as geo-political boundaries, controlled or special use airspace boundaries, VFR airways, airport positions,
obstacles and other fixed items that may be of interest to pilots. More advanced MFDs can also overlay local generated RADAR returns and traffic and weather information. The intent is to keep a pilot's focus on one display that has all information that will be useful during a flight. By
consolidating and centralizing the information, MFDs hope to improve a pilot's situational awareness (SA) of their environment while simultaneously reducing their workload. Instead of having to learn how to read and interact with several different pieces of equipment that may gather useful information, an MFD enables a pilot to see and manipulate all of that same
information through a single display. Typically, the information is "layered" on a display screen that allows a pilot to add or remove items they are interested in seeing. For example, a pilot may wish to see controlled airspace information and local obstacles but perhaps not at the same time on the same display. The ability to customize the display to fit a user's needs is critical as the potential information density typically far exceeds the viewing area available on an MFD display. An MFD is then continually updated with new GPS position and other information to provide a real time snapshot of the pilot's environment.
As may be expected, developers have put forth a myriad of formats to present the information on their MFD and an equal number of methods for a pilot to interface with the device. Modem MFDs provide operators with control through pilot initiated filtering of information as well control of the level of detail that will be seen next to the selected
information. It is not hard to imagine that as computing power and display capabilities improve, the volume of information that can be presented can quickly outpace the pilot's ability to process and understand it. An important aspect of any human factors consideration of an MFD is to understand the usability of the device on this most basic level. It is not difficult through poor design for the information to become muddled and confusing as well as extremely difficult to manipulate and configure. In the worst case, information overload, a poor display, or difficult user interface can have exactly the opposite effect the MFD is intended to have. A poor display can actually decrease pilot situational awareness while increasing their workload. As developers
attempt to address the general aviation mishap rate that is dominated by pilot error as the primary cause, it is important that the information solutions do not add to the problem by permitting the displayed information or the pilot's ability to interface with the display device to become compromised.
The technology explosion and myriad of design solutions for information presentation have led to an unquestioned need for standardization as well as a clear understanding of human factors considerations when designing MFDs. Not surprisingly, the aviation industry has responded with a wealth of new research into exactly these fields. In September 2001, the Department of Transportation released a study based on a review of research and literature specific to the design of aircraft multi-function displays (Department of Transportation, 2001). The report, aptly named Human Factors Design Guidelines for Multifunction Displays,
systematically reports on the various aspects of MFD design for usability and the recommended best practices for designers therein. The report identifies what works for pilots and other end-users from a strictly functional perspective. The guide does not cite FAA certification
requirements in its best practices but nonetheless it is possible to combine the guidance in this report with the FAA and other government regulations identified in the Human Factors Design
Guide noted earlier to draw a more complete picture. What has become very clear after a lengthy literature review is that while human factors consideration must be imbedded in all good engineering, there exists no comprehensive list of absolute HF requirements. Moreover, it is more likely that it is impossible to even create one. Human factors engineering is not an exact science per se, but more an analysis of tradeoffs. It is not realistic to believe a single checklist could provide the precise guidance a designer needs to build the perfectly designed system for human factors considerations. This point is raised now to make it clear that ultimately it will be
the user who will be the final arbiter of whether a product is really "useful" or not. Ed Crawley, Department Head of Aeronautics and Astronautics at the Massachusetts Institute of Technology, identifies a component he labels "elegance" to describe truly exceptional systems engineering (Crawley, 2000). An elegant design is one that appeals on all levels of the users needs, aesthetic to practical. It is my belief that the realm of human factors engineering is the one area where engineers attempt to directly handle the issue of elegance. The trade-offs that are evaluated for human factors speak directly to the elegance of the design as much as to its real usefulness to a user.
1.4 Purpose
Human factors considerations should be imbedded in all aspects of the product development process. Often, however, human factors considerations are the last thing on a developer's mind. Particularly for the first version of a product line, internal or external deadlines or simple monetary issues can often drive the developer's priorities. Human factors concerns are often not carefully analyzed or understood until a problem arises requiring a design change to achieve at least the minimal usability requirement. In the following thesis, I will
examine the Avidyne Corporation's newest MFD for general aviation aircraft and their associated product development process. The context of the examination will be the human factors requirements for MFDs in the general aviation market. The purpose of the final evaluation is to understand the human factors tradeoffs Avidyne needs to consider when
designing an MFD, the strengths and/or weaknesses of their design effort through an analysis of their EX5000C MFD, and to assess the results of the analysis as an impact on their product development process. More specifically, The Avidyne Corporation in Lincoln, Massachusetts has developed the EX5000 MFD for use in general aviation aircraft and understands the implicit
need for a human factors analysis of their new component. Avidyne has voluntarily decided to initiate an HF test and evaluation program for the MFD to support it in its FAA certification as well as to enhance its market appeal. This thesis will evaluate, analyze, and capture the relative elegance of the EX5000 for use by the general aviation community and thereby assess the relative success of the human factors aspects of the Avidyne product development process.
2. Background
2.1 General Aviation Navigation
General aviation pilots are as varied in their reasons for flying as they are in their means of figuring out the safest and fastest way to get around. GA pilots can fly using Instrument Flight Rules (IFR) or Visual Flight Rules (VFR). All pilots learn to fly VFR and with experience and practice, some will move on to earn an instrument rating. VFR flight requires the pilot to have constant reference to the actual horizon with the pilot's eyes. To fly IFR requires the pilot to have formal instrument flight training that may then lead to an Instrument Pilot Rating. Instrument rated pilots have learned how to fly and navigate their aircraft using only cockpit instruments and without requiring visual reference to the outside environment. The instrument rated pilot can take their aircraft into the clouds so to speak and then navigate and fly with only reference to the instruments in their aircraft. A pilot flying IFR is under constant supervision and control from ground based air traffic controllers and the pilot will supplement his or her
navigation with special IFR charts and other devices. For the VFR pilot, however, aircraft navigation is handled through a spectrum of very simple to very high-tech devices.
On the low technology side, many pilots will navigate in much the same way a person navigates in their car. In fact, some will use roads or other known landmarks as their primary
references to move from point A to B. Of course, the advantage of flying is that a person can travel greater distances much faster than in a car so it is not difficult to rapidly out-fly a pilot's internal list of known landmarks. Most pilots will then turn to the FAA issued pilot's VFR Sectional. The VFR Sectional, or simply "Sectional" as it is referred to by pilots, is essentially a pilot friendly map. It can include much of the same information available to in a normal road atlas, but it magnifies the information of importance to a pilot. Obvious things such as airfields, restricted airspace, in flight obstacles and other landmarks that will be visible from the sky that may never be seen from a car are readily visible on a sectional. The legend on a VFR Sectional contains over 110 different types of symbology. All VFR pilots will receive some training on the use of a sectional prior to receiving their private pilot's license. With a sectional in hand, any pilot should be able to execute a VFR flight even into unknown areas. A section of a VFR
sectional from the Daytona Beach, FL area is shown in Figure 2.1 below.
F 2:FR a s ail! ~ 1110 fa n oil Z~ u_.P V 'CI N A El ~~IWI
The next level of technology for VFR navigation is the use of hand-held GPS devices. The market is flooded with these handheld computers and many have become quite adept at presenting pertinent and complex information in what is typically a very small display window. Common problems with handheld devices are the small viewing area coupled with the deeply layered information interfaces that require significant mental effort to use for more than the simplest of tasks. Nonetheless, the information these types of devices provide can be quite detailed and they have attracted a supportive and devoted customer base. For the most common GA flying, the personal non-business flyer, a hand-held GPS seems a reasonable financial investment for the level of usability they provide. A popular model, the GPS III Pilot manufactured by the Garmin Corporation is shown in Figure 2.2 below.
Figure 2.2: Hand Held GPS- Garmin GPS 1II Pilot
Figure 2.2 is representative of the most common kind of hand held GPS receiver in use in the GA market today.
For high technology integrated systems, the GA community also uses multi-function displays. Within the GA market, MFDs have typically been reserved for expensive corporate or business type aircraft. These aircraft can bury the historically high cost of an MFD in the overall cost of the aircraft without too much difficulty. Moreover, these aircraft typically travel greater distances more often and into dense population areas where the extra MFD functionality seems
better suited. However, there is a push in the avionics industry to bring the cost of the high-tech MFDs down into the realm of the smaller GA aircraft and allow users to leverage the full advantages of an integrated system. New GA aircraft manufacturers across the entire range of aircraft are building MFDs into their designs from the beginning. Avionics manufactures like Garmin, Barcoview, Honeywell, Bendix, Avionics West, and Avidyne among others are all competing for this new market. MFDs differ from VFR Sectionals and hand-held GPS devices on a number of levels. Perhaps the most obvious is that they are integrated with the rest of the aircraft avionics and instrumentation suite. An MFD can be used to provide map information
similar to a VFR sectional coupled with GPS like a hand-held device, but they are also used for engine monitoring and diagnostics, providing an electronic checklist, as well as integrating weather, radar, and traffic information from multiple sources into a single display. MFDs will
attempt to consolidate all (or as much as possible) of the digital information in a cockpit from multiple sources into a single display unit. A single point of information retrieval, it is hoped, will then enhance a pilot's situational awareness and reduce their workload.
2.2 Avidyne FlightMax EX5000
The Avidyne Corporation of Lincoln, Massachusetts has spent the past two years developing the EX5000C MFD for the general aviation market. Introduced formally to the general aviation community at the annual Aircraft Owners and Pilots Association (AOPA) Exposition in November of 2001, the EX5000 is the Avidyne Corporation's attempt to raise the industry standard for MFDs well above current industry products. Originally conceived as a follow-up to their Flight Max line of MFDs, with the key feature improvement being the larger glass display area, the EX5000 has gone farther and represents a large step from the company's earlier products.
Simply put, the EX5000 MFD is an integrated electronic display that, among other things, combines the functions of a real-time moving map; electronic checklists, traffic and weather advisories, and flight plans are overlaid into a single display. A quick survey of multi-function display devices in the General Aviation (GA) market reveals a market saturated with devices purporting to have the same basic functionality as the Avidyne model. The Avidyne MFD becomes unique and quickly distinguishable from any other model on the market by the
sheer size of its display. The Avidyne MFD liquid crystal display (LCD) measures a relatively enormous 6.25 inches by 8.5 inches (10.4 inch diagonal) for a total viewing area of over 53 square inches. Current models generally vary from around a three-inch diagonal display up to over six inches of diagonal display. Only one other model matches the EX5000 in display size but lacks the matching screen resolution, thus making it appear less sophisticated.
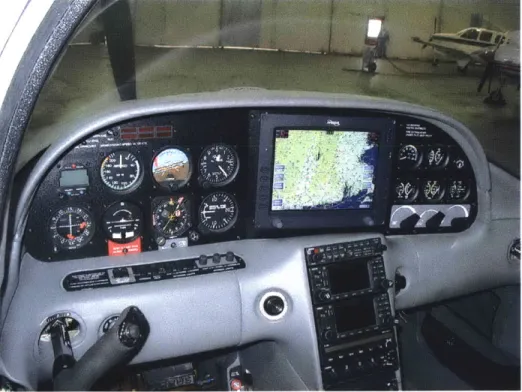
Since its debut at the AOPA Exposition, Avidyne has contracted with several aircraft manufactures to integrate the EX5000 into their product lines. Most notably, the first widespread use of the EX5000C will be in the all new Cirrus SR22 and will be back-fitted into the older model Cirrus SR20 GA aircraft (Figure 2.3). Cirrus Corporation aircraft will be the first
widespread users of the EX5000 (Figure 2.4) so it is important to Avidyne that the MFD is seen as a resounding success with their pilots. The Cirrus philosophy on GA as described on their corporate home page states, "A Cirrus is a personal aircraft that can be used for more than recreation, it represents a reasonable transportation alternative." In terms of the GA aircraft community, Cirrus seems to be trying to fill in the gap between the weekend flyer and the business flyer. It seems clear that at least in the near term the EX5000C will have demands that fall across a broad spectrum of GA needs.
Figure 2.3: Cirrus SR-22 Aircraft
Figure 2.4: EX5000C in Cirrus SR-22 Cockpit
2.3 EX5000 Operation and Arrangement
Before any work can be accomplished evaluating the EX5000, it is important to
understand its basic layout, functional interfaces, and general capabilities. For purposes of this thesis, it is not critical to have a detailed understanding of all of the available functionality of the EX5000. The EX5000 allows for a multitude of pilot controlled settings and inputs that will not
be dealt with in this evaluation. For a comprehensive explanation of the EX5000 an interested party should review the Pilot's Guide in its entirety (FlightMax EX5000C, 2001).
The EX5000 MFD consists of a metal bezel framing a liquid crystal display (LCD) that measures 6.25 inches tall by 8.5 inches wide (Figure 2.5 below).
4
4
3
2 Figure 2.5: EX5000C Bezel 2
Integrated into the left and right sides of the metal frame are five backlit push buttons used for making pilot inputs (Item 1, Figure 2.5). The bottom edge of the metal frame has two raster-type knobs located at the left and right bottom corners respectively (Item 2, Figure 2.5). The Avidyne logo appears across the top edge.
The box functions are organized around five core "page" options. These core pages represent the highest level of the function selections and are referred to as the Map, Trip, Nearest, Checklist, and Setup pages. The core pages are identified on the LCD display in a line along the bottom left corner of the display (Item 3, Figure 2.5) with the labels "Map", "Trip", "Nrst", "Chklst", and "Setup". The different core pages can be selected by turning the lower left
raster knob and the current core page will have its identifier backlit turquoise. On each core page (and subsequent lower page levels) the purpose of the five buttons along each side of the MFD is displayed inboard of the button in its corresponding function boxes (Item 4, Figure 2.5). The function boxes will describe a new page that will be displayed or the action that will occur when the respective button is depressed. At times, a button may not have a function assigned to it in which case there will be no function box on the display screen near it.
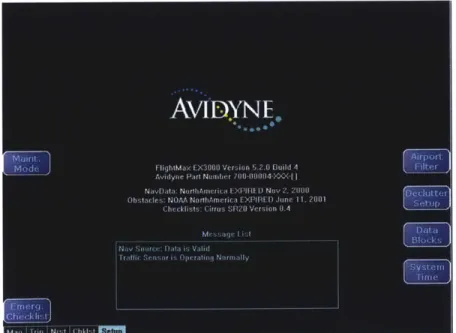
2.3.1 EX5000 Setup Page
Turning the lower left raster knob all the way to the right will take go the Setup core page (Figure 2.6). From the Setup page a user can, among other things perform maintenance tests as well as configure the MFD to the type of aircraft. On the top right side of the page are three functions labeled from top to bottom "Airport Filter", "Declutter Setup", and "Data Block Edit", respectively. Pressing the button immediately to the right of the function box will bring the user to the corresponding page.
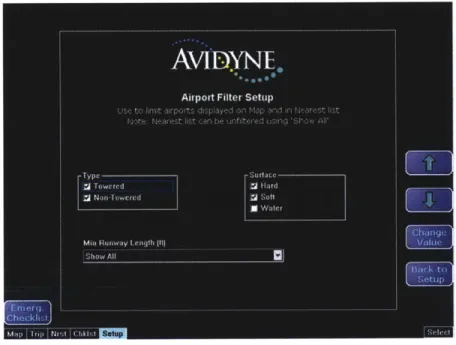
The Airport Filter page (Figure 2.7) allows a user to configure what types of airfield will be displayed on the core "Map" page. A user can filter airport by type ("Towered,
Non-Towered), surface ("Hard", "Soft", "Water") and runway length. The various fields on the page can be selected using the arrows buttons or the right raster knob. Changes to a field are made using the "Change Value" function button. Each push will advance the user through a change option. There is no display of all available options visible at any time.
AVI
DYNE
Airpoit Filter Setup
Figure 2.7: Airport Filter Page
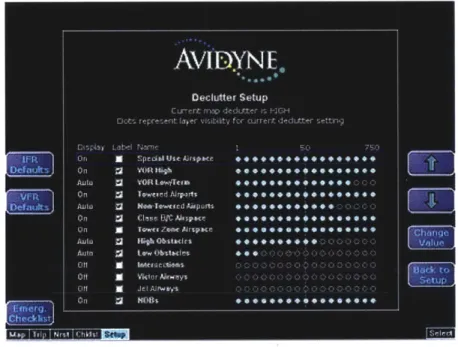
The Declutter Setup page (Figure 2.8) allows a user to configure the type and manner in which certain map symbology will be displayed. There are 13 categories of information that a user can manipulate. Again the right raster can be used to move rapidly through rows or the arrow key functions serve the same purpose. The type of map information that can be manipulated is shown in the third column. Only the first two columns can be changed. The first column is titled "Display" and has three options. A line item that has its display set to "Auto" will appear on the map based on the relative amount of clutter already on the map and the priority the computer displays to this particular set of information. The line item information may or may not be
displayed depending on these particular declutter settings implemented by the user and the MFD's preset priorities. The determination is automatic, hence the name. The second Display option is "On". This means that the particular line item will appear regardless of clutter. It may be overwritten based again on preset computer priorities but in most cases, the information should be visible. The final setting is "Off' in which case the line item will not be displayed on the map at all.
Figure 2.8: Declutter Setup Page
The second column is titled "Label". When the Label box is check marked,
alphanumeric information will appear near the map symbology as amplifying information. The exact information is unknown until the user goes back to the map page to see the changes. For example, selecting Label check marked for Class B/C airspace will result in the floor and ceiling restrictions for the controlled airspace to appear near or within the airspace boundaries.
The Fourth column describes the range scales at which the desired information will be displayed. A cyan filled bubble means that the corresponding information will be displayed at that
particular range scale on the Map core page. The dashed vertical line going through all rows shows the current range scale selected on the Map core page.
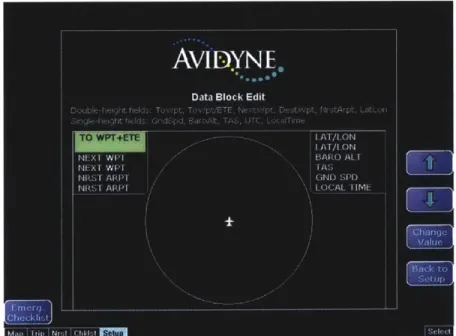
The "Data Block Edit" page (Figure 2.9) allows the user to configure the nature of the information that may be displayed in the data blocks visible in the top corners of the core "Map" page. Available Data blocks can be set to display the range, bearing and estimated time enroute (ETE) to the nearest waypoint, range and bearing to the next waypoint, range and bearing to the nearest airport, local time, Latitude and Longitude, Universal Time Clock, ground speed, altitude
and indicated airspeed. Several of these options will take two of the six lines in a data block. Since only 12 lines are available (6 per data block) not all of the possible information can be selected for display at one time. There is no default setting for the data blocks.
Data Block Edit
Figure 2.9: Data Block Edit Page
2.3.2 EX5000 Checklist Page
The Checklist core page is labeled "Chklst" on the main display and is sequentially located next to the "Setup" core page. Selection of this page will bring the user to an interactive electronic checklist. The checklists are organized by normal procedures and emergency procedures. The checklists are aircraft unique and also contain performance data for the aircraft.
2.3.3 EX5000 Nearest Page
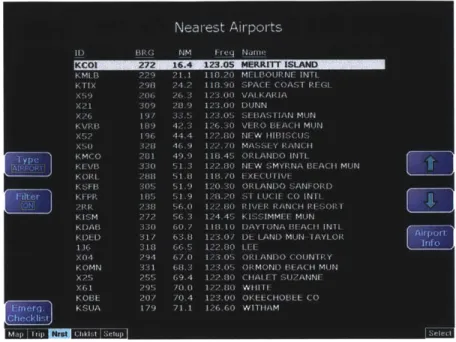
The Nearest page is labeled "Nrst" on the main display and is in the third position sequentially among the five core pages (Figure 2.10). Rotation of the left raster to this position will bring a core page titled "Nearest Airports" to the display. Airport information is arrange in five
columns titled "ID", "BRG", "NM", "FREQ", "NAME", which corresponds to the airport three or four letter unique airport identifier, bearing from the aircraft present position, distance in nautical miles to the airport from the aircraft present position, the frequency of the primary
control frequency (Note: the frequency could be a common traffic advisory (CTAF) or universal communication frequency (UNICOM) in cases of non-tower controlled airports), and the full name of the airport respectively. Airport rows can be scrolled through using either the arrow push buttons or the right raster knob.
Figure 2.10: Nearest Page
Selection of the "Airport Info" push button will bring up a more detailed page of information on the currently selected airport row (Figure 2.11).
Figure 2.11: Airport Information Page- KMCO Orlando International Airport
Referring back to Figure 2.10, the top function key on the left side has a primary label of "Type" and a subtitle with a green outline that says "AIRPORT". The green outlined "AIRPORT" indicates
the current type of nearest information being displayed. Selection of the "Type" push button will move the display through a series of pages each with different nearest information. The green outlined subtitle will change to the current information type being displayed. A page is
dedicated to nearest VOR navigation aids, obstacles, intersections, and non-directional beacons. Each of these pages has the same range, bearing, frequency (not the obstacle or intersection page), and name (not obstacle) columns visible. The obstacle page has a column for the height of the nearest obstacle as well. No further amplifying information is available to the user on these subsequent pages.
2.3.4 EX5000 Trip Page
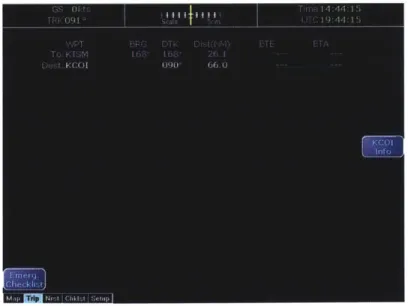
Rotating the left raster to highlight "Trip" in the second position along the bottom left corner of the primary display will bring a core page similar in appearance to Figure 2.12.
Figure 2.12: Trip Page
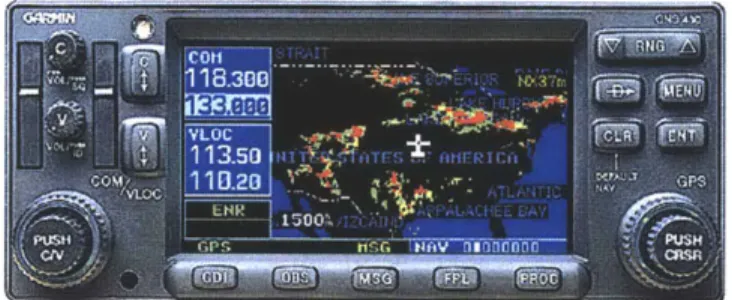
This page will display the aircraft's current position relative to the active flight plan. The flight plan itself is entered from a separate device. In the case of the Cirrus SR22, the device is a Garmin GNS 430 (Figure 2.13). The GNS 430 also provides the real time GPS data the MFD
needs to orient its own map and is also where a pilot will input a desired flight plan for display on the EX5000. On a separate note, it is also an excellent example of a small screen MFD-like device available to the GA market.
Figure 2.13: Garmin GNS 430- Panel Flight Management System
Referring again to Figure 2.12, the Trip core page provides the user with information relative to the aircraft's current position in the flight plan. Multiple waypoints may be entered for a
proposed flight path that will then appear on the Trip page. In Figure 2.12, three waypoints were entered and the first one had already been reached at the time of the screen capture. Once a waypoint is reached, the MFD will drop the leg information from the display until upon
completion of the flight there are no legs displayed on the page. The MFD highlights in magenta data relating to the current leg of the flight and all subsequent leg data is displayed in white. Each waypoint also includes information regarding its current bearing and, for the active leg, the current distance from the aircraft, ETE and estimated time of arrival (ETA) in local time. The distance, ETE and ETA listed on subsequent legs is the cumulative value to get to that point. Additionally, a desired track (DTK) is listed to reach each waypoint and a course deviation indicator (CDI) is included at the top center of the screen to show the range of deviation from the desired track. The current track is listed in the top left corner labeled "TRK" and located
just
beneath the current GPS computed groundspeed labeled (GS). The top right corner contains local and UTC time. None of the fields in the top corners can be altered. Airport information
about the final destination airfield is available using the right function key labeled with the destination airfield identifier and the word "Info". Intermediate airfield information cannot be accessed through this page.
2.3.5 EX5000 Map Page
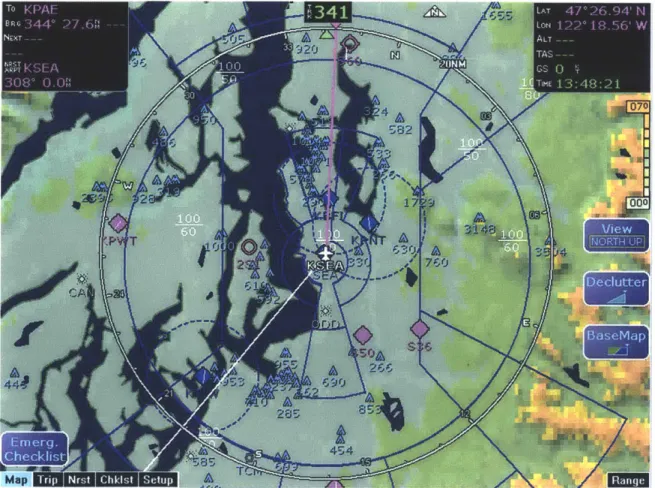
The "Map" page is visible in the first position along the bottom left corner of the primary display. Highlighting this core page will result in a map display that is the real heart of the MFD. Earlier descriptions of the other core pages were all centered on enhancing the user's understanding of what is displayed on the map page. Figure 2.14 is sample of a map page with a flight plan overlay that was also used to explain map features to the test subjects described later in the thesis. Figure 2.14 is Flight Plan A from the test plan.
The map page contains a wealth of information. Like the VFR sectional, topographic elevations are depicted with color with a supporting legend under the right data block. Also similar to a sectional, airport locations with some distinction by type, controlled and special use airspace boundaries, obstacles and their elevations, runway orientation, controlled airspace altitude restrictions, and navigation aids are all visible. Additionally, an aircraft centered compass rose referenced to Magnetic North is visible that is also associated with the current map range. The current map scale is visible near the one o'clock position on the compass rose and can be increased or decreased by twisting the right raster knob. The MFD map can also declutter some of the map symbology by pressing the declutter push button. The small triangle beneath the word "Declutter" indicates the current level of declutter the map is showing. The triangle will become more and more empty with each push of the button and the removal of another type of map symbology. An empty triangle will leave a display showing only topographic and political boundary information. There is no indication on the screen of what data exactly drops off with each push of the button other than a user noticing an item that was previously visible now being missing from the display. Selection of the "BaseMap" push button will cause topographic and political features to drop off. Much like the "Declutter" triangle, the cube beneath the word "BaseMap" will become less filled with each push of the button. One push causes all
topographic information to disappear and the next causes all political and water boundaries to drop off. A third push resets the map to the full display configuration.
The map orientation is set using the "View" push button. The green outlined subtitle indicates the current map view and a small triangle also appears near the top of the display to indicate the map orientation. Users can select the "Heading/Track" or a "North" up views. In the Track/Heading up view the triangle will have either a "T" or "H" indicating track or heading
view respectively. In this view the map is oriented with the current aircraft heading or track being fixed to the 12:00 position. This causes the aircraft symbol to always point to the 12:00 position and the map appears to update or spin beneath the aircraft symbol. The heading/track up view can be further modified with the map being centered around the aircraft or in the "Forward" view where the aircraft is offset to near the bottom most edge of the screen and the map displays only the view forward of the aircraft. The North up view keeps the map oriented to true North while the compass rose always points to magnetic north. The aircraft symbol points in the direction of the aircraft heading and the map updates as the aircraft moves across it. The maps position over the land cannot be moved off of the aircraft centered or forward view positions. In other words, the map cannot be scrolled away from the aircraft position to see
something that may not appear within the current range scale. Additionally, there is no ability to select from this core page specific information visible on the map for amplifying information. Any amplifying information desired by the pilot will necessarily come from other MFD pages, VFR Sectionals or other cockpit resources.
3. Experimental Study
3.1 Scope
"Pilots... are highly trained and able people. Their behavior is organized and goal-directed, and they add knowledge to the information on an interface in two main cognitive activities; understanding what is happening, and working out what to do about it" (Bainbridge,
1999). The pilot's ability to understand what information is available to him and how to best retrieve the desired information is one of the first questions that must be answered when addressing the human factors issues of any display device.
It is not difficult to envision the EX5000 being used by pilots for purposes ranging from local sight seeing to long-range travel. The EX5000's first customers will be flying the Cirrus SR-20/SR-22 aircraft and the Cirrus vision for its aircraft appears to be moving toward covering
an entire spectrum of GA missions. At one end of the spectrum are the weekend flyers. These pilots may turn an eye to the weather, hop in their aircraft and fly VFR for their own recreational purposes. At the other end of the spectrum is the business flyer that regularly flies exact routes, greater distances, primarily under IFR, for business related purposes. Across the spectrum, the pilots will likely employ the EX5000C for some very similar purposes. At a minimum, all pilots flying VFR will likely try to use the device to identify airspace restrictions and to gather airport and other information along their proposed route of flight or proposed flying area. The
EX5000C is after all purported to first and foremost promote a pilot's situational awareness of their flight environment.
A test was designed to evaluate a potential GA pilot's ability to understand the display capabilities and user requirements for information retrieval using the Avidyne EX5000 MFD. The test evaluated a pilot's ability to find, determine, or interpret information that would be useful on a proposed VFR flight plan. A direct comparison was made for information retrieval from the MFD versus information retrieval using only a VFR Sectional. The VFR Sectional is used as the basis for the comparison as it is assumed to be commonly familiar with all GA pilots and also represents the realistic and most likely alternative to navigation in the aircraft in the event of the failure or inadequacy of the MFD. The questions were designed to be simple, straightforward and pertinent. The test uses a snapshot from the MFD to answer questions relating to all areas of the flight plan. The lack or presence of information in the particular MFD snapshots used during the test is not necessarily indicative of what the map would look like for a
pilot actually flying the flight plan. In flight, the map page updates rapidly and the display is relative to the aircraft position. This test is best suited for evaluating the elegance of the means for information retrieval, the quality of the information available, and the pilot's ability to use the MFD in lieu of a sectional. Results of the evaluation will be used to support or contrast
Avidyne's belief that the EX5000C MFD will promote pilot situational awareness and reduce workload. It should be noted that the Avidyne Corporation does not advocate using the MFD as the primary means of navigation nor does it possess the FAA certification to be employed in that capacity.
3.2
Description Of The Test Device
The human factors evaluation of the EX5000 MFD was originally conceived as an in-flight evaluation. Although never a serious option, it is obvious as the best configuration for performing a human factors evaluation. The secondary and primary plan was designed to take advantage of a static cockpit simulator being built by Avidyne to mirror as closely as possible as Cirrus SR22 cockpit. Eventually, time and technical difficulties prevented the cockpit from being functional and a third option to evaluate the MFD as a stand-alone device was pursued.
The evaluation of the EX5000C was accomplished using a stand-alone MFD receiving simulated GPS data from a Garmin GPS III Pilot hand held device (Figure 2.2). An EX5000C Version 5.2.0, Build 11 was used for the evaluation. The Jeppeson navigation data used by the EX5000 was valid through 27 Dec 2001. The MFD was set upon a tabletop and raised to near eye level with a cardboard box. Test subjects were able to adjust their seat to their desired viewing height as necessary. The EX5000C was not secured to the box or the table but the test subjects could manipulate single handedly all interfaces without the box sliding around. The evaluator sat to the right of the MFD and test subject and recorded data by hand on the desktop.
Events were timed manually using a computer clock and noting the current time in minutes and seconds for data recording. Test subjects were evaluated in a private area free from external distractions during the test and evaluation period.
As a dynamic simulation using the MFD was not possible, the proposed flight plans were inputted into the MFD and the aircraft position was centered at the center of the flight plan route. The same flight plans were marked on a VFR Sectional and the waypoints routes of flight were clearly marked without marking out information required during the test.
3.3 Flight Plans and Sectionals
The flight plans referenced throughout this test plan are characterized as having two legs with three waypoints. The flight plans were selected to represent a variety of different locations with diverse geographic and geo-political backgrounds. The waypoints are summarized below and associated graphics of the flight plans as seen by the test subjects on the MFD can be found in Appendix A.
Flight Plan A- Olympia (KOLM)- Seattle-Tacoma (KSEA)- Snohomish County (KPAE) Flight Plan B- Deland Municipal (KDED)-Orlando Sanford (KSFB)-Ormond Beach (KOMN) Flight Plan C- Herlong Airport (KHEG)-Jacksonville International (KJAX)-Fernandina Beach (55J)
Flight Plan D- Orlando Country (X04)- Kissimmee Muni. (KISM)- Merritt Island (KCOI) Flight Plan E- Portland International (KPDX)- Portland Hillsboro (KHIO)- Portland Troutdale (KTTD)
3.4 Counterbalancing
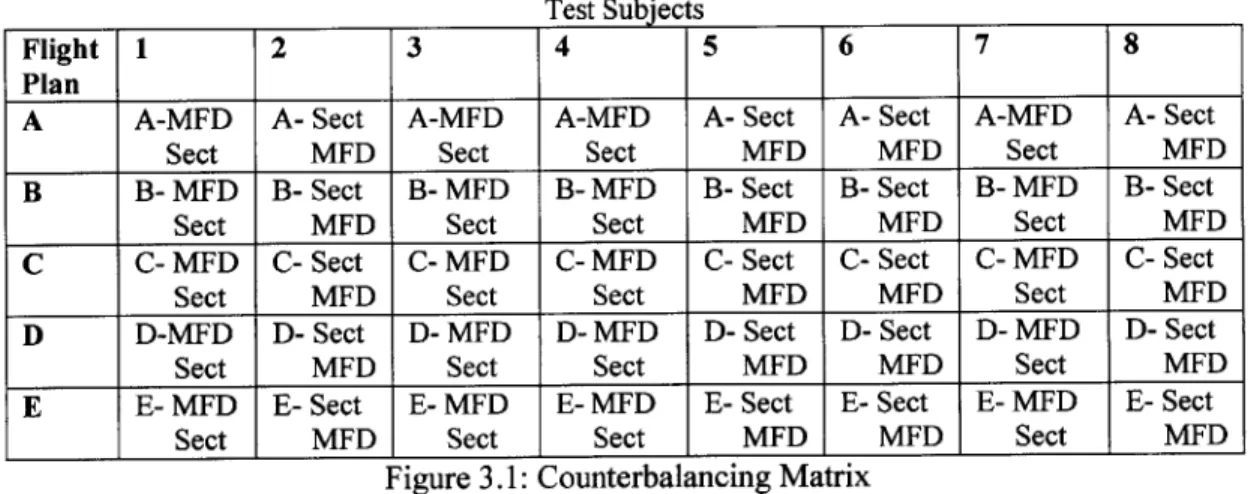
Counterbalancing of the experiment to account for learning, fatigue, and other order effects was implemented according to the schedule in Figure 3.1. Flight Plan A (Figure 2.14) was employed first as a common training tool for all participants in the experiment. Flight Plans B, C, D, and E were then executed in order. Execution of each flight plan was divided into two parts. In each part, the subject was required to determine his/her answers using either the MFD or VFR sectional exclusively. To complete the second half of the flight plan, subjects answered
questions using the previously unused resource. The order of the subject evaluations and the order the resources were used are shown in Figure 3.1.
Test Subjects
Flight 1 2 3 4 5 6 7 8
Plan
A A-MFD A- Sect A-MFD A-MFD A- Sect A- Sect A-MFD A- Sect
Sect MFD Sect Sect MFD MFD Sect MFD
B B- MFD B- Sect B- MFD B- MFD B- Sect B- Sect B- MFD B- Sect
Sect MFD Sect Sect MFD MFD Sect MFD
C C- MFD C- Sect C- MFD C- MFD C- Sect C- Sect C- MFD C- Sect
Sect MFD Sect Sect MFD MFD Sect MFD
D D-MFD D- Sect D- MFD D- MFD D- Sect D- Sect D- MFD D- Sect
Sect MFD Sect Sect MFD MFD Sect MFD
E E- MFD E- Sect E- MFD E- MFD E- Sect E- Sect E- MFD E- Sect
Sect MFD Sect Sect MFD MFD Sect MFD
Figure 3.1: Counterbalancing Matrix
3.5 Subject Pool
As this test in no way evaluated the effect of the MFD on actual flying metrics, seven rated pilots and one rated navigator were utilized as test subjects. The average age of the
subjects was 35 and consisted of seven males and 1 female participant. All pilots had fixed wing experience. Three of the subjects had primarily military flight experience with one subject having nearly all military helicopter time. The average flight time of the subjects was just over
not instrument rated. Additionally, all of the test subjects reported having experience with GPS navigation devices in the past and all but one had used an MFD in their aircraft experience. When asked to rate their personal comfort level using computers on a scale from 1 to 5, five being the most comfortable, the average score was 4.3.
The subject group covered well, if but thinly, the scope of general aviation pilot targeted by the Avidyne MFD. Generally speaking, they were well-experienced VFR pilots that are
comfortable with GPS navigation and its associated systems.
3.6 Subject Instructions and Procedures
Subjects were each provided the following formation regarding the purpose of the study: "The purpose of this experiment is to evaluate the Avidyne FlightMax EX5000C MFD for information retrieval on proposed VFR flight plans. The evaluation will attempt to characterize the ease of retrieving information, the value of the information available, and other general usability issues for general aviation pilots and aircraft. This experiment will consist of four separate static flight plan presentations displayed on a fully functional EX5000C MFD and on the associated VFR Sectional. You will be asked to perform a series of tasks while flying a simple flight plan along pre-planned flight parameters. The entire experiment should take approximately 1.5 to 2 hours."
The test was performed using "crib sheets" for the evaluator for guidance and data collection. A copy of the actual crib sheets for each of the flight plans is included in Appendix B. The remaining steps in the evaluation are listed below.
3.6.1 Non-Avidyne employees read the consent form and non-disclosure agreement and
signed their name.
3.6.3 Subject was familiarized with MFD and its capabilities and modes of operations. Flight Plan A was presented on the MFD and a VFR sectional and the user was asked to perform a unique series of tasks with both the MFD and the VFR Sectional that will be indicative of the upcoming evaluation period. The evaluation did not proceed to the next step until the subject declared himself ready.
3.6.4 Subject was presented with a VFR sectional with the waypoints and desired track
already labeled. Subject was allowed to review the flight plan on the MFD and sectional until they declared themselves comfortable with flight plan. Subject data was then
collected while the subject was viewing Flight Plan B and performing tasks as directed by tester. The first half of the questions from each flight plan was answered using either the MFD or VFR Sectional exclusively. The second half of the questions was answered utilizing only the second unused resource. The sequence is prescribed in the
counterbalancing matrix.
3.6.5 Subject completed modified Cooper-Harper Evaluations specifically relating to Flight Plan B for information discovery evaluation.
3.6.6 Subject was presented with a VFR sectional with the waypoints and desired track already labeled. Subject was allowed to review the flight plan on the MFD and sectional until they declared themselves comfortable with flight plan. Subject data was then
collected while the subject was viewing Flight Plan C and performing tasks as directed by tester. The first half of the questions for each flight plan was answered using either the MFD or VFR Sectional exclusively. The second half of the questions was answered utilizing only the second unused resource. The sequence is prescribed in the
3.6.7 Subject completes modified Cooper-Harper Evaluations specifically relating to Flight Plan C for workload evaluation.
3.6.8 Subject completes subjective questionnaire part I (questions relating specifically to Flight Plans B and C).
3.6.9 Steps 3.5.4 through 3.5. 7 were repeated using flight plans D and E respectively. 3.6.10 Subject completes subjective questionnaire part II (questions relating specifically to Flight Plan E).
3.7 Flight Plans and Data Recording
Flight plans were designed to evaluate the MFD and Sectional in a variety of flight environments. High-density airport areas are found in Flight Plan A, Flight Plan B and Flight Plan D. More moderate airport environments are found Flight Plan C and Flight Plan E. A quick look to Appendix A shows how a test subject would first see the flight plan prior to beginning that portion of the evaluation. Because it was expected that due to limited experience test subjects would stay in the aircraft centered view, (switching to a "Forward" view will place the aircraft near the bottom of the display screen and display predominantly the view "forward" of the aircraft), the flight plans were designed so that the first two legs could be seen almost entirely on a 20nm range scale. Often the proposed alternate would not be visible on the 20nm scale and Flight Plan A was intentionally oversized to show subjects how to find information "off the map" so to speak. The 20nm range scale was chosen as the basis for the decision
because at this range scale the MFD most closely approximates the range on a VFR Sectional
(~
7 nm/inch on a sectional versus,~ 6.5nm/inch at 20nm range scale on the MFD). The types questions asked during each flight plan were consistent across all five of the flight plans.Each question queried the subject for information that would normally be used over the course of a simple VFR flight plan. There were no "trick" questions or attempts to lead the subjects to a wrong answer. Questions were consistent in style and type across all of the flight plans. Additionally, questions were asked in a manner to mimic how another pilot or air traffic
controller may ask them. The time to complete each event (referred to as "Event Times") was then analyzed to reveal differences in the use of one device over another. Event start times were recorded after a question was read in its entirety. Event End times were recorded when the test subject returned their answer (Note: Subjects were not required to report the units of measure for their answers). The "event time" discussed in this thesis is the difference between the recorded event start and event end times. To be clear, event times do not include the time it took to read the questions. Subjects who later discovered their errors were not allowed to change their answers nor was a new event time recorded. The following sections describe the procedure followed during each flight plan, including and the exact questions and protocols for each flight plan.
3.7.1 Flight Plan A (Familiarization Flight)
1. Explain to the subject that during the first flight plan any questions regarding the use of the MFD or the VFR Sectional can be answered by the evaluator without any attempt at evasion. The first flight plan is intended to familiarize the subject with all of the functionality of the EX5000c and re-familiarize as necessary on the use of a VFR sectional. During the formal evaluation portion of the test, similar type questions may not be answered.
2. Direct user to the "Setup" page. Explain general functions available on this page and direct user to select the "Data Block Edit" function. Show user how to manipulate the data blocks. Ensure the data blocks are returned to the settings shown in Figure 3.2.
Default Data Block Settings
TO WPT + ETE LAT/LON
TO WPT + ETE LAT/LON
NEXT WPT ALT
NEXT WPT TAS
NRST APRT GROUND SPEED
NRST APRT LOCAL TIME
Figure 3.2: Default Data Block Settings
3. Direct the user to return to the core "Setup" page and explain in detail the Airport Filter and Declutter settings pages accessible from here. "Airport Filter Setup" and "Declutter Setup" pages will be configured as was seen earlier in Figure 2.7 and Figure 2.8 respectively.
4. Direct User to select the "Chklst" core page and describe basic functionality of the page. Inform subject that the checklist functions will not be used during the evaluations.
5. Direct the user to the "Trip" core page and explain the functions and features on this page.
6. Direct the user to the "Nrst" core page and explain the nearest
Airport/Navaid/Obstacles/etc. functions, features, and options on this page.
7. Direct the user to the "Map" core page and ensure the user becomes familiar with all of the map features available. Be sure to describe all items, icons, and functions on the page.
8. Brief the subject on the upcoming proposed flight plans. All flights are planned as VFR flights. The aircraft will be have a proposed airspeed of 100 Kts with negligible wind and will be flying at 1500ft AGL as appropriate. The test subject is allowed to have paper and something to write on and nothing else during the evaluation period. Ask subject to answer the following questions using only the map or MFD as prescribed in the counter-balancing matrix.
9. Flight Plan A Task List
1. What is the Tower Frequency at Olympia Airport (KOLM)?
2. What type of special use airspace is located immediately southeast of the first leg of flight in the vicinity of Gray Army Airfield (KGRF)?
3. What is the floor height of the Class B airspace over Gray AAF (KGRF)? 4. What is the general runway orientation at Seattle-Tacoma International
Airport (KSEA)?
5. What is the elevation of the runway at Seattle-Tacoma International Airport (KSEA)?
6. How far is Renton Municipal Airport (KRNT) from Seattle-Tacoma International Airport?
7. What is the length of the first leg of flight from Seattle-Tacoma International (KSEA) to Snohomish County Airport (KPAE)?
8. What is the frequency of the Renton NDB?
9. What is the height of the tallest obstacle within 10 nm of the proposed track from Seattle-Tacoma International Airport (KSEA) to Snohomish County (Paine Field) Airport (KPAE)?
Switch to either MFD or VFR Sectional as appropriate and answer the remainder of the questions
1. What is the runway elevation at Olympia Airport (KOLM)?
2. What type of controlled airspace is centered on Olympia Airport (KOLM)? 3. What is the length of the leg between Olympia Airport (KOLM) and
Seattle-Tacoma International Airport (KSEA)?
4. What is the VOR frequency of the VORTAC at Seattle-Tacoma International Airport (KSEA)?
5. What is the control tower frequency at Seattle-Tacoma International Airport (KSEA)?
6. If you were told to divert to NAS Whidbey Island (KNUW) from Snohomish County (KPAE) how long would it take you to arrive at NAS Whidbey traveling at 100 Kts?
7. Estimate the distance from Snohomish County Airport (KPAE) to the nearest edge of the restricted airspace located south of NAS Whidbey Island
(KNUW)?
8. What is the floor height of the Class B airspace over Snohomish County Airport (KPAE)?
9. What is the name of the first airport located due East of Snohomish County Airport (KPAE)?