HAL Id: hal-01260529
https://hal.archives-ouvertes.fr/hal-01260529
Submitted on 22 Jan 2016
HAL is a multi-disciplinary open access
archive for the deposit and dissemination of
sci-entific research documents, whether they are
pub-lished or not. The documents may come from
teaching and research institutions in France or
abroad, or from public or private research centers.
L’archive ouverte pluridisciplinaire HAL, est
destinée au dépôt et à la diffusion de documents
scientifiques de niveau recherche, publiés ou non,
émanant des établissements d’enseignement et de
recherche français ou étrangers, des laboratoires
publics ou privés.
Detecting, estimating and correcting multipath biases
affecting GNSS signals using a marginalized likelihood
ratio-based method
Cheng Cheng, Jean-Yves Tourneret, Quan Pan, Vincent Calmettes
To cite this version:
Cheng Cheng, Jean-Yves Tourneret, Quan Pan, Vincent Calmettes. Detecting, estimating and
cor-recting multipath biases affecting GNSS signals using a marginalized likelihood ratio-based method.
Signal Processing, Elsevier, 2016, vol. 118, pp. 221-234. �10.1016/j.sigpro.2015.06.021�. �hal-01260529�
O
pen
A
rchive
T
OULOUSE
A
rchive
O
uverte (
OATAO
)
OATAO is an open access repository that collects the work of Toulouse researchers and
makes it freely available over the web where possible.
This is an author-deposited version published in :
http://oatao.univ-toulouse.fr/
Eprints ID : 14692
To link to this article :
DOI:10.1016/j.sigpro.2015.06.021
URL :
http://dx.doi.org/10.1016/j.sigpro.2015.06.021
To cite this version :
Cheng, Cheng and Tourneret, Jean-Yves and Pan, Quan and
Calmettes, Vincent Detecting, estimating and correcting multipath
biases affecting GNSS signals using a marginalized likelihood
ratio-based method. (2016) Signal Processing, vol. 118. pp. 221-234.
ISSN 0165-1684
Any correspondence concerning this service should be sent to the repository
Detecting, estimating and correcting multipath biases
affecting GNSS signals using a marginalized likelihood
ratio-based method
Cheng Cheng
a,b, Jean-Yves Tourneret
c,1, Quan Pan
a,n, Vincent Calmettes
baSchool of Automation, Northwestern Polytechnical University, Xi'an, China bSCANR/DEOS-ISAE, University of Toulouse, Toulouse, France
c
IRIT/INP-ENSEEIHT, University of Toulouse, Toulouse, France
Keywords:
Global navigation satellite systems Multipath mitigation
Marginalized likelihood ratio test Multiple model
Urban positioning
a b s t r a c t
In urban canyons, non-line-of-sight (NLOS) multipath interferences affect position estimation based on global navigation satellite systems (GNSS). This paper proposes to model the effects of NLOS multipath interferences as mean value jumps contaminating the GNSS pseudo-range measurements. The marginalized likelihood ratio test (MLRT) is then investigated to detect, identify and estimate the corresponding NLOS multipath biases. However, the MLRT test statistics is difficult to compute. In this work, we consider a Monte Carlo integration technique based on bias magnitude sampling. Jensen's inequal-ity allows this Monte Carlo integration to be simplified. The multiple model algorithm is also used to update the prior information for each bias magnitude sample. Some strategies are designed for estimating and correcting the NLOS multipath biases. In order to demonstrate the performance of the MLRT, experiments allowing several localization methods to be compared are performed. Finally, results from a measurement campaign conducted in an urban canyon are presented in order to evaluate the performance of the proposed algorithm in a representative environment.
1. Introduction
Global navigation satellite systems (GNSS) have been widely used in many applications requiring demanding signal processing algorithms. These applications include surveillance of unmanned aerial/landing vehicles, search and rescue in urban canyons and location-based intelligent transport system applications. In these applications, the multipath (MP) interference is one of the largest sources of GNSS errors. MP errors are mainly due to the fact that a
signal transmitted by a satellite is very likely to be reflected or diffracted and can follow different paths before arriving at the GNSS receiver antenna [1]. MP interferences can be divided into two classes: (a) the non-line-of-sight (NLOS) interferences which result from a unique reflected signal received and tracked by the GNSS receiver; (b) the line-of-sight (LOS) interferences which result from the sum of the direct signal and of delayed reflections. NLOS interferences frequently occur in urban canyons, where the direct path of a satellite signal is vulnerable to masking or blocking whereas reflected signals can be tracked within the receiver[2].
Different approaches can be found in the literature for mitigating MP interference errors. The use of high quality antenna arrays has shown to be efficient for detecting and mitigating MP[3,4], or for estimating parameters of MP http://dx.doi.org/10.1016/j.sigpro.2015.06.021
n
Corresponding author.
E-mail addresses:[email protected](C. Cheng),
[email protected](J.-Y. Tourneret),
[email protected](Q. Pan),[email protected](V. Calmettes).
components. Unfortunately, these antennas are expensive and have large dimensions. Considering that the GNSS receiver has to track the signal composed of the direct signal and of delayed reflections in the LOS situation, several MP mitigation methods based on the narrow correlator delay lock loop [5] have been proposed, such as the strobe correlator[6], the early–late-slope technique
[7], the double-delta correlator[8]and the MP insensitive delay lock loop [9]. Moreover, the direct and reflected signal parameters can be estimated by using a robust statistical approach based on maximum likelihood princi-ple[10–14]. Bayesian approaches have also been proposed to estimate the MP parameters within GNSS receivers since they allow the nonlinear estimation problem to be handled[15–18]. In the NLOS situation, MP interferences can be hardly mitigated by these strategies while the direct signal is blocked or masked. To overcome these difficulties, a 3D model of the environment can be used to deliver a priori knowledge about the shadowed satellites
[19,20]. Another possibility is to exploit the geometric path model[21]in order to estimate a possible reflected path related to NLOS MP interferences. The reflected signal due to an MP interference can be converted to a bias appearing on the GNSS pseudo-range measurement. When prior information for this bias is obtained, MP mitigation meth-ods based on Bayesian statistical theory can be considered
[22]. For instance, Spangenberg considered in [23] two different models for pseudo-range measurements depend-ing on the availability of LOS signals. Viandier proposed in
[24] different ways of handling pseudo-range measure-ments contaminated by MP biases in urban scenarios, and of estimating the position of a vehicle by using a particle filter applied to a jump Markov system. Giremus proposed in [25]a fixed Rao-blackwellized particle filter to jointly detect and estimate MP biases associated with GNSS pseudo-range measurements.
The generalized likelihood ratio test (GLRT) (also known as the Bayesian detector [26]), used for fault detection and diagnosis in a state space was first proposed by Willsky and Jones[27]. In this GLRT, the test statistic is the innovation sequence of the Kalman filter and nuisance parameters appearing in the test statistic are replaced by their maximum likelihood estimator. The marginalized likelihood ratio test (MLRT) proposed by Gustafsson[28]
incorporates prior knowledge about the nuisance para-meters that are eliminated by the marginalization of the likelihood function. Accordingly, different bias detection and isolation approaches have been developed based on the MLRT. For instance, dos Santos proposed in [29] a maximum a posteriori criterion based on the margin-alization of the likelihood function with the gamma prior distribution. Kiasi proposed in[30]a modified MLRT with a uniform distribution to estimate the occurrence time of fault. Considering that the test statistic of the MLRT is generally difficult to compute, Giremus proposed in[31]a numerical solution based on the unscented transform to solve this problem.
In this work, we propose an approximated margin-alized likelihood ratio test based on Jensen's inequality to detect, identify and estimate the NLOS multipath biases affecting GNSS pseudo-range measurements. The test
statistic in the MLRT is approximated by a Monte Carlo integration technique based on bias magnitude sampling. Jensen's inequality allows this Monte Carlo integration to be simplified, and the multiple model algorithm is used to update the prior information for each bias magnitude sample. Some strategies are also designed for estimating and correcting the NLOS multipath biases. The empirical cumulative distribution function of the approximate test statistic is analyzed and the corresponding detection threshold is determined via Monte Carlo simulations. In addition, a comprehensive simulation study is implemen-ted to compare the performance of the proposed approach with other state-of-the-art detection approaches. Finally, the proposed approach is evaluated based on data obtained from a measurement campaign conducted in a street urban canyon.
The paper is organized as follows: the system con-sidered for GNSS positioning is introduced in Section2. Section3studies the MLRT and its approximation based on Jensen's inequality to detect MP biases possibly affecting GNSS measurements. Section 4 investigates the identification, estimation and correction of GNSS measurements in the presence of NLOS MP biases. Sec-tion5analyzes the test statistic used in the proposed MP detection approach. The performance of the proposed algorithm is evaluated in Section6, first from simulated data representative of realistic scenarios, and then from real data collected by a UBLOX receiver operating in an urban canyon. Conclusions are finally reported in Section7.
2. System description
2.1. State model
For the considered application which addresses vehi-cles moving slowly in an urban environment, we investi-gate a second-order model (i.e., a constant velocity model) to describe the dynamic of the vehicle in the earth-centered earth-fixed (ECEF) frame. Moreover, the GNSS receiver clock offset and its drift are taken into account. Therefore, the state model can be divided into two parts containing the position and velocity of the vehicle in the ECEF frame, and the receiver clock offset and drift, respec-tively. More precisely, the state vector considered in this paper is defined as follows[32]:
Xt¼ ðxt; _xt; yt; _yt; zt; _zt; bt; dtÞT ð1Þ
where ðxt; yt; ztÞ and ð _xt; _yt; _ztÞ are the vehicle position and
velocity in the ECEF frame (Cartesian coordinate), respec-tively, btand dtare the GNSS receiver clock offset and drift, ð$ÞTis the transpose of a vector.
The velocity can be reasonably modelled as a random walk, e.g., €x ¼ exwhere exis a zero mean Gaussian noise of variance
σ
a2
. For short-term applications in which the periodical clock resets of the GNSS receiver are not taken into account, the GNSS receiver clock offset btand its drift dtcan also be modelled as random walks, i.e., _bt¼ dtþ eb
and _dt¼ edwhere eband edare zero-mean Gaussian white noises of variance
σ
b2
and
σ
d2
. Based on the above assump-tions, the discrete-time state model which describes the
propagation of the vehicle state Xtcan be formulated as
Xk þ 1¼
Φ
k þ 1jkXkþ ek ð2Þwhere k ¼ 1;…; K denotes the kth sampling time instant, ek¼ ðex; ey; ez; eb; edÞT is the zero mean Gaussian white
noise vector of covariance matrix Qk. Considering a
rela-tive independence between the kinematic parameters and the GNSS clock parameters, the state matrix
Φ
k þ 1jk is ablock-diagonal matrix. More precisely, the matrices
Φ
k þ 1jkand Qkcan be defined as follows:
Φ
k þ 1jk¼ Ak 0 0 Ck ! and Qk¼Σ
a k 0 0Σ
ck ! ð3Þ where the block matrices Ak, Ck,Σ
a kand
Σ
c kare Ak¼ Ck 0 0 0 Ck 0 0 0 Ck 0 B @ 1 C A; Ck¼ 1Δ
t 0 1 ! ð4ÞΣ
ak¼ Qak 0 0 0 Qak 0 0 0 Qak 0 B @ 1 C A; Q a k¼σ
2a Δt4 4 Δt 3 2 Δt3 2Δ
t 2 0 @ 1 A ð5ÞΣ
ck¼σ
2 bΔ
t 2þσ
2 dΔ t4 4σ
2 dΔ t3 2σ
2 dΔ t3 2σ
2 dΔ
t 2 0 @ 1 A ð6Þand where
Δ
t represents the time interval between twosuccessive sampling instants.
2.2. Measurement model in the presence of multipath
As the GNSS receiver tracking loops filter MP interfer-ences whose relative delays vary with time, only the MP interferences resulting in a constant bias affecting the pseudo-range measurements (during the observation per-iod) are considered in this paper. Thus we introduce a mean value jump affecting the GNSS pseudo-range mea-surements in the presence of NLOS MP interferences. Consequently, the mth in-view satellite pseudo-range measurement model including an NLOS MP bias can be defined as[32] Zm k ¼ ffiffiffiffiffiffiffiffiffiffiffiffiffiffiffiffiffiffiffiffiffiffiffiffiffiffiffiffiffiffiffiffiffiffiffiffiffiffiffiffiffiffiffiffiffiffiffiffiffiffiffiffiffiffiffiffiffiffiffiffiffiffiffiffiffiffiffiffiffiffi ðxm k' xkÞ2þ ðymk ' ykÞ2þ ðzmk' zkÞ2 q þ bkþ vmk;θþ e m k ð7Þ where Zk m
(m ¼ 1;…; Ns) is the pseudo-range measure-ment associated with the mth in-view satellite, Nsis the number of in-view satellites, ðxm
k; ymk; zmkÞ and ðxk; yk; zkÞ are
the mth satellite position and the vehicle position in the ECEF frame, respectively, bk is the GNSS receiver clock offset, vm
k;θ is the magnitude of the NLOS MP bias
associated with the mth pseudo-range measurement, characterized by the parameter
θ
which represents the possible occurrence time of the NLOS MP bias (θ
¼ k for v¼ 0), and ekm
is the mth satellite pseudo-range measure-ment noise with a normal distribution em
k ( N ð0;
σ
2
rÞ
where N ð$Þ is a univariate Gaussian distribution with mean value 0 and variance
σ
r2
.
In (7), the pseudo-range measurement related to the vehicle position is defined by a non-linear equation of the vehicle position. An unscented Kalman filter and a particle filter could be investigated with the advantage to estimate
the state of this non-linear estimation problem. However, the corresponding computational costs of these filters can be prohibitive for practical applications. Thus, we consider in this chapter an extended Kalman filter (EKF) which leads to apply a conventional Kalman filter by linearizing the non-linear equation(7) and is known to provide an efficient and low-cost solution for weakly non-linear systems.
3. Non-line-of-sight bias detection based on MLRT
3.1. Problem formulation
In the NLOS situation, we propose to model the MP interference as a mean value jump affecting the GNSS pseudo-range measurements. We assume that NLOS MP biases do not appear simultaneously on different pseudo-range measurements and that the pseudo-pseudo-range measure-ment which is affected by NLOS MP bias is known. The case of multiple NLOS MP interferences appearing simul-taneously on different pseudo-range measurements will be discussed in the next section. Assuming that only the
mth satellite measurement is contaminated, the NLOS MP
bias vector for the pseudo-range measurements is denoted as v ¼ ð0;…; v;…; 0Þ A R
Ns where the only non-zero
ele-ment of v is located at the known position m.
According to the hypothesis testing theory, the like-lihood ratio test for detecting the presence or absence of a mean value jump is a binary hypothesis test which compares two likelihood functions associated with the absence ðH0Þ and presence ðH1Þ of a mean value jump in
the measurements. The two hypotheses considered in this paper are defined as follows:
H0:no mean value jump up to present time k;
H1:a mean value jump ðof amplitude v a0Þ
has occurred at time
θ
ok:The log-likelihood ratio for these two hypotheses is
lk
θ
; v+
, ¼ lnpðZ1:kjH1ð
θ
; vÞÞpðZ1:kjH0Þ
ð8Þ where Z1:k¼ fZigki ¼ 1 is the pseudo-range measurement
vector sequence up to time k with Zi¼ ðZ1i;…; Z
Ns
i Þ
T
, and
Nsis the number of in-view satellites. Note that we have denoted as pðZ1:kjH1ð
θ
; vÞÞ and pðZ1:kjH0Þ the probabilitydensity functions of the measurement vector associated with the hypotheses H1and H0respectively.
In the likelihood ratio test, the occurrence time and the magnitude of the mean value jump denoted as
θ
and v are assumed to be known. However, in practice the jump magnitude v is unknown and can be regarded as a nuisance parameter for the likelihood ratio test. Accord-ing to the literature, there are two classes of methods for eliminating the nuisance parameter v. The first method consists of replacing the nuisance parameter by its maximum likelihood estimator (maximizing the likeli-hood function) in the probability density functionpðZ1:kjH1ð
θ
; vÞÞ leading to the GLRT. The second methodmarginalizes the log-likelihood ratio with respect to the nuisance parameter yielding the MLRT. The key point of the GLRT based on a state space model is that the
maximum likelihood estimator of parameter v can be obtained by the innovation of an appropriate Kalman filter. Contrary to the GLRT, the nuisance parameter v is eliminated by marginalization of the likelihood function under the hypothesis H1in the MLRT. In[28], Gustafsson
proposed an MLRT approach based on a state space model as a more robust method for bias detection. Unfortunately, the marginal likelihood function under hypothesis H1 is generally difficult to compute in the
MLRT. An alternative was proposed by Giremus in [31]
where a numerical solution of the MLRT based on the unscented transform was used for bias detection in space state models. The method studied in [31]introduced a prior distribution for the nuisance parameter v which can be obtained from our experience about MP or from previous experiments. This work studies a similar approach which differs from [31] by the use of an approximation based on Jensen's inequality, as explained below. According to the error envelope of MP interfer-ences (which is a function of the MP relative delay interfering the direct signal for a given GNSS receiver configuration [33]), a possible prior distribution for the MP bias with magnitude v is a uniform distribution defined by pðvÞ ( Uðvmin; vmaxÞ where Uð$Þ denotes the
uniform distribution, vmin and vmax are the minimum
and maximum magnitudes of the MP bias, respectively. This distribution reflects the fact that the only knowl-edge about MP biases is their minimum and maximum values that have to be specified by the user, depending on the environment. Using this prior distribution for the nuisance parameter, we propose in this paper an approx-imate MLRT based on Jensen's inequality to detect the occurrence time of NLOS MP biases.
The marginalization of(8)with respect to v leads to
lk
θ
+ , ¼ lnpðZ1:kjH1ðθ
ÞÞ pðZ1:kjH0Þ ð9Þ where pðZ1:kjH1ðθ
ÞÞ ¼ Z pðZ1:kjH1ðθ
; vÞÞpðvÞ dv ð10Þand where pðvÞ is the prior distribution of v. Considering that the integral in(10)is difficult to compute in closed-form, a Monte Carlo integration method can be used to evaluate (10). According to the Monte Carlo integration,
(10)is approximated as pðZ1:kjH1ð
θ
ÞÞ + Xn i ¼ 1ω
ipðZ 1:kjH1ðθ
; viÞÞ ð11Þwhere viði ¼ 1;…; nÞ is the ith sampling value of the MP bias magnitude belonging to the interval ðvmin; vmaxÞ, and n
is the number of magnitude samples. Accordingly, a group of NLOS MP bias vectors (denoted as vi¼ ð0;…; vi;…; 0Þ for
i ¼ 1;…; n) are generated with weights
ω
i¼ 1=n such that
Pn
i ¼ 1
ω
i¼ 1. As a consequence, the test statistic lkðθ
Þ inthe MLRT can be approximated as
lk
θ
+ , ¼ lnpðZ1:kjH1ðθ
ÞÞ pðZ1:kjH0Þ + ln Pn i ¼ 1ω
ipðZ1:kjH1ðθ
; viÞÞ pðZ1:kjH0Þ : ð12Þ By decomposing the pseudo-range measurement vector sequence as Z1:k¼ fZ1:θ' 1; Zθ:kg, the probability densityfunctions of the measurement vector associated with the hypotheses H1and H0can be rewritten as
pðZ1:kjH1ð
θ
; vÞÞ ¼ pðZθ:kjZ1:θ' 1; H1ðθ
; vÞÞpðZ1:θ' 1jH1ðθ
; vÞÞpðZ1:kjH0Þ ¼ pðZθ:kjZ1:θ' 1; H0ÞpðZ1:θ' 1jH0Þ: ð13Þ
Since v ¼ 0 for k o
θ
, using(13)in(12)leads tolk
θ
+ , ¼ ln Pn i ¼ 1ω
ipðZθ:kjZ1:θ' 1; H1ðθ
; viÞÞ pðZθ:kjZ1:θ' 1; H0Þ : ð14Þ The maximum likelihood estimator of the occurrence timeθ
is ^θ
¼ argmaxθ
lkð
θ
Þ: ð15ÞThe presence of a mean value jump is decided using the following MLRT rule:
lkð ^
θ
Þ≷H1
H0
ε
ð16Þwhere
ε
is a threshold related to the probability of false alarm of the test. In order to reduce the computational complexity, the optimization ofθ
is constrained to the lastLwunits of time, i.e., k ' Lwo
θ
rk at any time k, where Lw is the window length.3.2. An approximate MLRT based on Jensen's inequality
According to the Kalman filter theory, the denominator of(14)which is the likelihood function associated with the hypothesis H0can be defined as
pðZθ:kjZ1:θ' 1; H0Þ ¼∏kj ¼θpðZjjZ1:j ' 1; H0Þ ð17Þ with pðZjjZ1:j ' 1; H0Þ ¼ N ðZj; ^Z 0 jjj ' 1; S 0 jÞ ¼ pð
γ
0jjH0Þ where N ðZj; ^Z 0 jjj ' 1; S 0jÞ is a Gaussian distribution with
mean vector Z^0
jjj ' 1 and covariance matrix S
0 j,
γ
0j ¼ Zj' ^Z 0 jjj ' 1and S 0j are the filter innovation vector and
covariance matrix under the hypothesis H0at time j, Zjand
^
Z0jjj ' 1are the pseudo-range measurement and predicted
measurement vectors under the hypothesis H0 at time j,
respectively. Thus, the numerator of(14)is a weighted sum of likelihood functions associated with different mean value jump hypotheses with magnitudes vi ði ¼ 1;…; nÞ. Indeed the likelihood function under the hypothesis of a mean value jump with magnitude viis
pðZθ:kjZ1:θ' 1; H1ð
θ
; viÞÞ ¼∏kj ¼θpðZjjZ1:j ' 1; H1ðθ
; viÞÞ ð18Þ with pðZjjZ1:j ' 1; H1ðθ
; viÞÞ ¼ N ðZj; ^Z i jjj ' 1; SijÞ ¼ pð ~γ
i jjH1ðθ
; viÞÞwhere ~
γ
ij¼γ
0j' vi and Sij are the filter innovation vectorand its associated covariance matrix, respectively, under the hypothesis H1with a bias magnitude viat time j. Note that ^Zijjj ' 1is the predicted measurement vector under the
After replacing (17) and (18) in (14), the MLRT test statistic based on the Monte Carlo integration can be expressed as follows: lk
θ
+ , ¼ ln Pn i ¼ 1ω
i∏kj ¼θN Zj; ^Z i jjj ' 1; S i j 0 1 ∏k j ¼θN Zj; ^Z 0 jjj ' 1; S0j 0 1 ¼ ln Pn i ¼ 1ω
i∏kj ¼θpð ~γ
i jjH1ðθ
; viÞÞ ∏k j ¼θpðγ
0jjH0Þ : ð19ÞAccording to (19), it is clear that the multiplication of several normal probability density functions in the denominator can be easily handled by the logarithm function. Conversely, the numerator of(19)is a weighted sum of normal probability density functions and thus is not easily tractable after the logarithm operation. Since the natural logarithm is a concave function over its range, Jensen's inequality[34]can be advocated leading to ln X n i ¼ 1
λ
igðxiÞ " # ZX n i ¼ 1λ
iln gðxiÞ ð20Þwhere gð$Þ is any functional,
λ
i40 and Pni ¼ 1
λ
i¼ 1.Expanding the numerator of(19), (20) leads to lnX n i ¼ 1
ω
i ∏ k j ¼θ pð ~γ
ijjH1ðθ
; viÞÞ Z X n i ¼ 1ω
iln ∏k j ¼θ pð ~γ
ijjH1ðθ
; viÞÞ: ð21Þ After replacing(21)in(19), the test statistic lkðθ
Þ can berewritten as follows: lk+θ, ¼ ln Pn i ¼ 1ωi∏kj ¼θpð ~γ i jjH1ðθ; viÞÞ ∏k j ¼θpðγ0jjH0Þ ZX n i ¼ 1 ωiln ∏k j ¼θ pð ~γijjH1ðθ; viÞÞ ' ln∏ k j ¼θ pðγ0jjH0Þ 9 1 2~l 0 kθ + ,; ð22Þ i.e., ~l0 kð
θ
Þ ¼ X k j ¼θ ðγ
0jÞTðS 0 jÞ' 1ðγ
0jÞ ' X n i ¼ 1ω
iX k j ¼θ ð ~γ
ijÞTðS i jÞ' 1ð ~γ
i jÞ 2 4 3 5þ K0 ð23Þ where K0¼Xk j ¼θ lnjS0jj ' Xn i ¼ 1ω
iXk j ¼θ lnjSijjis independent of the measurements. According to(23), in order to obtain filter innovations based on n measurement equations, several measurement equations (as many mea-surement equations as the number of bias magnitude samples) have to be processed in parallel and the con-tributions of all these measurement equations are weighted by
ω
i. In such case, each sample vicorresponds to one measurement equation, and the weight of each measurement equation actually depends on how close the magnitude sample viis to the exact magnitude v. Thus, the weight associated with each measurement equation is time-varying (hidden Markov chain) and will be denoted
as ~
ω
ij(weight of the ith measurement equation at time j).
After replacing
ω
iby ~ω
ijin(23), the following result can be
obtained: ~lkð
θ
Þ ¼ Xk j ¼θ ðγ
0jÞ T ðS0jÞ' 1γ
0j 0 1 'X n i ¼ 1 ~ω
i jð ~γ
i jÞ T ðSijÞ' 1ð ~γ
i jÞ " # þ K ð24Þ where K ¼X k j ¼θ ln S0j 8 8 8 8 8 8' Xn i ¼ 1 ~ω
ijln S i j 8 8 8 8 8 8 " # :Finally, using the previous derivations, the presence of a mean value jump is accepted or rejected using the follow-ing rule: ~lk
θ
+ , ≷H1 H0ε
0 ð25Þwhere
ε
0 is a threshold related to the probability of falsealarm of the test. The parameter
θ
is then replaced by its maximum likelihood estimator ^θ
defined as^
θ
¼ argmax θ ~lkθ
+ ,: ð26ÞThe rest of this section discusses how to adjust the weights ~
ω
ij defining ~lk
θ
+
,. Considering that several measurement equations need to be processed in parallel, ~
ω
ij can becomputed based on the multiple model algorithm which is defined in[35]. A set of measurement models associated with the jump magnitude samples vi (i ¼ 1;…; n) is denoted as
M 9 Mn ion
i ¼ 1 ð27Þ
where Mi
¼ ð0;…; vi;…; 0Þ and the corresponding model probability ~
ω
ij can be obtained based on the currentmeasurement Zj and the predicted model probability,
leading to ~
ω
i j¼ p M i jjZj 0 1 ¼1 cp ~γ
i jjH1θ
; vi + , 0 1 p MijjZj ' 1 0 1 ð28Þ where j ¼θ
;…; k and c is the normalization constant. 4. Identification/estimation/correction of multipath biasesAccording to the test statistic ~lk
θ
+
, resulting from the approximate MLRT derived in Section 3, the occurrence time of the NLOS MP bias can be estimated. In order to determine which pseudo-range measurements are affected by NLOS MP biases, we study in this section a simultaneous detection and identification procedure which allows NLOS MP biases appearing simultaneously on different pseudo-range measurements to be handled. Note that the pseudo-range measurements associated with a mean value jump can be isolated after the presence of an MP interference has been confirmed by the bias detection methods, such as the receiver autonomous
integrity monitoring (RAIM) method[32]and the method of[31]. However, considering that the number of in-view satellites is limited in urban scenarios, the exclusion of pseudo-range measurements may weaken the observabil-ity and impair the accuracy of positioning solution based on GNSS. In order to implement the positioning solution with a maximum of pseudo-range measurements, we propose in this paper to estimate the NLOS MP biases for correcting measurement errors related to these biases. All these operations referred to as identification, estimation and correction are detailed below.
4.1. Identification of multipath biases
In order to make identification possible, a possible method is to compute one MLRT test statistic for each in-view satellite pseudo-range measurement. In this case, two hypotheses for detecting the presence of an NLOS MP bias on the mth (m ¼ 1;…; Ns) in-view satellite pseudo-range measurement can be defined as
Hm
0: no mean value jump for the mth measurement up to present
time k, Hm
1: a mean value jump (of amplitude vma0Þ
has occurred for the mth measurement at timeθok.
The detection and identification of NLOS MP biases can be converted into a group of hypothesis tests for all pseudo-range measurements. The corresponding test statistic ~lmk
θ
+
, (m ¼ 1;…; Ns) associated with the hypothesis of an NLOS MP bias affecting the mth in-view satellite pseudo-range measurement from time
θ
to k can be obtained based on the approximate MLRT theory presented inSection 3. The maximum likelihood estimator of the occurrence time
θ
associated with the mth measurement is finally defined as ^θ
m¼ argmax θ ~lmkθ
+ ,: ð29ÞFor detecting the presence of an NLOS MP bias at a possible occurrence time ^
θ
m, our decision rule is~lm kð ^
θ
m Þ≷ Hm 1 Hm 0ε
0 ð30Þwhere
ε
0is the mth hypothesis threshold related to a givenprobability of false alarm. In order to simplify the compu-tation, a set of possible amplitudes (for the NLOS MP biases) vi (i ¼ 1;…; n) can be uniformly sampled in the interval vð min; vmaxÞ, and used for each calculation of the
test statistic ~lmk
θ
+ ,.
4.2. Estimation and correction of multipath biases
The optimization of ^
θ
is constrained to the data belonging to a finite window (k 'Lwo ^θ
rk). Since the bias detection has to be performed in real time, the value of Lwis set to a relatively small value, i.e., Lw¼ 11 in[27]or Lw¼ 5 in[28]. Note that a larger threshold could be chosen to control the probability of false alarm.After it has been detected that the mth satellite pseudo-range measurement is affected by an NLOS MP
interference, we propose to estimate the magnitude of the NLOS MP bias. The multiple model algorithm is used to update the measurement model probabilities associated with the magnitude samples defining the proposed approximate MLRT. Thus the model probability
ω
~i jdepends on how close the magnitude sample viis to the exact magnitude v and can adaptively adjust for each magnitude sample vi (i ¼ 1;…; n). The bias magnitude estimation ^vmð ^
θ
mkÞ for the mth in-view satellitepseudo-range measurement at time k can be defined as ^ vmð ^
θ
mkÞ ¼ v^ıkþ ^r m ^ıkð ^θ
m kÞ ð31Þ with ^ık¼ argmax i ~ω
ik ð32Þ and ^rm^ıkθ
^ m k 0 1 ¼ 1 k ' ^θ
mkþ 1 X k j ¼ ^θmk ~γ
m^ık;j ð33Þwhere n is the number of bias magnitude samples, ^
θ
mk isthe maximum likelihood estimator of the occurrence time
θ
associated with the mth measurement at time k, v^ık isthe ^ık th sampling value of the NLOS MP bias magnitude,
~
γ
m ^ık;j¼ Z m j ' ^Z m^ık;jjj ' 1 is the filter innovation under the
hypothesis Hm
1 with a bias sampling magnitude v^ık, Zj m
and ^Zm^ık;jjj ' 1are the mth in-view satellite pseudo-range and
predicted pseudo-range measurements under the hypoth-esis Hm1 with a bias sampling magnitude v^ık at time j,
respectively.
Once the NLOS MP bias and its magnitude have been detected and estimated, we propose to correct the corre-sponding filter innovation and to use it for the positioning solution based on the standard EKF algorithm. For the mth pseudo-range measurement which is affected by the NLOS MP bias, the corresponding filter innovation can be cor-rected as follows:
γ
m k ¼γ
mk' ^v m ð ^θ
mkÞ ð34Þ whereγ
mk is the corrected filter innovation which will be
used in the EKF algorithm at time k,
γ
m k ¼ Zm k' ^Z
m
kjk ' 1is the
filter innovation under the hypothesis Hm
0 at time k, ^Z
m kjk ' 1
is the predicted pseudo-range measurement of the mth in-view satellite under the hypothesis Hm0 at time k.
Note that the objective of correcting the filter innova-tion rather than the pseudo-range measurement itself is to enable the detection of an NLOS MP bias during its whole duration. Finally, an approximate MLRT to detect, estimate and correct the NLOS MP biases is summarized in
Algorithm 1.
Algorithm 1. The approximate MLRT to detect, estimate and correct NLOS MP biases in GNSS signals.
5. Test threshold analysis
According to the hypothesis testing theory, the MLRT threshold can be determined from the cumulative distri-bution function of the test statistic under hypothesis H0
and the significance level
α
(false alarm rate). Based on the aforementioned derivations, the test statistic ~l+θ
,of the proposed approximate MLRT in(24)was derived from the test statistic l+
θ
,of the MLRT in (19). However, the cumulative distribution functions of the test statistics
lm+
θ
, and ~lm+
θ
,under hypothesis Hm
0 have no
closed-form expression when the NLOS MP bias has a uniclosed-form distribution. Therefore, the empirical cumulative distribu-tion funcdistribu-tions of the test statistics lm+
θ
, and ~lm+
θ
, under hypothesis Hm0 have been computed by Monte Carlo
simulations performed using the parameters provided in
Table 1. In addition, the state space model defined in
Section 2 has been simulated with the parameters
reported inTable 1and the fault-free GNSS pseudo-range measurements have been computed based on an almanac file including all useful satellite orbit data in the simulations.
The empirical cumulative distribution functions of the test statistics lm+
θ
, and ~lm+θ
, under hypothesis Hm 0 can be defined as follows: ^ Fl;nsð Þ ¼l 1 ns Xns i ¼ 1 I lmi rl H m 0 8 8 , + ð35Þ and ^ F~l;n sð Þ ¼l 1 ns X ns i ¼ 1 I ~lmi rl Hm0 8 8 , 0 ð36Þ where I is the indicator function, ðlm1;…; lm nsÞ and ð~l m 1;…; ~l m nsÞ
are nssamples of the test statistics lm+
θ
, and ~l mθ
+ , under hypothesis Hm
0 computed by Monte Carlo simulations with
As depicted in Fig. 1, the two empirical cumulative distribution functions (computed with Lw¼ 5) satisfy the
relation ^Fl;nsð Þ 4 ^l F~l;nsð Þ. Accordingly, the false alarm ratesl
for the two empirical cumulative distribution functions satisfy
α
0Zα
when the test threshold is set as the samevalue for two empirical cumulative distribution functions, where
α
¼ ^Fl;ns l Zε
jH m 0 + , andα
0¼ ^F ~l;ns l Zε
jH m 0 + ,. Thus the false alarm rateα
0can be considered as an upper bound forα
when the test threshold is given.The test threshold for the approximate MLRT can be determined by the empirical cumulative distribution func-tions ^F~l;n
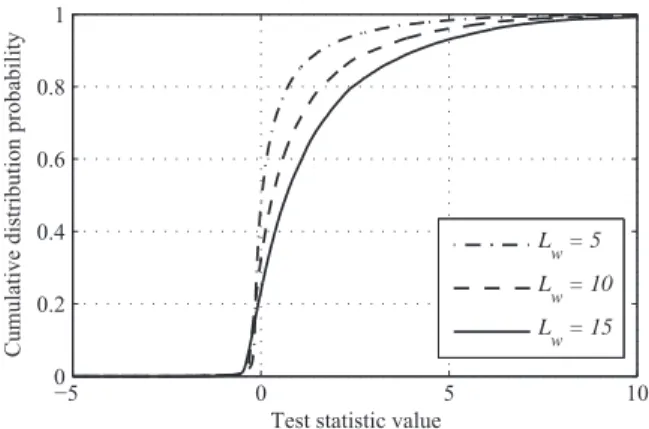
sð Þ (which depends on the window length Ll w) and
the false alarm rate
α
0. The empirical cumulativedistribu-tion funcdistribu-tions of the test statistic ~lm+
θ
,for different window lengths Lware displayed inFig. 2. The
correspond-ing thresholds associated with different false alarm rates are given inTable 2. It is clear that the empirical cumula-tive distribution function decreases as the window length increases. Accordingly, the test threshold is an increasing function of the window length Lw when the false alarm
rate
α
0is given.6. Algorithm assessment
6.1. Simulation results
6.1.1. Performance measures and test scenarios
In order to evaluate the detection and identification performance of the proposed approximate MLRT approach, the GLRT and to compare it with the approach studied in
[31], the following performance measures have been used in this paper:
-
Average probability of correct detection (denoted as PCD):A correct detection is obtained when an NLOS MP bias has been detected and a bias is effectively present.
-
Average probability of correct detection and identification(denoted as PCDI): A correct detection and identification
is obtained when an NLOS MP bias has been detected and when the bias sample associated with the largest model probability is the closest to the exact bias magnitude (at a given time).
-
Average probability of correct detection and incorrect identification (denoted as PCDII): A correct detectionand incorrect identification is obtained when an NLOS MP bias has been detected and the bias sample asso-ciated with the largest model probability is not closest to the exact bias magnitude (at a given time).
-
Mean detection delay and standard deviation of correct detection (denoted asτ
(s) andσ
(s) respectively): A mean detection delay time (s) is obtained by averaging 100 differences between the time instant of the first bias appearance and the time instant of the first bias detection.In order to evaluate the impact of different numbers of biases on the performance of the approximate MLRT, the multiple model algorithm has been tested with 3, 5 and 7 biases denoted as MLRT(3), MLRT(5) and MLRT(7), for all simulation scenarios. In theory, the pseudo-range MP error can reach magnitudes close to 0.5 of a code chip, i.e., 150 m in the C/A case, depending on the receiver correlation technology[33]. We have assumed in this study that the prior distribution of the MP bias magnitude v is a uniform distribution in the interval ð ' 75 m; 75 mÞ, i.e.,
Table 1
Simulation parameters.
Process noise (velocity) σa¼ 1 m=s2
Clock offset noise σb¼ 3c . 10' 10
m
Clock drift noise σd¼ 2πc . 10' 10m/s
GNSS measurement noise σr¼ 10 m
c ¼ 3 . 108m/s denotes the velocity of light.
−6 −4 −2 0 2 4 6 8 0 0.2 0.4 0.6 0.8 1
Test statistic value
Cumulative distribution probability
MLRT
Approximate MLRT
Fig. 1. Empirical cumulative distribution functions of ^Fl;nsðlÞ (dashed line) and ^F~l;n
sðlÞ (solid line) for a data window length Lw¼ 5.
−5 0 5 10 0 0.2 0.4 0.6 0.8 1
Test statistic value
Cumulative distribution probability
L w = 5 L w = 10 L w = 15
Fig. 2. Empirical cumulative distribution functions associated with dif-ferent data window lengths.
Table 2
Threshold for different false alarm ratios. Data window length Lw False alarm rate
0.025 0.05 0.1
5 4.01 2.78 1.62
10 5.83 4.39 2.94
p vð Þ ( U ' 75; 75ð Þ.2The values of the MP bias magnitudes used in our simulations are summarized inTable 3.
Finally, it is assumed that there are 4 in-view satellite pseudo-range measurements during the simulation. In order to reduce the influence of false alarms, the threshold has been set to ensure a false alarm rate of 0.1. The length of the data window is Lw¼ 5 and the filter period equals
1 Hz in all simulations. All algorithms have been coded using MATLAB and run on a laptop with Intel i-7 4710MQ and 8 GB RAM.
6.1.2. Results for single multipath detection
Scenarios with different bias magnitudes have been generated according to the measurement model (7) and 100 Monte Carlo runs.3In each scenario, an NLOS MP bias
with a deterministic magnitude appears on the first pseudo-range measurement (satellite #1) at the 100th second and the bias duration is 20 s.
First, in order to evaluate the influence of Jensen's inequality used in (22) on the detection performances and on the computation load required to compute the test statistic l+
θ
, and ~l+
θ
,,Table 4shows the detection results and the execution times for 100 Monte Carlo runs by using the different test statistics with 3 different bias samples. It is clear that the values of PCDfor the test statistic l
θ
+ , and ~l+
θ
, are similar in each scenario. However, the execution time for ~l+
θ
, is much less than that for l+
θ
,. Thus, without impacting the detection performance, Jensen's inequality can reduce the computation load of the MLRT.
Tables 5and6show the detection performance and the delay measures for the GLRT and the approximate MLRT approaches with different bias samples. The results reported inTable 5indicate that more than 70% of NLOS MP biases cannot be correctly detected for all approaches when the NLOS MP bias magnitude is less than or close to the measurement noise. The value of PCD gradually
increases with the NLOS MP bias magnitude for any detector, as expected. In addition, the value of PCDis larger
for the proposed approach than for the GLRT when the bias magnitude is small. This difference between the two detectors gradually disappears as the bias magnitude increases. Due to the competition between too many models in the multiple model, PCDII, significantly increases
with the number of models considered in the multiple model for the proposed approximate MLRT.
The results reported inTable 6indicate that the detec-tion delays for all approaches are decreasing funcdetec-tions of the NLOS MP bias magnitude. The decrease of detection delay for the approximate MLRT is smaller than with the GLRT as the bias magnitude increases. Although the mean detection delay and the standard deviation of the
proposed approach are slightly inferior to those of the GLRT, the proposed approach significantly improves the probability of correct detection. Thus the proposed approach provides better bias detection performance than the GLRT for a single NLOS MP.
6.1.3. Results for multiple multipath detection
In order to evaluate the detection performance in the presence of several NLOS MP biases appearing at the same time instant, a second scenario has been generated accord-ing to the measurement model(7)as follows:
-
The first satellite pseudo-range measurement (satellite #1) is affected by a mean value jump of 28 m during the time interval (40 s, 80 s), and an NLOS MP bias of ' 26 m appears during the time interval (100 s, 140 s).-
The second satellite pseudo-range measurement (satel-lite #2) is affected by an NLOS MP bias of 32 m occurring during the time interval (70 s, 150 s). Since the approach studied in [31] excludes a contami-nated measurement after the presence of a mean value jump has been detected, we propose to compare (1) the multiple bias detection performance of the proposed approach with that obtained using the approach of[31]and the GLRT, and (2) the positioning estimation accuracy of the proposed approach with that obtained using the standard EKF, the approach of[31]respectively. 100 Monte Carlo simulations have been run for any scenario. The accurate detection times for multiple NLOS MP (denoted by M) is used to compute the root mean square errors (RMSE) of the estimates defined by
ffiffiffiffiffiffiffiffiffiffiffiffiffiffiffiffiffiffiffiffiffiffiffiffiffiffiffiffiffiffiffiffiffiffiffiffiffiffiffiffiffiffiffiffiffiffiffiffiffiffi M' 1PM i ¼ 1 X^ ðiÞ k ' Xk 0 12 r
, where ^XðiÞk is the ith run result,
and k ¼ 1;…; K denotes the kth sampling time instant. The accurate detection times for multiple NLOS MP are depicted inFig. 3. These results show that the detection
Table 3
Bias magnitude samples used for the multiple model algorithm. Bias sampling magnitudes (m)
1 2 3 4 5 6 7
MLRT(3) ' 20 0 20
MLRT(5) ' 30 ' 20 0 20 30
MLRT(7) ' 35 ' 25 ' 15 0 15 25 35
Table 4
Detection performance using the different test statistics. NLOS MP bias magnitude (m) l θð Þ ~l θð Þ
PCD Time (s) PCD Time (s) 7 0.06 12.0477 0.05 10.9283 12 0.29 12.0416 0.26 10.9405 18 0.55 12.0378 0.62 10.9456 24 0.94 12.0125 0.98 10.9218 28 0.97 12.0239 0.95 11.0296 32 0.97 12.0198 0.97 10.8992
2The sign of the MP bias magnitude depends on the value of the MP
signal carrier phase relative to the LOS signal. When the relative carrier phaseδϕis such that ' 901 rδϕr901, the MP signal is referred to as a constructive interference and the LOS signal is strengthened by the MP signals (the sign of the MP bias is positive). Conversely, the MP signal is a destructive interference when the relative carrier phase satisfies the condition ' 1801rδϕr' 901 or 901 rδϕr1801. In this case, the LOS signal is weakened by the MP signals (the sign of the MP bias is negative).
3
We have observed that the results do not change significantly if we increase the number of Monte Carlo simulations.
performances of the proposed approximate MLRT and the approach studied in [31] are more reliable than for the GLRT due to the prior information considered for the bias magnitude. Moreover, the performance of the approach studied in [31]is close to that of the MLRT(3) and more models in the multiple model algorithm can facilitate the bias detection.
In order to evaluate the effect of different NLOS bias detection approaches on the positioning solution, the RMSEs of the estimated positions with different detection approaches in the Y-direction of the ECEF frame are depicted in Fig. 4. The NLOS MP biases severely impair the positioning solution based on GNSS, as expected. Although the exclusion of contaminated pseudo-range
measurements can partly improve the position accuracy, the accuracy obtained with the MLRT(7) is much better than that obtained with the approach of [31]. This improvement can be explained by the fact that the corrected pseudo-range measurements allow a better system observability.
6.2. Experiment results 6.2.1. Measurement campaign
In this section, the proposed approach is evaluated based on experimental data collected during a measure-ment campaign carried out in Toulouse center (France). A synchronized integrated navigation system composed of a Novatel receiver coupled to a tactical grade IMAR IMU has been used to provide a reference trajectory. Taking advan-tage of a ground reference station, differential corrections have been performed to obtain position accuracy close to 1 m for the reference trajectory, which is considered as the ground truth. For assessing the algorithm performance, the vehicle has been equipped with a UBLOX 6T receiver. This receiver delivers not only the position, velocity and time solution, but also, for each satellite, the raw pseudo-range and Doppler frequency measurements, as well as the navigation message. It allows us to compute satellite locations, and to perform timing and propagation correc-tion on the measured pseudo-range. As the aim of the algorithm is to detect and mitigate pseudo-range biases in
Table 5
Detection performance for different scenarios.
NLOS MP bias magnitude (m) MLRT(3) MLRT(5) MLRT(7) GLRT
PCD PCDI PCDII PCD PCDI PCDII PCD PCDI PCDII PCD
7 0.05 – – 0.07 – – 0.10 – – 0 12 0.26 0.20 0.06 0.30 0.27 0.03 0.24 0.18 0.06 0.14 18 0.62 0.57 0.05 0.59 0.34 0.25 0.74 0.32 0.42 0.40 24 0.98 0.97 0.01 0.90 0.59 0.31 0.94 0.45 0.49 0.61 28 0.95 0.95 0 0.97 0.61 0.36 0.96 0.47 0.49 0.93 32 0.97 0.97 0 0.96 0.50 0.46 0.98 0.47 0.51 0.98 Table 6
Detection delay for different scenarios. NLOS MP bias magnitude (m) MLRT(3) MLRT(5) MLRT(7) GLRT τ σ τ σ τ σ τ σ 7 6.54 – 6.34 – 7.86 – 8.67 – 12 4.23 3.17 4.63 3.04 4.58 3.21 4.75 4.56 18 1.14 2.39 1.27 1.55 1.38 1.79 1.78 3.59 24 ' 0.66 1.51 ' 0.94 1.53 ' 0.86 1.24 1.19 1.79 28 ' 0.56 1.43 0.76 1.36 ' 0.80 1.10 0.19 0.87 32 0.52 1.24 ' 0.71 1.34 ' 0.78 1.06 0.18 0.71 (1) (2) (3) (4) (5) 0 20 40 60 80 100
Bias detection approach
Number of runs
85
92 74
81 87
Fig. 3. Accurate detection times for multiple NLOS MP. The bias detection approaches corresponding to the sequence number in the figure are: (1) – GLRT; (2) – Approach in[31]; (3) – MLRT(3); (4) – MLRT(5); (5) – MLRT (7). 0 50 100 150 200 0 10 20 30 40 50 60 70 Simulation time (s)
RMSE in the Y−direction (m)
Fig. 4. RMSEs of positioning estimations with different detection approaches. Proposed approach: red solid line; approach in[31]: blue dashed line; standard EKF: black dash-dotted line. (For interpretation of the references to color in this figure caption, the reader is referred to the web version of this paper.)
the presence of MP, Doppler frequencies that are related to the vehicle velocity are not used here. Data are collected in street urban canyons during which the receiver is strongly affected by MP interferences, and post-processed using Matlab.
Fig. 5shows the trajectory considered in our measure-ment campaign (lasting 230 s).Fig. 6displays the evolu-tion of the trip distance (considered in our experiment) versus time, where the original point is defined as the initial position on the trajectory and the trip distance represents the horizontal distance travelled from the initial position. It is clear that the trip distance does not change during the time interval (71 s, 154 s), as the vehicle is stopped in the middle of two buildings during this period. In this case, the receiver is very sensitive to any MP interference. As it appears at the LOS frequency (the Doppler frequency related to the vehicle velocity is zero), pseudo-range measurements are severely impacted by MP interference during this period.
We propose to compare the positioning estimation accuracy of the MLRT(5) with that obtained using the standard EKF. The in-view satellites observed during the experience are satellites #3, #6, #19, #26, and #27. The standard deviations, which are used to define the process and measurement noises are
σ
a¼ 0:4 m=s2 andσ
r¼ 4 mrespectively. The bias sampling magnitudes considered in the multiple model for the MLRT(5) are set as
' 8 m; ' 4 m; 0 m; 4 m; 8 m
ð Þ in order to make the
algo-rithm sensitive to short-delay MP interferences which characterize urban canyons. Accordingly, we obtain five estimators corresponding to the different bias magnitudes referred to as estimators #1: ' 8 m; #2: ' 4 m; #3: 0 m; #4: 4 m; #5: 8 m. The length of the data window is set to Lw¼ 5.
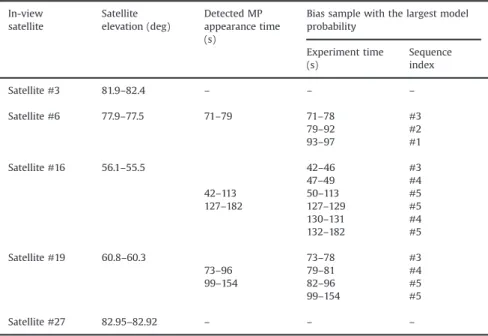
Table 7
Estimated MP appearance times. In-view satellite Satellite elevation (deg) Detected MP appearance time (s)
Bias sample with the largest model probability Experiment time (s) Sequence index Satellite #3 81.9–82.4 – – – Satellite #6 77.9–77.5 71–79 71–78 #3 79–92 #2 93–97 #1 Satellite #16 56.1–55.5 42–46 #3 47–49 #4 42–113 50–113 #5 127–182 127–129 #5 130–131 #4 132–182 #5 Satellite #19 60.8–60.3 73–78 #3 73–96 79–81 #4 99–154 82–96 #5 99–154 #5 Satellite #27 82.95–82.92 – – –
Fig. 5. Urban canyon trajectory used in the proposed experiments (obtained with Google Earth).
0 50 100 150 200 250 0 50 100 150 200 Experiment time (s) Trip distance (m)
6.2.2. Results
The results reported inTable 7indicate the MP appear-ance time period detected by the MLRT(5). According to the results of the detection algorithm, no MP interference
impacting pseudo-range measurements has been detected for the satellites #3 and #27. Conversely, the pseudo-range measurements of satellites #6, #16 and #19, which are impacted by the MP interference, are detected by the proposed approach during the same period. The elevation angles of the different in-view satellites are also reported inTable 7. Note that the elevation angles for satellites #3, #6 and #27 are larger than 751, whereas the elevation angles for satellites #16 and #19 are less than or equal to 601. The signals from low-elevation-angle satellites, such as satellites #16 and #19, are usually vulnerable to the MP interferences in urban canyons. Conversely, the signals from satellites with high elevation angles, such as satellites #3 and #27, can hardly be impacted by the MP interfer-ences. Accordingly, the detection results for MP appear-ance coincide with the in-view satellite elevations as reported in Table 7. As mentioned above, five measure-ment models associated with different bias sampling magnitudes in the multiple model are considered for MLRT(5). The estimators, which correspond to bias sam-pling magnitudes with the largest model probability for the detected time intervals, are indicated inTable 7. Since the magnitude of the MP interferences changes for differ-ent time instants, the magnitude of the bias sample
Fig. 7. Positioning results for different approaches in a urban canyon (obtained with Google Earth). Reference trajectory: white line; proposed approach: red line; standard EKF: blue line. (For interpretation of the references to color in this figure caption, the reader is referred to the web version of this paper.)
0 50 100 150 200 0 5 10 15 20 Experiment time (s) Position error (m) EKF MLRT(5) t = 42 s 0 50 100 150 200 0 5 10 15 20 25 30 Experiment time (s) Position error (m) EKF MLRT(5) t = 71 s
Fig. 8. Positioning errors versus time. (a) Horizontal error. (b) Vertical error.
0 50 100 150 200 0 10 20
Position error (m)
EKF
0 50 100 150 200 0 10 20Trip distance (m)
Position error (m)
MLRT(5)
0 50 100 150 200 0 10 20 30Position error (m)
EKF
0 50 100 150 200 0 10 20 30Trip distance (m)
Position error (m)
MLRT(5)
associated with the largest model probability also changes with time.
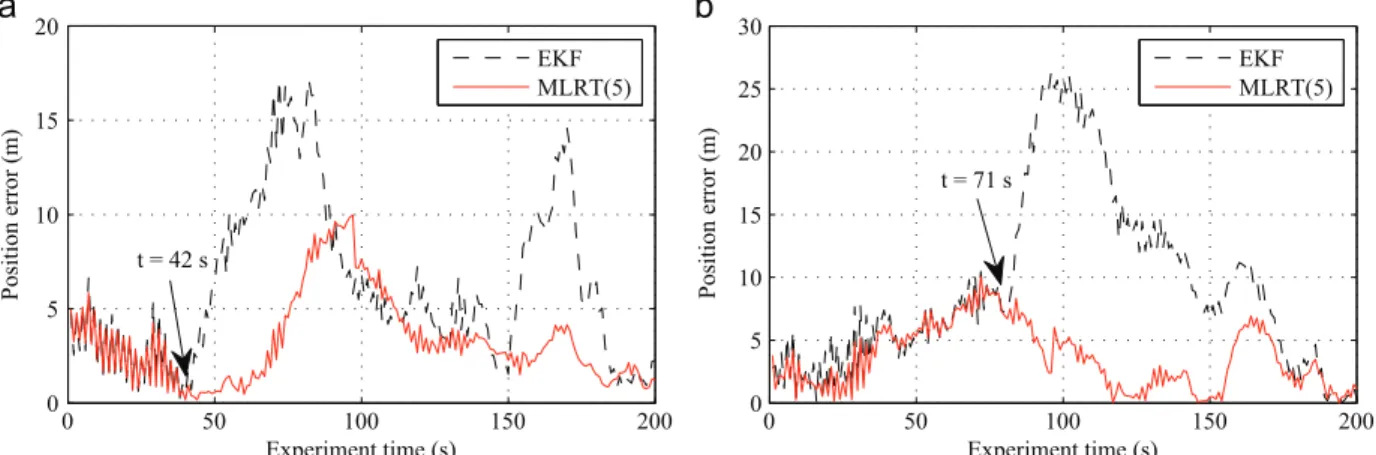
Figs. 7and8display the positioning results (illustrated with Google Earth) and the corresponding positioning errors (the horizontal and vertical errors versus time) for the different approaches. It is clear that MP interferences severely impair the positioning solution if these interfer-ences are not processed within the receiver. As shown in
Fig. 8the time instances, from which the horizontal and vertical positioning errors based on the standard EKF start to deteriorate, coincide with the MP appearance time determined by the proposed approach. Conversely, the positioning errors obtained with the proposed approach remains lower than 10 m, confirming that the MP inter-ferences appearing on the pseudo-range measurements have been detected and mitigated.
Fig. 9displays the horizontal and vertical errors versus the trip distance. It is clear that the positioning accuracy, especially in the vertical direction, is sensitive to the MP interferences when the vehicle stops in the middle of two buildings. As a consequence, the impact resulting from the MP interference error is the maximum during this period. However, the proposed approach can effectively mitigate the impact of the MP interference in this case. Increasing the duration of the observation window depending on the vehicle dynamic could also facilitate MP detection when the vehicle remains at the same location.
7. Conclusion
This paper proposed an approximated marginalized likelihood ratio test based on Jensen's inequality to detect, identify and estimate the NLOS multipath biases affecting GNSS pseudo-range measurements in urban canyons. The effects of NLOS multipath interferences were modeled as mean value jumps. The proposed approach was based on a marginalized likelihood ratio test approximated using a Monte Carlo integration and Jensen's inequality. The multi-ple model algorithm was introduced to update the prior information of each bias magnitude sample in order to improve its detection. A simulation study was implemen-ted in order to compare the performance of the proposed approach with the GLRT and the approach studied in[31]. Although the mean detection delay and the standard deviation of the proposed approach were slightly inferior to those of the GLRT, the probability of correct detection increases significantly (when compared to the GLRT) due to the introduction of a prior information about the bias magnitude. A comparison with the standard EKF and the approach studied in [31] showed that the positioning accuracy was improved by the proposed approach. Finally, the proposed approach was validated by processing data collected from a measurement campaign carried out in an urban environment. The proposed approach proved its efficiency for MP interference detection and mitigation, resulting in improving positioning accuracy.
Considering that more accurate state models facilitate the NLOS MP bias detection and that inertial measurement units (IMU) can provide more reliable information about the dynamic of the vehicle, our future work will be devoted to implement the proposed approach within an
IMU/GNSS integration. It would also be interesting to allow the length of the observation window to adapt dynamically depending on the receiver motion (especially when the receivers stop and do not move anymore). Finally the application of the proposed approach for other applications, such as mobile phone communication in urban environments, would deserve some attention.
Acknowledgments
This research was supported by the National Natural Science Foundation of China (#61473230, #61135001). We also thank the anonymous reviewers for their valuable suggestions, which helped to improve the quality of the paper. References
[1]E. Kaplan, C. Hegarty, Understanding GPS: Principles and
Applica-tion, 2nd ediApplica-tion, Artech House, Norwood, MA, 2006.
[2]L.Y. Liu, M.G. Amin, Tracking performance and average error analysis
of GPS discriminators in multipath, Signal Process. 89 (6) (2009)
1224–1239.
[3]Z.Y. Jiang, P.D. Groves, NLOSGPS signal detection using a
dual-polarisation antenna, GPS Solut. 18 (1) (2014) 15–26.
[4]S. Daneshmand, A. Broumandan, N. Sokhandan, G. Lachapelle, GNSS
multipath mitigation with a moving antenna array, IEEE Trans.
Aerosp. Electron. Syst. 49 (1) (2013) 693–698.
[5]A.J. van Dierendonck, P.C. Fenton, T. Ford, Theory and performance of
narrow correlator spacing in a GPS receiver, J. Navig. 39 (3) (1992)
265–283.
[6] L. Garin, F. van Diggelen, J.M. Rousseau, Strobe & Edge correlator multipath mitigation for code, in: Proceedings of the 9th Interna-tional Technical Meeting of the Satellite Division of the Institute of Navigation (IONGPS 1996), Kansas City, MO, USA, 1996, pp. 657–664. [7] B.R. Townsend, P.C. Fenton, A practice approach to the reduction of pseudorange multipath error in a L1 gps receiver, in: Proceedings of the 7th International Technical Meeting of the Satellite Division of the Institute of Navigation (IONGPS 1994), Salt Lake City, UT, USA, 1994, pp. 143–148.
[8] G.A. McGraw, M.S. Braasch, GNSS multipath mitigation using gated and high resolution correlator concepts, in: Proceedings of the National Technical Meeting of the Institute of Navigation (IONNTM 1999), San Diego, CA, USA, 1999, pp. 333–342.
[9]N. Jardak, A. Vervisch-Picois, N. Samama, Multipath insensitive delay
lock loop in GNSS receivers, IEEE Trans. Aerosp. Electron. Syst. 47 (4)
(2011) 2590–2609.
[10] R.D.J. van Nee, J. Siereveld, P.C. Fenton, B.R. Townsend, The multipath estimating delay lock loop: approaching theoretical accuracy limits, in: Proceedings of 1994 IEEE Position, Location and Navigation Symposium (PLAN 1994), Las Vegas, NV, USA, 1994, pp. 246–251.
[11]L.L. Weill, Multipath mitigation: How good can it get with new
signals? GPS World (June) (2003) 106–113.
[12]M. Sahmoudi, M.G. Amin, Fast iterative maximum-likelihood
algo-rithm (fimla) for multipath mitigation in the next generation of GNSS receivers, IEEE Trans. Wireless Commun. 7 (11) (2008)
4362–4374.
[13]M. Sahmoudi, M.G. Amin, Robust tracking of weak GPS signals in
multipath and jamming environments, Signal Process. 89 (7) (2009)
1320–1333.
[14]N. Blanco-Delgado, F.D. Nunes, Multipath estimation in
multicorre-lator GNSS receivers using the maximum likelihood principle, IEEE
Trans. Aerosp. Electron. Syst. 48 (4) (2012) 3222–3233.
[15] S.F.S. Dardin, V. Calmettes, B. Priot, J.-Y. Tourneret, Design of an adaptive vector-tracking loop for reliable positioning in harsh environment, in: Proceedings of the 26th International Technical Meeting of the Satellite Division of the Institute of Navigation (IONGNSS 2013), Nashville, TN, USA, 2013, pp. 3548–3559. [16] M. Spangenberg, A. Giremus, P. Poire, J.-Y. Tourneret, Multipath
estimation in the global positioning system for multicorrelator receivers, in: Proceedings of the 32th IEEE International Conference on Acoustics, Speech and Signal Processing (ICASSP 2007), Honolulu, HI, USA, 2007, pp. 1277–1280.
[17]P. Closas, C. Fernandez-Prades, J.A. Fernandez-Rubio, A Bayesian approach to multipath mitigation in GNSS receivers, IEEE J. Sel.
Top. Signal Process. 3 (4) (2009) 695–706.
[18] V. Pereira, A. Giremus, E. Grivel, A Boltzmann machine to model the multipath environment for particle filtering based GPS navigation, in: Proceedings of the 20th European Signal Processing Conference (EUSIPCO 2012), Bucharest, Romania, 2012, pp. 185–189.
[19]P.D. Groves, Shadow matching: a new GNSS positioning technique
for urban canyons, J. Navig. 64 (3) (2011) 417–430.
[20] A. Bourdeau, M. Sahmoudi, J.-Y. Tourneret, Constructive use of GNSS NLOS-multipath: augmenting the navigation Kalman filter with a 3D model of the environment, in: Proceedings of the 15th International Conference on Information Fusion (FUSION 2012), Singapore, 2012, pp. 2271–2276.
[21] D.E. Gustafson, J.M. Elwell, J.A. Soltz, Innovative indoor geolocation using RF multipath diversity, in: Proceedings of 2006 IEEE/IONPosi-tion, Location and Navigation Symposium (PLAN 2006), San Diego, CA, USA, 2006, pp. 904–912.
[22] S.G. Razul, C.-H. Lim, C.M.S. See, Bayesian method for NLOS
mitiga-tion in single moving sensor Geo-locamitiga-tion, Signal Process. 91 (7)
(2011) 1613–1621.
[23] M. Spangenberg, V. Calmettes, O. Julien, J.-Y. Tourneret,
G. Duchateau, Detection of variance changes and mean value jumps in measurement noise for multipath mitigation in urban navigation,
J. Navig. 57 (1) (2010) 35–52.
[24] N. Viandier, D.F. Nahimana, J. Marais, E. Duflos, GNSS performance enhancement in urban environment based on pseudo-range error model, in: Proceedings of 2008 IEEE/IONPosition, Location and Navigation Symposium (PLAN 2008), Monterey, CA, USA, 2008, pp. 337–382.
[25]A. Giremus, J.-Y. Tourneret, V. Calmettes, A particle filtering
approach for joint detection/estimation of multipath effects on GPS measurements, IEEE Trans. Signal Process. 55 (4) (2007)
1275–1285.
[26] S.M. Kay, Fundamentals of Statistical Signal Processing, Volume II: Detection Theory, Prentice Hall, Upper Saddle River, NJ, 2001.
[27]A.S. Willsky, H.L. Jones, A generalized likelihood ratio approach to
the detection and estimation of jumps in linear systems, IEEE Trans.
Autom. Control 21 (1) (1976) 108–112.
[28]F. Gustafsson, The marginalized likelihood ratio test for detecting
abrupt changes, IEEE Trans. Autom. Control 41 (1) (1996) 66–78.
[29]D.A. dos Santos, T. Yoneyama, A Bayesian solution to the multiple
composite hypothesis testing for fault diagnosis in dynamic systems,
Automatica 47 (1) (2011) 158–163.
[30]F. Kiasi, J. Prakash, S. Patwardhan, S.L. Shah, A unified framework for
fault detection and isolation of sensor and actuator biases in linear time invariant systems using marginalized likelihood ratio test with
uniform priors, J. Process Control 23 (9) (2013) 1350–1361.
[31] A. Giremus, J. Grolleau, An unscented Kalman filter based maximum likelihood ratio for NLOS bias detection in UMTS localization, in: Proceedings of the 16th European Signal Processing Conference (EUSIPCO 2008), Lausanne, Switzerland, 2008, pp. 1–5.
[32]P.D. Groves, Principles of GNSS, Inertial and Multisensor Integrated
Navigation Systems, Artech House, London, 2008.
[33]P. Misra, P. Enge, Global Positioning System: Signals, Measurements
and Performance, Ganga-Jamuna Press, Lincoln, MA, 2001.
[34]D.J.C. MacKay, Information Theory, Inference and Learning
Algo-rithms, Cambridge University Press, Cambridge, 2003.
[35]Y. Bar-Shalom, X.R. Li, T. Kirubarajan, Estimation with Applications to
Tracking and Navigation: Theory Algorithms and Software, John
![Fig. 4. RMSEs of positioning estimations with different detection approaches. Proposed approach: red solid line; approach in [31]: blue dashed line; standard EKF: black dash-dotted line](https://thumb-eu.123doks.com/thumbv2/123doknet/14379051.505610/12.892.467.798.251.584/positioning-estimations-different-detection-approaches-proposed-approach-approach.webp)