Publisher’s version / Version de l'éditeur:
Vous avez des questions? Nous pouvons vous aider. Pour communiquer directement avec un auteur, consultez la
première page de la revue dans laquelle son article a été publié afin de trouver ses coordonnées. Si vous n’arrivez pas à les repérer, communiquez avec nous à [email protected].
Questions? Contact the NRC Publications Archive team at
[email protected]. If you wish to email the authors directly, please see the first page of the publication for their contact information.
https://publications-cnrc.canada.ca/fra/droits
L’accès à ce site Web et l’utilisation de son contenu sont assujettis aux conditions présentées dans le site LISEZ CES CONDITIONS ATTENTIVEMENT AVANT D’UTILISER CE SITE WEB.
Proceeding of the 3rd International Conference on Computational Heat and Mass
Transfer, pp. 243-251, 2003-05-01
READ THESE TERMS AND CONDITIONS CAREFULLY BEFORE USING THIS WEBSITE. https://nrc-publications.canada.ca/eng/copyright
NRC Publications Archive Record / Notice des Archives des publications du CNRC :
https://nrc-publications.canada.ca/eng/view/object/?id=b157b1b2-226e-4940-b1fa-476732c65989 https://publications-cnrc.canada.ca/fra/voir/objet/?id=b157b1b2-226e-4940-b1fa-476732c65989
NRC Publications Archive
Archives des publications du CNRC
This publication could be one of several versions: author’s original, accepted manuscript or the publisher’s version. / La version de cette publication peut être l’une des suivantes : la version prépublication de l’auteur, la version acceptée du manuscrit ou la version de l’éditeur.
Access and use of this website and the material on it are subject to the Terms and Conditions set forth at
An Approach to validating computational models for hygrothermal
analysis - full scale experiments
An Approach to validating computational models for hygrothermal analysis – full-scale experiments
Maref, W.; Lacasse, M.A.; Booth, D.
NRCC-45215
A version of this document is published in / Une version de ce document se trouve dans: Proceeding of the 3rd International Conference on Computational Heat and Mass Transfer,
Banff, Alberta, May 26-30, 2003, pp. 243-251
Proceedings of APM2002
3rd International Conference on Computational Heat and Mass Transfer May 26-30, 2003, Banff, CANADA
Paper Number “64”
AN APPROACH TO VALIDATING COMPUTATIONAL MODELS FOR HYGROTHERMAL ANALYSIS – FULL-SCALE EXPERIMENTS
W. Maref ∗, M.A. Lacasse and D. Booth
NATIONAL RESEARCH COUNCIL CANADA, INSTITUTE FOR RESEARCH IN CONSTRUCTION,
MONTREAL ROAD CAMPUS, BUILDING M-24, K1A 0R6, OTTAWA, ONTARIO, CANADA mailto:[email protected];Tel. 613-993 5709; Fax. 613-998 6802
[email protected] ; mailto:[email protected]
ABSTRACT
Recent research in the field of assessment of hygrothermal response has focused on either laboratory experimentation or modelling, but less work has been reported in which both aspects are combined. Such type of studies can potentially offer useful information regarding the benchmarking of models and related methods to assess hygrothermal performance of wall assemblies. An advanced hygrothermal computer model called hygIRC was used to assess the hygrothermal response of wood sheathing board, a key component of wood-frame wall assemblies. hygIRC uses hygrothermal properties of materials derived from tests on small-scale specimens undertaken in the laboratory. The intent of this work was to obtain experimental results on the hygrothermal the response of the wood sheathing, in full-scale wall assemblies, when subjected to nominally steady-state environmental conditions. The drying rates of wall assemblies featuring several different membranes in contact with the wood sheathing were determined from experiments undertaken in a controlled laboratory setting. These results were subsequently compared to those obtained using hygIRC as a means of helping benchmark the simulation model. Conclusions from these studies are definite for both full-scale tests – simulation results compare favourably with those obtained from the experiments. This suggests that the model adequately emulates the hygrothermal response of specific wood-frame assembly components, such as wood sheathing, over a range of environmental conditions to which it was subjected in the experiments. These results further enhance confidence towards the implementation of hygIRC in broader based parametric studies.
NOMENCLATURE
u Moisture content kg (moisture)/kg (dry
material) - (%) w
ρ Liquid moisture partial density (kg/m3)
• l
m Liquid moisture mass flow rate (kg/s)/m2
D
w
Liquid moisture diffusivity (m2/s)• v
m Vapour moisture mass flow rate (kg/s)/m2
δ
p
Vapour water permeability (kg/ m s Pa)w
k
Liquid moisture permeability (kg/m s Pa)gr
Gravitational vector (m/s2)S Capillary suction pressure (Pa)
C
p
Effective specific heat capacity (J/kg K)v
P
Vapour moisture pressure (Pa)a p C
Dry-air specific heat capacity (J/kg K)
T Temperature (K)
f
l
Liquid fraction having a value from 0 to 1t
Time (s) λ Effective thermal conductivity (W/m K)
a
V
r
Air velocity vector (m/s)L
v
Enthalpy of evaporation/condensation (J/kg)o
ρ
Density of the dry porous material (kg/m3)L
ice
Enthalpy of freeze/thaw (J/kg)v
ρ
Vapour moisture partial density (kg/m3)T
ρ
Actual total density of the material including moisture contribution (kg/m3)INTRODUCTION
Building envelope components and assemblies have evolved through traditions, practices and generations of experience. However, with the onset of new hygrothermal modeling and complementary testing capabilities, there is now a faster way of developing an understanding of the hygrothermal performance of new materials and systems. Simulation methods are flexible in that they can be used to represent a variety of changing boundary conditions and result in much more timely analysis. With rapid advances in computer technology and development of numerical methods, many computer models for hygrothermal calculations were developed during the past decade. Depending upon the complexity of the problem under consideration, such models can be based on very simple, one-dimensional, steady state method or on very complex, two-dimensional, transient method.
The hygrothermal simulation model hygIRC (Maref et al 2002a, 2002b) was used as an analytical tool to conduct parametric studies to assess the hygrothermal performance of various wall assemblies subjected to different climatic conditions. hygIRC presently uses hygrothermal property data derived from small-scale test results undertaken by Kumaran (1996) resulting in a database that was subsequently updated in recent years. It has been previously demonstrated that results obtained from these small-scale tests and those derived from the use of hygIRC are in close agreement (Kumaran and Wang 1999). The comparison of results of computer model simulations using hygIRC to those of controlled laboratory measurements performed can be found in a series of MEWS (Moisture Management in Exterior Wall Systems project) technical reports (Maref et al 2002c, 2002d). In this series of simulations hygIRC was implemented to assess the drying rate of two wall components: OSB sheathing and sheathing membrane. The drying rates of several different OSB sheathing and membranes combinations were assessed in a series of experimental sets and the results were subsequently used to help benchmark hygIRC.
This paper presents an overview of the benchmarking trials and provides the experimental approach used to benchmark hygIRC. Nominal results of a series of drying experiments on full-scale wall assemblies are given. Preliminary results are compared to those obtained from simulations on the basis of the shape of the drying curve and the time taken to establish the equilibriummoisture content.
hygIRC – ADVANCED HYGROTHERMAL SIMULATION MODEL
hygIRC is built around well-known heat, air and moisture transport equations (Fourier’s law of heat conduction, Fick’s law of diffusion of matter and Darcy’s law of fluid flow as well as Navier-Stokes equations) and corresponding equations that define the conservation of energy, mass and momentum (Maref et al 2002a, 2002b, Kumaran 2002). The governing equations implemented in hygIRC are given below. The moisture transport potentials used in the model are moisture content (MC) and vapour pressure (VP -
P
v
); for energy transfer, temperature is the driving force.( )
= −∇{
• + •}
∂ ∂ v m l m t u o ρ(1)
( )
3 2 1 4 43 4 42 1 airflow Vapor diffusion Vapor a V v ρ v P T u p δ mv -, ∇ + − = •( )
43 42 1 4 4 3 4 4 2 1 flow gravity Liquid diffusion Liquid w (u)ρ w k u T u w D o ρ ml• =− , ∇ + gWith
(
)
u S T u D ρ w k w o ∂ ∂ = ,ENERGY BALANCE
( )
( )
(
)
4 4 3 4 4 2 1 4 4 4 4 3 4 4 4 4 2 1 4 43 4 42 1 4 4 4 4 3 4 4 4 4 2 1 r heat / heat on condensati n / Evaporatio . . thaw Freeze conduction Heat heat convected Airflow t f u o ρ ice L v P T) (u, p o ρ v L T T) (u, T a V (T) a p C T a t T T) (u, p C T u, T ρ l ∂ ∂ − ∇ ∇ + ∇ ∇ + ∇ − = ∂ ∂ δ λ ρPREVIOUS WORK ON BENCHMARKING SIMULATION MODELS
There are some known attempts at providing validation of simulation models, notably from the combined efforts of the IEA Annex 24 (Hens 1996) and more recently, from work carried out in Norway at the Norwegian University of Science and Technology (Geving and Uvsløkk 2000).
The work carried out during the IEA Annex 24 focused on using inter-model comparison as one of three possible means identified to provide validation of simulation models; the other two being analytical and empirical verifications, respectively. Analytical verification is recognized as being useful for testing algorithms, but was not attempted and empirical verification was only tried for limited applications. Because of the difficulties in obtaining detailed results from experiments, verifications were restricted to summing up mass quantities such as total moisture content and amounts of condensed moisture, and thermal values such as fluxes and total energy flow. Although these comparisons provided insight into the applicability of the different models, no straightforward validation through experimentation was completed. It was however suggested that more rigorous validation through well-controlled experimentation should form the basis for future work in this area.
Geving and Thue (1996) took actual measurements and performed computer simulations of lightweight roofs from which a comparison was made between experimental results and simulations undertaken on a number of different models. Comparison was made between the moisture content at a specific location in a given wood component derived from the experiment and that obtained from the simulation. In none of the cases was there complete agreement between results for moisture content of the components obtained from either method and no explanations were provided as to why the discrepancies occurred.
Geving and Karagiozis (1996) reported on field measurements and computer simulations of the hygrothermal performance of wood frame walls in which temperature and moisture content were measured at various locations in the wall assembly. It was conjectured that the ‘overall trend’ was in good agreement between measurements and model predictions of moisture contents in wooden components although the most significant lack of agreement was the higher values obtained from simulation in the early winter
period. It was noted, however, that there existed many difficulties related to simulating field experiments in particular, modelling an adequate representation of the imperfections inherent in the real structure as well as uncertainties in the input data.
Several applications of the hygrothermal model during its development have been reported [Salonvaara and Karagiozis, 1994, Karagiozis & al., 1995, Karagiozis and Kumaran, 1997]. More recently, hygIRC has been extensively used at IRC as the primary analytical tool to conduct parametric studies to assess the hygrothermal performance of various wall assemblies exposed to different climatic conditions in North America. The intended use of the model as the principle inference model to determine the hygrothermal response of various wall assemblies in many varied climates requires that it would be adequately validated.
However, the task of validating simulation models is both difficult and time-consuming without appropriate tools from which, at least, an overall assessment of the degree to which the model reproduces the experimental results can readily be ascertained.
EXPERIMENTAL APPROACH The objectives of the work were:
1. To measure the overall hygrothermal behaviour of wood-based layers in wood-frame construction when subjected to steady state and transient hygrothermal conditions in a controlled laboratory environment.
2. To validate the model prediction of the drying rate of wood-based components.
The series of experiments have been conducted to gather data on the hygrothermal behaviour of full-scale wood-frame wall assemblies and wall components when subjected to steady and transient state climatic conditions such that the results could be used to evaluate the expected performance and predictive capabilities of hygIRC.
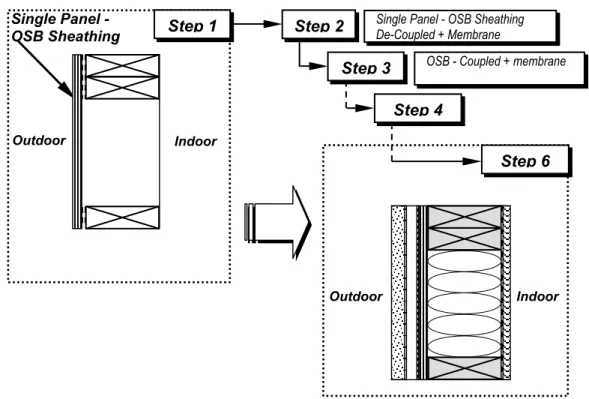
To achieve the objectives, the experimental work consisted of testing full-scale wall sections. As well, in order to verify experimental results and develop a basis for validation of hygIRC, extensive use of the model was made. The full-scale specimens consisted of wall assemblies having dimensions of 2.43 x 2.43-m. The tests were carried out in controlled conditions over a period of time sufficiently long as to permit quantifying gravimetrically, the change and rate of change (i.e. drying) of the total moisture content (MC by weight) of critical wall assembly components when in a drying process. The experimental results were compared to those predicted by hygIRC model and were reported by Maref et al (2002a, 2002b, 2002c and 2002d). The full-scale tests proceeded in a series of steps, each step comprised of evaluating the hygrothermal response of a full-scale specimen to specified controlled boundary conditions. The initial step consisted of determining the response of a single sheet of OSB to the specified conditions whereas each subsequent step had an increased level of complexity in regard to the number of components of the assembly being modeled and for which data was to be reconciled with the experiment (Figure 1).
Boundary conditions during the experiments were imposed by, on the one hand, subjecting the “outdoor” (Figure 1) portion of the wall to steady state temperature and relative humidity conditions as achieved using an environmental chamber (Envelope Environmental Exposure Facility - EEEF). The facility was
capable of maintaining temperature and relative humidity profiles to within ± 1°C and ± 2 % RH
respectively over the test period (30-50 days). Whereas for “indoor” conditions, temperature and relative humidity on the wall assembly were obtained using combined sensors and data acquisition and recording devices.
Gravimetric quantification of the total moisture content of wall assembly components over time was achieved using a precision weighing system (Maref at al 2001). The system is capable of weighing 2.43-m by 2.43-2.43-m walls having no2.43-minal weights of up to 250 kg roughly to the nearest gra2.43-m continuously over a test period. The continuous retrieval of weight data over the course of the experiment permitted determining weight loss over time of selected wall components and hence could be used to establish not only the change, but also the rate of change in the total moisture content of the component.
Figure 1 – Step-wise approach for experimental stages to evaluate hygIRC
GENERAL DESCRIPTION OF TEST SPECIMENS
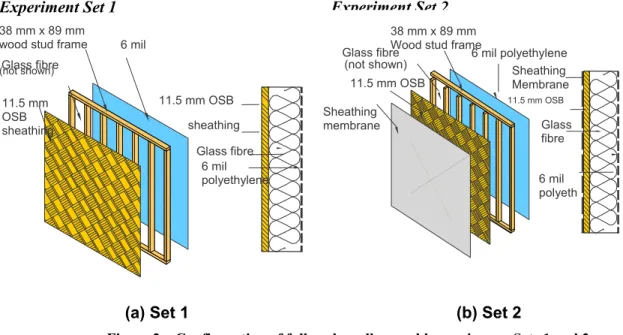
A schematic is provided in Figure 2 that depicts the various components of each of the 2 experimental sets evaluated in full-scale tests. Two diagrams are given for either set; one depicts an exploded view of the different layers in the wall assemblies whereas the other provides and vertical section of the assembly proper. The left side of the sectional views is that portion of the wall that would be subjected to exterior climate conditions (outdoor) whereas the right side would be subject to interior conditions (indoor). In both sets, specimens are fabricated using a typical wood-frame assembly in which insulation is placed in the wood stud cavities, OSB is used as sheathing board and polyethylene is used as a vapour barrier. In experimental set 2 (Figure 2b) sheathing membrane is applied to the OSB (sheathing board).
Step 1 Outdoor Indoor Single Panel - OSB Sheathing Step 6 Indoor Outdoor Step 2 Step 3 Step 4
Single Panel - OSB Sheathing De-Coupled + Membrane
Experiment Set 1
(a) Set 1
Experiment Set 2
(b) Set 2
Figure 2 – Configuration of full-scale wall assembly specimens: Sets 1 and 2. PREPARATION OF TEST SPECIMEN
The full-scale wood frame, on which the OSB sheathing was mounted, was placed within the opening of the precision weighing system frame (Maref et al 2001). To cover the 2.43-m square wood-frame specimen, two panels of OSB sheathing were used (each board 1.22-m by 2.43-m) both of which prior to being immersed in a water bath were weighed. They were then placed in a sealed bath to soak for 2 days to achieve a moisture content of at least 40% (wt.). This nominal level of moisture content was deemed sufficient for the purposes on this benchmarking exercise. Thereafter water was drained from the bath however the OSB remained in the bath for another 48 hours (sealed with tape to prevent moisture egress from the bath). This period was used to help insure that uniform moisture content in the OSB was reached prior to mounting these on the wood frame. Over this period, the moisture content of the OSB was monitored every 6 hours. Relative values of moisture content were obtained at 20 uniformly distributed points on both primary surfaces of the board using a moisture meter. These measurements provided an indication of the uniformity in wetting of the specimens. Upon removal from the sealed baths, the OSB sheathing was weighed once again to determine their initial moisture content. The initial MC for both boards is given. Subsequently, the edges of the sheathing boards were sealed with the exception of the interface between the OSB panels. This ensured that drying occurred only on the primary surfaces. The panels were then mounted on the wood frame and secured by means of screw fasteners.
INITIAL AND BOUNDARY CONDITIONS
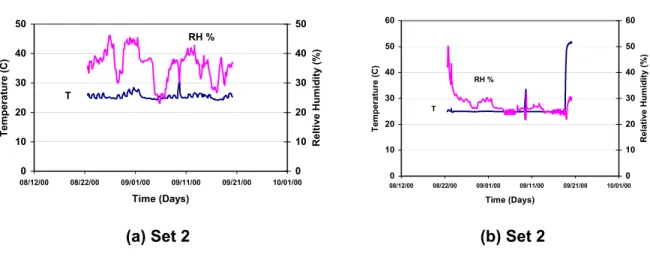
Actual boundary conditions on either side of the wall components were chosen such that rapid moisture loss in the saturated components was achieved nominally in a 4-week time frame. The simulation was performed using the temperature and relative humidity values recorded over the course of the full-scale experiments carried out within the EEEF. Figures 3 and 4 show the temperature and relative humidity profiles for interior and exterior conditions, of experimental sets 1 and 2, conducted over a period of 35 and 28 days respectively. As shown, the initial conditions include the temperature, relative humidity and the total moisture content.
MODEL IMPLEMENTATION AND SIMULATION ASSUMPTIONS
A rectangular mesh was used to represent the four layers of the wall assembly. As shown in Figure 2, the layers include sheathing membrane, sheathing board, insulation and vapor barrier (sheet of polyethylene).. This mesh was comprised of 40 nodal points along the height of the specimen (y-direction) and 26 nodal
6 mil 38 mm x 89 mm
wood stud frame
11.5 mm OSB sheathing Glass fibre (not shown) 6 mil polyethylene Glass fibre 11.5 mm OSB sheathing 6 mil polyethylene 38 mm x 89 mm
Wood stud frame 11.5 mm OSB Glass fibre (not shown) Sheathing membrane 6 mil polyeth Glass fibre 11.5 mm OSB Sheathing Membrane
points across the depth (x-direction) for a total number of 1040 nodal points for the entire representation. Membranes, located in the assemblies as shown in Figure 2b (adjacent to OSB) were each comprised of 3 equidistant nodes across their depth. The OSB (thickness 11.0-mm) had 10 equidistant nodes, the insulation 10 equidistant nodes and the vapor barrier (sheet of polyethylene) 3 equidistant nodes. In the case where the response of the OSB alone was simulated, the grid representation in this instance had an expanding mesh implying that grid density near the edges of the nodes across its depth was greater than that at the center.
The surface heat transfer coefficient was 10 W/m2°C on the left side (i.e. on the single sheet of
polyethylene) and 12 W/m2 °C on the right side (i.e. on the sheathing membrane). The moisture transfer
coefficient along the principal planar surfaces of the specimen was 4.6 x 10⁻⁷kg/m•s•Pa at the left, 5.5 x
10-7kg/m•s•Pa at the right and at the top and bottom of the specimen was 7.4 x 10⁻¹⁵ kg/m•s•Pa. Though
the experimental data provide boundary conditions at every 2 minutes the time step used in the simulation was 60 minutes. This provided ample resolution in a drying process that generally took several weeks. The simulations were conducted under the following assumptions. Liquid transport through the membranes was not modeled, i.e., the membranes were represented as vapour diffusion control elements. The contact between the membranes and the OSB sheathing was assumed to be perfect (i.e. no interstitial airspace between components). The initial moisture content (MC wt. %) of the membrane and the polyethylene were set to 0 %.
Experiment Set 1-
Environmental conditions in
laboratory (indoor)
Conditions in the Mezzanine (Test 1)
0 10 20 30 40 50 07/03/00 07/13/00 07/23/00 08/02/00 08/12/00 08/22/00 Time (Days) Tem p er atur e (C) 0 10 20 30 40 50 Reltive Humidity (%) RH % T (a) Set 1
Experiment Set 1-
Environmental conditions
within EEEF (outdoor)
Conditions in the EEEF (Test 1)
0 5 10 15 20 25 30 07/03/00 07/13/00 07/23/00 08/02/00 08/12/00 08/22/00 Time (Days) Temperature (C) 0 10 20 30 40 50 60 Relative Humidity (%) RH % T (b) Set 1
Experiment Set 2-
Environmental conditions in
laboratory (indoor)
Conditions in the Mezzanine (Test 2)
0 10 20 30 40 50 08/12/00 08/22/00 09/01/00 09/11/00 09/21/00 10/01/00 Time (Days) Tem p er atur e (C) 0 10 20 30 40 50 Reltive Hum idity (% ) RH % T (a) Set 2
Experiment Set 2
Environmental conditions
in EEEF (outdoor)
Conditions in the EEEF (Test 2)
0 10 20 30 40 50 60 08/12/00 08/22/00 09/01/00 09/11/00 09/21/00 10/01/00 Time (Days) T emp eratu re (C) 0 10 20 30 40 50 60 Relative Humidity (%) RH % T (b) Set 2
Figure 4 – Initial conditions for Experimental Set 2.
RESULTS AND DISCUSSION
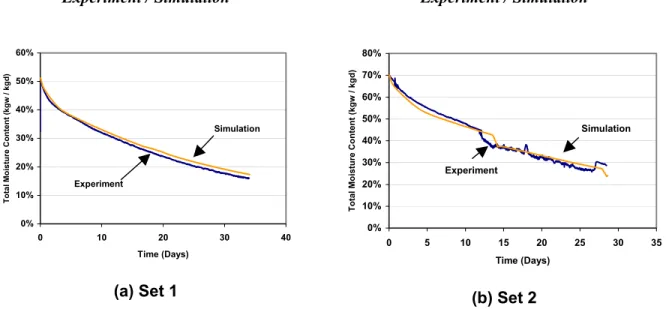
Figure 5 shows a comparison between simulated and total measured MC of OSB derived from
experimental results. For experimental set 1 the initial total MC for both boards in the assembly is 51 %. After 33 days a value of 16% MC is attained. There was a good agreement between the results obtained from simulation and those derived from experiment. In fact, the greatest difference between the simulated and the experimental results after 33 days is not more than 1.4 % MC. No adjustments to the model were made to minimize the differences between results from simulation and those of the experiment. However, differences between results may be due to a number of factors, the most significant are thought to be related to the manner in which the simulation at the surface of the OSB sheathing was implemented in the program. Specifically, the simulation assumes that there is perfect contact between the membrane and the sheathing board. In fact, in the real system, there always exists some interstitial space between these components. The net affect of this assumption is that the drying rate of the sheathing board in the simulation is decreased and this in-turn under estimates the loss in moisture content over time, as is shown in Figure 5a.
Figure 5b shows results from experimental Set 2 in which is provided a comparison of total MC of OSB as obtained from simulated results and from the experiment work. The total MC in the system was initially ca. 70 %; after 28 days it reached a value of 24%. The test was stopped after 4 weeks for practical considerations. Again, these results indicate a good agreement between results of simulation and those derived from experiment given that the difference between results is no greater than 5 % of MC. In general, the simulations were able to adequately predict the time required for the OSB sheathing to reach equilibrium moisture content. Essentially, hygIRC is clearly able to mimic the drying process in this wall assembly. In each of the experimental steps so far reported, simulation results have shown very good agreement with those derived from experiment. Indeed, the greatest difference evident when comparing the results derived from simulation and those obtained from experiment are ca. 5% of MC.
A number of these types of experiments have been made in the stepwise approach to help validate hygIRC. Although the other results are not provided here, they will be made available in subsequent publications. The results do nonetheless demonstrate the usefulness of the precision weighing system for helping evaluate key hygrothermal effects in selected wall assembly components.
Experiment / Simulation 0% 10% 20% 30% 40% 50% 60% 0 10 20 30 40 Time (Days) Tot al M o is tu re Cont ent ( kgw / kgd) Experiment Simulation (a) Set 1 Experiment / Simulation 0% 10% 20% 30% 40% 50% 60% 70% 80% 0 5 10 15 20 25 30 35 Time (Days) Tota l Mois tur e C onte n t (k gw / k gd) Experiment Simulation (b) Set 2
Figure 5 – Comparison of experiment and simulated drying results in terms of total MC (wt. %) of OSB sheathing wall components for Sets 1 and 2.
CONCLUSIONS
An overview of the benchmarking trials and the experimental approach used to benchmark hygIRC were presented. Nominal results of a series of drying experiments on full-scale wall assemblies are given. The overall agreement between experimental and simulated results is good in terms of the shape of the drying curve and the time taken to reach equilibrium moisture content.
Conclusions from these studies are definite for both full-scale tests - simulation results compare favourably with those obtained from the experiments. This suggests that the model adequately emulates the hygrothermal response of specific wood-frame assembly components, such as wood sheathing, over a range of environmental conditions to which it was subjected in the experiments. These results further enhance confidence towards the implementation of hygIRC in broader based parametric studies.
ACKNOWLEDGMENTS
The authors would like to thank Mr. M.C. Swinton for having provided many useful suggestions regarding both the experimental work and the simulation studies. Our gratitude is also extended to Dr. M.K. Kumaran for his numerous contributions towards completing this task. Thanks are also accorded to Mr. D. Richard of DOCO Microsystems and Dr. N. Krouglicof for having persevered with completing the installation, trouble shooting and commissioning of the precision weighing system. Finally, a word of appreciation to the many technical staff who helped in this endeavour and to which we owe sincere thanks for their combined efforts.
REFERENCES
Hens, H. 1996. Final report Task 1. Modeling and Common Exercises. Summary reports. International Energy Agency, Energy Conservation in Buildings and Community Systems, Annex 24 Heat, Air and Moisture Transport in New and Retrofitted Building Envelope Parts (HAMTIE).
Geving, S. and S. Uvsløkk 2000. Moisture Conditions in Timber Frame Roof and Wall Structures, Test house measurements for verification of heat-, air and moisture transfer models. Project Report 273-2000, BYGGFORSK, and Norwegian Building Research Institute, Oslo, Norway, 50p.
Geving, S. and J.V. Thue 1996, Measurements and Computer Simulations of Hygrothermal Performance of Lightweight Roofs, in: Proceedings of the 4th Symposium of Building Physics in Nordic Countries, September 9-10, Espoo, Finland, pp. 541-548.
Geving, S. and A. Karagiozis 1996, Field Measurements and Computer Simulations of the Hygrothermal Performance of Wood Frame Walls. In: Geving, S. 1997. Moisture Design of Building Constructions, Hygrothermal Analysis Using Simulation Models, Part II: Collection of papers and reports, NTNU Trondheim, Norway, Ph.D. Thesis, June 1997. Faculty of Civil and Environmental Engineering, Department of Building and Construction Engineering, NTNU, Norway.
Karagiozis, A.N., M.H. Salonvaara and M.K. Kumaran 1995. The Effect of Waterproof Coating on Hygrothermal Performance of high-rise Wall Structure. Thermal Performance of the Exterior Envelopes of Buildings VI, Clearwater, FL- USA, 1995.
Karagiozis, A. N. and M.K. Kumaran 1997. Applications of Hygrothermal Models to Building Envelope Design Guidelines. 4th Canada/Japan Housing R&D workshop. Pp. III-25-III-36, 1998. Sapporo, Japan,
Nov. 16-21, 1997.
Kumaran, M.K. 1996, Heat, Air and Moisture Transfer in Insulated Envelope Parts, International Energy Agency, IEA Annex 24, Final Report, Vol. 3, Task 3: Material Properties.
Kumaran, M.K. and J. Wang 1999. How Well Should One Know the Hygrothermal Properties of Building Materials? Proceeding of CIB W40 meeting (Prague, Czech Republic, 8/30/99), pp. 47-52, August 30, 1999.
Kumaran, M. K., "Protecting the long-term performance of building envelope components", Construction Canada, V. 39 (March) 2002, pp. 24-30.
Maref, W., Lacasse, M.A. and Kourglicof, N., "A Precision weighing system for helping assess the hygrothermal response of full-scale wall assemblies," Performance of Exterior Envelopes of Whole Building VIII: Integration of Building Envelopes (Clearwater Beach, FL, 12/2/2001), pp. 1-7, December 12, 2001 (NRCC-45202)
Maref, W. (2002a), Kumaran, M.K., Lacasse, M.A., Swinton, M.C. and van Reenen, D., "Laboratory
Measurements and Benchmarking of an Advanced Hygrothermal Model", proceeding of the 12th
International Heat Transfer Conference, August 2002 - Grenoble (France).
Maref, W. (2002b), Lacasse, M.A., Kumaran, M.K. and Swinton, M.C., "Benchmarking of the advanced hygrothermal model-hygIRC with mid-scale experiments", proceeding of the eSim 2002-IBPSA-Canada Conference, Montreal (Canada) Sept 12-13, 2002.
Maref, W. (2002c), Lacasse, M.A., Booth, D.G., Executive Summary of Research Contributions Related to Moisture Management of Exterior Wall Systems (MEWS) - Modeling, Experiments, and Benchmarking, Research Report, Institute for Research in Construction, National Research Council
Canada, 127, pp. 15, Dec, 2002 (RR-127)
Maref, W. (2002d), Lacasse, M.A., Booth, D.G., Benchmarking of IRC's Advanced Hygrothermal Model - hygIRC Using Mid- and Large-Scale Experiments, Research Report, Institute for Research in
Construction, National Research Council Canada, 126, pp. 38, Dec, 2002 (RR-126)
Salonvaara, M. and A.N. Karagiozis 1994. Moisture Transport in Building Envelopes using an Approximate Factorization Solution Method. CFD Society of Canada, Toronto, June 1-3, 1994.