Publisher’s version / Version de l'éditeur:
Vous avez des questions? Nous pouvons vous aider. Pour communiquer directement avec un auteur, consultez la
première page de la revue dans laquelle son article a été publié afin de trouver ses coordonnées. Si vous n’arrivez pas à les repérer, communiquez avec nous à PublicationsArchive-ArchivesPublications@nrc-cnrc.gc.ca.
Questions? Contact the NRC Publications Archive team at
PublicationsArchive-ArchivesPublications@nrc-cnrc.gc.ca. If you wish to email the authors directly, please see the first page of the publication for their contact information.
https://publications-cnrc.canada.ca/fra/droits
L’accès à ce site Web et l’utilisation de son contenu sont assujettis aux conditions présentées dans le site LISEZ CES CONDITIONS ATTENTIVEMENT AVANT D’UTILISER CE SITE WEB.
ACS Applied Nano Materials, 2019-03-28
READ THESE TERMS AND CONDITIONS CAREFULLY BEFORE USING THIS WEBSITE.
https://nrc-publications.canada.ca/eng/copyright
NRC Publications Archive Record / Notice des Archives des publications du CNRC :
https://nrc-publications.canada.ca/eng/view/object/?id=11bf4f99-a2f8-4b1e-ac3c-8bca5dd4656f https://publications-cnrc.canada.ca/fra/voir/objet/?id=11bf4f99-a2f8-4b1e-ac3c-8bca5dd4656f This publication could be one of several versions: author’s original, accepted manuscript or the publisher’s version. / La version de cette publication peut être l’une des suivantes : la version prépublication de l’auteur, la version acceptée du manuscrit ou la version de l’éditeur.
For the publisher’s version, please access the DOI link below./ Pour consulter la version de l’éditeur, utilisez le lien DOI ci-dessous.
https://doi.org/10.1021/acsanm.9b00057
Access and use of this website and the material on it are subject to the Terms and Conditions set forth at Quality assessment of bulk Boron nitride nanotubes for advancing research, commercial and industrial applications
Martinez Rubi, Yadienka; Jakubek, Zygmunt J.; Chen, Maohui; Zou, Shan; Simard, Benoit
Yadienka Martinez Rubi, Zygmunt J. Jakubek, Maohui Chen, Shan Zou, and Benoit Simard
ACS Appl. Nano Mater., Just Accepted Manuscript • DOI: 10.1021/acsanm.9b00057 • Publication Date (Web): 28 Mar 2019
Downloaded from http://pubs.acs.org on April 4, 2019
Just Accepted
“Just Accepted” manuscripts have been peer-reviewed and accepted for publication. They are posted online prior to technical editing, formatting for publication and author proofing. The American Chemical Society provides “Just Accepted” as a service to the research community to expedite the dissemination of scientific material as soon as possible after acceptance. “Just Accepted” manuscripts appear in full in PDF format accompanied by an HTML abstract. “Just Accepted” manuscripts have been fully peer reviewed, but should not be considered the official version of record. They are citable by the Digital Object Identifier (DOI®). “Just Accepted” is an optional service offered to authors. Therefore, the “Just Accepted” Web site may not include all articles that will be published in the journal. After a manuscript is technically edited and formatted, it will be removed from the “Just Accepted” Web site and published as an ASAP article. Note that technical editing may introduce minor changes to the manuscript text and/or graphics which could affect content, and all legal disclaimers and ethical guidelines that apply to the journal pertain. ACS cannot be held responsible for errors or consequences arising from the use of information contained in these “Just Accepted” manuscripts.
Quality Assessment of Bulk Boron Nitride
Nanotubes for Advancing Research, Commercial
and Industrial Applications
Yadienka Martinez Rubi,†* Zygmunt J. Jakubek,‡ Maohui Chen,‡ Shan Zou,‡ Benoit
Simard†
†Security and Disruptive Technologies Research Center, National Research Council
Canada, Ottawa, Ontario, 100 Sussex Drive, K1A 0R6, Canada ‡Metrology Research
Center, National Research Council Canada, Ottawa, Ontario, 100 Sussex Drive, K1A
0R6, Canada
* yadienka.martinez-rubi@nrc-cnrc.gc.ca
Boron nitride nanotubes, purity, quality, P3HT, quality index, absorption spectroscopy
3 4 5 6 7 8 9 10 11 12 13 14 15 16 17 18 19 20 21 22 23 24 25 26 27 28 29 30 31 32 33 34 35 36 37 38 39 40 41 42 43 44 45 46 47 48 49 50 51 52 53 54 55 56 57
ABSTRACT: Evaluating the quality of nanomaterials is essential for both basic research
and industrial applications. Here, we describe a methodology for assessment of relative
quality of boron nitride nanotube (BNNT) materials by absorption spectroscopy of
regionrandom poly(3-hexyl-thiophene) (rra-P3HT) aggregates on BNNTs dispersed in
chloroform. The strong selective – interaction between rra-P3HT and nanotubes
combined with distinctive visual and spectroscopic changes allows a practical procedure
for relative evaluation of BNNT external surface area and surface quality. The method
calls first for the identification of the sample-specific polymer loading saturation point,
which corresponds to the maximum BNNT surface polymer coverage in the sample. The
sample quality (defined as the combination of sample purity and BNNT wall defect
density) is determined from the structure and intensity of the absorption spectrum, which
depend on the morphology and the total amount of rra-P3HT adsorbed on BNNT
samples. This methodology for quality assessment is critical for accelerating the
development of new, efficient purification strategies for bulk BNNT materials and
advancing the investigation of BNNT properties and industrial applications.
3 4 5 6 7 8 9 10 11 12 13 14 15 16 17 18 19 20 21 22 23 24 25 26 27 28 29 30 31 32 33 34 35 36 37 38 39 40 41 42 43 44 45 46 47 48 49 50 51 52 53 54 55 56 57
Boron nitride nanotubes, purity, P3HT, absorption spectroscopy
INTRODUCTION
One of the major challenges in characterization of nanomaterials is quality assessment.
The lack of reliable methods makes it difficult if not impossible to reproduce and compare
results, let alone use the material in applications where the presence of impurities could
have catastrophic effects on outcomes. The field of carbon nanotubes (CNTs) has been
plagued with this persisting important issue for more than 25 years. A similar issue exists
with the emerging boron nitride nanotubes (BNNTs), a structural analogue to CNTs.
Owing to the polarity of the B-N bond, the bonding in BNNTs has some ionic character
which leads to important property differences with CNTs. Whereas the mechanical and
thermal properties are similar, electronic and optical ones are different. In particular,
BNNT is a wide band gap insulator, thermally stable in air up to 900 oC, resistant to pure
chlorine gas up to at least 1100 oC and totally transparent to visible light. Due to the
presence of boron, BNNTs also have the ability to absorb neutron radiation. All these
3 4 5 6 7 8 9 10 11 12 13 14 15 16 17 18 19 20 21 22 23 24 25 26 27 28 29 30 31 32 33 34 35 36 37 38 39 40 41 42 43 44 45 46 47 48 49 50 51 52 53 54 55 56 57
characteristics have attracted research interest for different applications of BNNTs in
multifunctional structural composites and electronic devices.1,2,3 Despite limited body of
research and some inconclusive results, BNNTs are also generally regarded to be
biologically compatible and suitable for various biomedical applications.4 Current BNNT
bulk production methods generate significant amount of impurities such as boron and BNx
derivatives. Unlike for produced CNT materials, the majority of impurities in
as-produced BNNT materials can be removed by various purification methods. However,
the differentiation between BNNTs and BN-containing impurities by common techniques
such as Fourier transformed infrared (FTIR), ultraviolet-visible (UV–Vis) absorption and
Raman spectroscopies is difficult as they both show similar spectroscopic signatures.
Scanning electron microscopy (SEM) and transmission electron microscopy (TEM) are
the most common characterization methods used to evaluate purity of BNNT materials
but they suffer from a variety of limitations. In particular, SEM and TEM analyses are labor
intensive and rarely representative of the bulk material. Furthermore, availability of a new
robust quality assessment method is of great importance as complete characterization of
3 4 5 6 7 8 9 10 11 12 13 14 15 16 17 18 19 20 21 22 23 24 25 26 27 28 29 30 31 32 33 34 35 36 37 38 39 40 41 42 43 44 45 46 47 48 49 50 51 52 53 54 55 56 57
nanomaterials is usually best achieved by a combination of multiple characterization
techniques.
Recently, we have shown that regiorandom poly(3-hexyl-thiophene) (rra-P3HT)
self-assembles on BNNTs dispersed in chloroform, changing its conformation from coil-like in
solution to rod-like of polymer chains stretched along BNNTs.5 The conformational
change is spontaneous and is accompanied by distinctive and pronounced colorimetric
and spectroscopic changes. While a solution of free rra-P3HT in chloroform appears
yellow/orange, fully dispersed rra-P3HT/BNNT in chloroform is magenta/purple colored.
Correspondingly, the absorption spectrum changes from a broad unstructured band for
the free polymer in solution to a red shifted progression of partially resolved vibronic
bands for the suspension of rra-P3HT/BNNT hybrids. These effects were not observed in
the presence of hexagonal boron nitride (h-BN), which is the feedstock and one of the
main impurities present in BNNT materials produced by the Hydrogen-Assisted Boron
nitride nanotube Synthesis (HABS) process.6 The quality of nanotube materials is
determined by two parameters: purity and defect density. Purity can be defined as a
fraction of nanotubes in a sample, and the defect density can be defined as the
3 4 5 6 7 8 9 10 11 12 13 14 15 16 17 18 19 20 21 22 23 24 25 26 27 28 29 30 31 32 33 34 35 36 37 38 39 40 41 42 43 44 45 46 47 48 49 50 51 52 53 54 55 56 57
abundance of structural defects on the nanotube walls.7 Here, we show that rra-P3HT
hybridization with BNNTs facilitates a simple spectroscopic and colorimetric method to
estimate the relative quality of BNNT materials produced by the HABS process, an
essential breakthrough to accelerate the development of applications. We demonstrate
that the selective rra-P3HT interaction with BNNTs can be used to determine relative
BNNT material quality by measurement and analysis of extinction spectra of fully
dispersed rra-P3HT/BNNT suspensions at or near the polymer coverage saturation point,
which can be determined by observation of suspension color change or measurement of
extinction spectra during dropwise addition of rra-P3HT solution.
EXPERIMENTAL SECTION
Synthesis and purification: BNNTs were synthesized by the Hydrogen-Assisted Boron
nitride nanotube Synthesis (HABS) process as described in previous publications.6, 8
Small diameter (~5 nm) BNNTs were produced in high yield directly from hexagonal boron
nitride (h-BN) powder (99.5%, avg. 70 nm, MK-hBN-N70, M K Impex Corp.).
Regiorandom-P3HT (rra-P3HT; MW = 60–90 kD) and regioregular P3HT (rr-P3HT; MW
3 4 5 6 7 8 9 10 11 12 13 14 15 16 17 18 19 20 21 22 23 24 25 26 27 28 29 30 31 32 33 34 35 36 37 38 39 40 41 42 43 44 45 46 47 48 49 50 51 52 53 54 55 56 57
= 96 kD, head-to-tail regiospecific conformation > 96%) were obtained from Rieke Metals,
Inc. HPLC grade chloroform (OmniSolv) was purchased from EMD Millipore Corporation.
The as-produced BNNT material (R-BNNT) was purified through different thermal and
solvent treatments to produce three different purified materials (P-BNNTs). P-BNNT-1
material was obtained by purification treatments with chlorine gas at 750 oC as described
recently.9 The purified material (gram scale) was dried and homogenized using a
commercial powder grinder. P-BNNT-2 was obtained from P-BNNT-1 after acetone and
water washes. P-BNNT-3 material was purified by a process similar to that used to obtain
P-BNNT-1 except that the chlorine treatment was done in two steps: first at 750 C and then at 850 C. Subsequently, the sample was washed repeatedly with acetone to
remove leftover impurities. The present study provides comparison of these three
P-BNNTs (P-BNNT-1, P-BNNT-2 and P-BNNT-3).
Thin films: rra-P3HT and rr-P3HT thin films were prepared by drop casting a 0.5 mg/mL
solution on a quartz plate and air drying at room temperature.
rra-P3HT methodology for relative quality assessment: The three P-BNNT samples
(5.00 ± 0.01 mg each) were prepared and analyzed concurrently. In cases where the
P-3 4 5 6 7 8 9 10 11 12 13 14 15 16 17 18 19 20 21 22 23 24 25 26 27 28 29 30 31 32 33 34 35 36 37 38 39 40 41 42 43 44 45 46 47 48 49 50 51 52 53 54 55 56 57
BNNT material was in a compact form, as opposite to a loose powder, the sample was
first gently ground using an agate mortar with a small volume of chloroform and then
completely transferred to a 100 mL bottle. The methodology is schematically represented
in Scheme 1. P-BNNT suspensions in chloroform (0.1 mg/mL) were bath sonicated
(Cole-Parmer 8891) for 15 min to 30 min until no large particles were visible (e.g. BNNT
suspension in Scheme 1). A freshly prepared solution of rra-P3HT (0.5 mg/mL) was
added gradually in 200 µL aliquots to the P-BNNT suspensions (step1). Bath sonication
was applied for 10 min after each addition (step 2), while maintaining the bath temperature
in the 22 C to 25 C range, to obtain a stable dispersion of rra-P3HT/P-BNNT hybrids. The addition of rra-P3HT solution was stopped when the color of the suspension
appeared to change from purple to brown and the corresponding extinction spectra begun
to show increasing absorbance in the region of the absorption band of the free rra-P3HT
(near 432 nm). This color change is indicative of an appearance of free rra-P3HT in
solution that takes place when rra-P3HT added to the suspension in excess of the
saturation point remains free in a coil-like conformation, unattached to BNNTs.5 The
polymer coverage saturation point (S) is defined as the rra-P3HT to P-BNNT mass ratio
3 4 5 6 7 8 9 10 11 12 13 14 15 16 17 18 19 20 21 22 23 24 25 26 27 28 29 30 31 32 33 34 35 36 37 38 39 40 41 42 43 44 45 46 47 48 49 50 51 52 53 54 55 56 57
corresponding to the onset of the color change. At this point, S provides a first estimate
of relative quality: a higher S value indicates a BNNT sample of higher quality. Next, the
rra-P3HT/P-BNNT suspension with a minimum amount of rra-P3HT in excess of the
saturation point was filtered through a PTFE membrane (1.2 µm pore size, Sartorius
Stedim) and rinsed with 15 mL of chloroform to remove free rra-P3HT. A minimum amount
or rra-P3HT in excess is recommended to facilitate the effective removal of non-attached
(free) polymer by filtration. AFM and TEM verified that no detectable amount of BNNTs
passes through the filter, which makes subsequent analyses possible. The wet, purple
rra-P3HT/P-BNNT material recovered on the membrane filter was immediately
transferred to a 100 mL bottle and re-suspended in 50 mL of chloroform aided by bath
sonication for 15 min.
3 4 5 6 7 8 9 10 11 12 13 14 15 16 17 18 19 20 21 22 23 24 25 26 27 28 29 30 31 32 33 34 35 36 37 38 39 40 41 42 43 44 45 46 47 48 49 50 51 52 53 54 55 56 57
Scheme 1. Representation of the rra-P3HT methodology for quality assessment of
P-BNNT materials.
Absorption spectroscopy: The rra-P3HT/BNNT suspensions were characterized at
various stages by ultraviolet-visible (UV–Vis) absorption spectroscopy. Spectra were
recorded with a Cary 5000 spectrophotometer (Agilent) using 10 mm path length quartz
cuvettes.
Analysis of rra-P3HT/BNNT absorption bands: Absorption bands of rra-P3HT/BNNT
hybrid in suspension were observed superimposed on a sample dependent scattering
background strongly increasing towards the blue and UV. To model the scattering
background, various levels of dispersion of BNNT bundles and presence of impurity
h-3 4 5 6 7 8 9 10 11 12 13 14 15 16 17 18 19 20 21 22 23 24 25 26 27 28 29 30 31 32 33 34 35 36 37 38 39 40 41 42 43 44 45 46 47 48 49 50 51 52 53 54 55 56 57
BN particles of various size and morphology were considered. We concluded that while
more precise description of scattering may be developed in the future when sample
morphology is better understood, a simple approximation of the scattering component of
the extinction spectra by a function inversely proportional to the to the fourth power of
wavelength,
�����=� + � �4 , ��. (1)
was adequate for reasonably pure samples including those analyzed in this project. The
scattering model represented by Eq. 1 was consistent with the Rayleigh scattering
approximation which appeared to be approximately valid for suspensions of our samples
in the vicinity or above the saturation point. The parameters a and b were adjusted as
follows: a was set at the average absorbance value at the long wavelength end of the
spectrum, typically in the vicinity of 1800 nm, where the rra-P3HT absorption was
expected to be the smallest, and b was set at the maximum value resulting in a
non-negative corrected absorbance in the entire wavelength range in which the extinction
spectrum was measured, typically from 250 nm to 1300 nm or 1800 nm. The parameter
a mostly accounted for a small detector drift and other instrumental effects usually not
3 4 5 6 7 8 9 10 11 12 13 14 15 16 17 18 19 20 21 22 23 24 25 26 27 28 29 30 31 32 33 34 35 36 37 38 39 40 41 42 43 44 45 46 47 48 49 50 51 52 53 54 55 56 57
exceeding 0.005 absorbance unit and for practical reasons could be set in most cases at
zero. Pure absorption spectrum of rra-P3HT/BNNT was extracted by subtracting the
scattering component from the extinction spectrum. The above-presented simple
procedure was expected to be a less accurate description of the scattering component at
the short wavelength limit, but sufficiently accurate in the range of rra-P3HT/BNNT
absorption bands to the red of 500 nm. While the scattering correction procedure could
be avoided entirely by measuring the absorption spectrum with an integrating
sphere-equipped UV-Vis spectrophotometer or an equivalent dedicated instrument, such
accessories and instruments are not always available in general characterization
laboratories.
Correlated Atomic Force Microscopy (AFM) and polarized excitation fluorescence
microscopy imaging: Samples for correlated AFM and polarized excitation fluorescence
microscopy were prepared by spin-coating dilute rra-P3HT/BNNT suspensions (2 g/mL) on piranha-cleaned microscope cover glass (#1, Fisherbrand, Fisher Scientific).
Correlated AFM and polarized excitation fluorescence microscopy images were obtained
3 4 5 6 7 8 9 10 11 12 13 14 15 16 17 18 19 20 21 22 23 24 25 26 27 28 29 30 31 32 33 34 35 36 37 38 39 40 41 42 43 44 45 46 47 48 49 50 51 52 53 54 55 56 57
using the Nanowizard II BioAFM (JPK Instruments, Berlin, Germany) mounted on an
Olympus IX81 inverted optical microscope with an objective-based (UAPO 150 objective, 1.45 NA, oil TIRFM, Olympus) polarized excitation fluorescence setup. The
system was enclosed in an in-house fabricated acoustic isolation box and seated on a
Micro 60 active vibration isolation table (Halcyonics/Accurion GmbH, Goettingen,
Germany). AFM images were recorded in ambient using an intermittent contact mode
with silicon AFM tip (HQ:XSC11/AL BS, MicroMasch; typical radius 8 nm, 42 N/m spring
constant). First, large size images (100 µm by 100 µm) were recorded to verify the overall
morphology and homogeneity of the rra-P3HT/BNNT samples. Next, a series of 10 µm
by 10 µm to 40 µm by 40 µm images were acquired at 512 pixel by 512 pixel resolution,
with scan rates ranging (0.8–1.0) Hz. Images were flattened using a first-order polynomial
fit by the JPKSPM Data Processing software. Polarized excitation fluorescence
microscopy images were obtained by illuminating the samples with an LD-pumped
all-solid-state 543 nm laser (MGL-III-543, 30 mW, New Industries Optoelectronics Tech. Co.,
Ltd., Changchun, China). rra-P3HT/BNNT samples were imaged by polarized excitation
fluorescence microscopy with a variable direction of polarization in the sample plane
3 4 5 6 7 8 9 10 11 12 13 14 15 16 17 18 19 20 21 22 23 24 25 26 27 28 29 30 31 32 33 34 35 36 37 38 39 40 41 42 43 44 45 46 47 48 49 50 51 52 53 54 55 56 57
controlled by a half wave plate (WPH05M-546, Thorlabs) installed in the incident beam
path. Fluorescence was collected by the objective (150) and passed through a Semrock FF01-593/40-25 fluorescence filter, resulting in selective detection of the fluorescence in
the (570–615) nm range. An optional 1.6 lens was inserted in the detection path for a 240 total magnification of the sample image. The fluorescence images were recorded using a Photometrics Evolve 512 Delta EMCCD camera with the excitation beam
polarization rotated in 20 degree steps in the (0–180) degree range with respect to the X
axis (left-to-right direction as observed by the analyst in front of the microscope). The
fluorescence intensity variation with excitation polarization was analyzed using a custom
written ImageJ macro set. The stack of images with varying excitation polarization angle
was automatically scanned voxel-by-voxel and fluorescence intensity as a function of the
polarization angle was fitted to Eq. 2
�(�) = ����+2�cos2(� ― �) , ��. (2)
where ���� is a background corrected minimum voxel intensity, A is the fluorescence
intensity peak modulation amplitude, is the excitation light polarization angle, and is � �
the excitation dipole moment angle. Fits yielded the best estimates for the parameters for
3 4 5 6 7 8 9 10 11 12 13 14 15 16 17 18 19 20 21 22 23 24 25 26 27 28 29 30 31 32 33 34 35 36 37 38 39 40 41 42 43 44 45 46 47 48 49 50 51 52 53 54 55 56 57
each voxel. In addition, a fluorescence intensity modulation depth parameter, � = � ����
was calculated, where ���� is the background corrected average fluorescence intensity for
each voxel.
Scanning electron microscopy (SEM): Samples for SEM were prepared by drop-casting
a dispersion of BNNTs in CHCl3 on the SEM pin stub. Images were recorded with a Hitachi
High Technologies S-4800v scanning electron microscope.
Dynamic vapour sorption (DVS): Adsorption and desorption isotherms for octane and
water vapours were measured at 25 °C on a dynamic vapor sorption (DVS) system (DVS
Advantage Instrument from Surface Measurements Systems). This instrument
gravimetrically measures uptake and loss of water or organic solvent vapor by a material.
Approximately 10 mg of sample was loaded onto the pan balance, before running the
software controlled sequence that held the sample at 0 % relative humidity (dried
nitrogen) and 100 °C for 10 hours to remove any surface moisture. Then, the relative
vapour pressure, p/po, where p and po are the equilibrated and saturation pressures of
the adsorptive, respectively, was increased from 0% up to 95% according to the following
profile: 2.5% increments below 10% p/po, 5% increments between 10% p/po and 20%
3 4 5 6 7 8 9 10 11 12 13 14 15 16 17 18 19 20 21 22 23 24 25 26 27 28 29 30 31 32 33 34 35 36 37 38 39 40 41 42 43 44 45 46 47 48 49 50 51 52 53 54 55 56 57
p/po and 10% increments above 20% p/po. The sample was allowed to equilibrate (dm/dt
≤ 0.0002%/min) at each p/po stage before progressing to the next. The Brunauer-Emmet-Teller (BET) equation was applied to the octane adsorption isotherm over the 0.03–0.3
relative p/po pressure range, to determine the specific BET surface area, SBET.
RESULTS AND DISCUSSION
P3HT, one of the most extensively studied semiconducting conjugated polymer,10 is an
effective dispersant for BNNTs that binds to the nanotubes by - interaction to produce stable suspensions.5 Self-assembly of the polymer chains on the BNNT surface is
immediately evident through a color change (Figure 1) and appearance of significantly
red shifted, partially resolved absorption bands (Figure S1) with distinguished features at
or near 603 nm, 555 nm and 520 nm. These features are characteristic of anisotropic
polymer aggregates comprising ordered π-π stacked chain segments.11,12 The three
vibronic peaks (An-0, where n refers to the number of vibrational quanta coupled to the
excited electronic state) are assigned to A0–0, A1-0, and A2-0 transitions, respectively.8
3 4 5 6 7 8 9 10 11 12 13 14 15 16 17 18 19 20 21 22 23 24 25 26 27 28 29 30 31 32 33 34 35 36 37 38 39 40 41 42 43 44 45 46 47 48 49 50 51 52 53 54 55 56 57
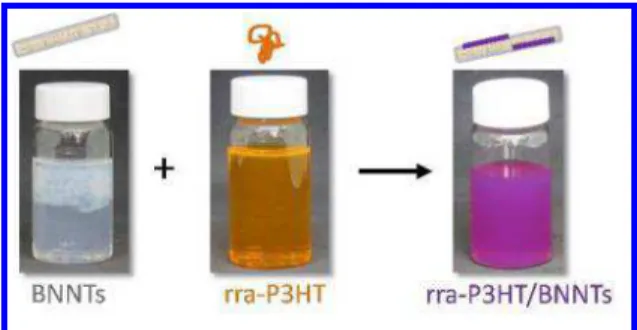
Figure 1. Cartoon representation with representative sample images of BNNTs, rra-P3HT
and rra-P3HT/BNNT in CHCl3.
A thin film spectrum of rra-P3HT shown in Figure 2a consists of a broad and featureless
band (maximum at ~457 nm). This is because rra-P3HT forms mainly amorphous
(disordered) layers due to the weak tendency for intermolecular packing. The irregular
distribution of alkyl side chains in rra-P3HT forces the thiophene units to twist away from
planarity, hindering crystallization.13 However, the absorption spectra of rra-P3HT/BNNT
hybrids show resolved structure similar to that of regioregular-P3HT (rr-P3HT) films
(Figure 2a) and rr-P3HT nanowhiskers.14 Unlike rra-P3HT, rr-P3HT (with a regular head
to tail configuration) can readily undergo self-assembly, in both solution and thin film state,
resulting in highly ordered two- and three-dimensional polymer architectures.15
Aggregation in rr-P3HT is driven by strong π–π interactions perpendicular to the
3 4 5 6 7 8 9 10 11 12 13 14 15 16 17 18 19 20 21 22 23 24 25 26 27 28 29 30 31 32 33 34 35 36 37 38 39 40 41 42 43 44 45 46 47 48 49 50 51 52 53 54 55 56 57
conjugated backbone, as well as by hydrophobic interactions of the side chain, forming a
complex microstructure of crystalline and amorphous domains. The absorption spectrum
of P3HT/BNNT hybrids indicates that strong - interaction between BNNTs and rra-P3HT inhibits polymer chain twisting resulting in polymer planarization along BNNTs with
extended conjugation which, in turn, promotes formation of ordered rra-P3HT aggregates
(i.e. π-π stacked layers).
3 4 5 6 7 8 9 10 11 12 13 14 15 16 17 18 19 20 21 22 23 24 25 26 27 28 29 30 31 32 33 34 35 36 37 38 39 40 41 42 43 44 45 46 47 48 49 50 51 52 53 54 55 56 57
Figure 2. Absorption spectra of rra-P3HT (orange line) and rr-P3HT (purple line) films
prepared by drop casting (a); extinction spectra of a rra-P3HT/BNNT suspension in CHCl3
at increasing rra-P3HT to BNNT mass ratio (indicated by the numbers in parentheses)
(b); cartoon representation and sample images of rra-P3HT/BNNT (center to right) and
rra-P3HT/h-BN (center to left) suspensions at increasing rra-P3HT to BNNT or h-BN mass
ratio, respectively (c).
It was found that with continuous addition of rra-P3HT (Figure 2b and 2c), rra-P3HT
self-assembles stretched along nanotubesuntil all available BNNT surface is covered by
the polymer5 (e.g. at ~0.08 rra-P3HT to BNNT mass ratio in Figure 2b and 2c). Further
addition leaves rra-P3HT free in solution in a coil-like conformation and the color of the
suspension appears to change from purple to brown, a result of color mixing (orange
colored free rra-P3HT solution admixed to purple colored rra-P3HT/BNNT dispersion).
Concurrently, the corresponding absorption spectrum shows increasing absorption at
3 4 5 6 7 8 9 10 11 12 13 14 15 16 17 18 19 20 21 22 23 24 25 26 27 28 29 30 31 32 33 34 35 36 37 38 39 40 41 42 43 44 45 46 47 48 49 50 51 52 53 54 55 56 57
~432 nm, which is in the region of the absorption band of the free rra-P3HT in chloroform
(Figure 2b, the 0.15 mass ratio curve).
The main impurities in BNNTs produced by the HABS process are boron and h-BN
derivatives originating either from incompletely vaporized feedstock or produced as
by-products of the HABS process. Other BNH and amorphous BN species are also known
to be present.2 The purification process employed here removes essentially all of these
impurities except h-BN derivatives. We examined the interaction of rra-P3HT with h-BN
(the same used as feedstock) in chloroform and observed that, in contrast to BNNTs, no
color change (Figure 2c) nor absorption spectrum shift/change5 was observed upon
addition of the orange colored rra-P3HT solution to a suspension of h-BN flakes in
chloroform. Moreover, unlike for BNNTs, practically all rra-P3HT could be removed by
filtration of the rra-P3HT/h-BN suspension (Figure S2). These experiments indicate that
interaction of rra-P3HT with h-BN is much weaker than with BNNTs. It appears that h-BN
does not induce planarization of P3HT chains and, consequently, no ordered
rra-P3HT aggregation is promoted that would lead to distinctive color or spectroscopic
changes like those observed for BNNTs. In the same way, Ma et al. have reported only a
3 4 5 6 7 8 9 10 11 12 13 14 15 16 17 18 19 20 21 22 23 24 25 26 27 28 29 30 31 32 33 34 35 36 37 38 39 40 41 42 43 44 45 46 47 48 49 50 51 52 53 54 55 56 57
blue shift in the absorption spectrum of exfoliated boron nitride nanosheets (BNNSs)
non-covalently functionalized with P3HT.16 To the best of our knowledge, ordered rra-P3HT
aggregates with such distinctive vibronic features in the absorption spectrum have only
been observed in the presence of BNNTs. Similar experiments evaluating the interaction
of rr-P3HT with h-BN (Figure S3) and BNNTs5 showed formation of ordered rr-P3HT
aggregates in both materials. The above results suggest that the strong and selective
interaction of rra-P3HT with BNNTs and the associated visual and spectroscopic effects
could be used to develop a method for relative quality assessment of BNNTs.
3 4 5 6 7 8 9 10 11 12 13 14 15 16 17 18 19 20 21 22 23 24 25 26 27 28 29 30 31 32 33 34 35 36 37 38 39 40 41 42 43 44 45 46 47 48 49 50 51 52 53 54 55 56 57
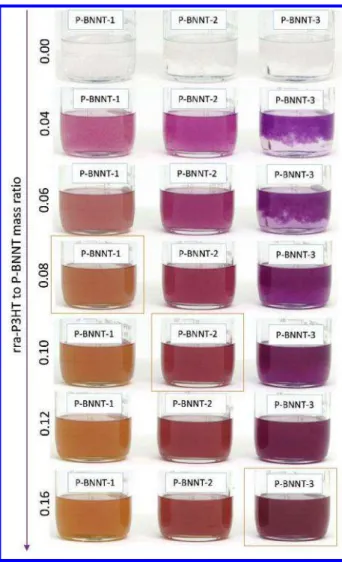
Figure 3. Images of samples of three different P-BNNT materials (P-BNNT-1, P-BNNT-2
and P-BNNT-3) in CHCl3 at increasing rra-P3HT to P-BNNT mass ratio (0.04 to 0.16).
Orange rectangle indicates the mass ratio just above the polymer coverage saturation
point (S). All samples contain the same initial mass (5.00 ± 0.01 mg) of P-BNNT material
at a 0.1 mg/mL concentration. 3 4 5 6 7 8 9 10 11 12 13 14 15 16 17 18 19 20 21 22 23 24 25 26 27 28 29 30 31 32 33 34 35 36 37 38 39 40 41 42 43 44 45 46 47 48 49 50 51 52 53 54 55 56 57
The rra-P3HT methodology was applied, in combination with other characterization
techniques, to BNNT materials purified by different procedures in order to demonstrate
the feasibility of the method. Figure 3 includes images of samples of three P-BNNT
materials (P-BNNT-1, P-BNNT-2 and P-BNNT-3) at increasing rra-P3HT to P-BNNT
mass ratios prepared as described in the experimental section (rra-P3HT methodology
for quality assessment). As mentioned above, when the rra-P3HT to P-BNNT mass ratio
exceeds the polymer coverage saturation point (S), the suspension changes its color from
purple to brown and the corresponding absorption spectrum begins to show increased
absorption in the region of the free rra-P3HT band. Absorption spectra for
rra-P3HT/P-BNNT-1, rra-P3HT/P-BNNT-2 and rra-P3HT/P-BNNT-3 near and above the saturation
point are presented in Figure 4 a-c, respectively. Figures 3 and 4 (a-c) clearly show that
different amounts of rra-P3HT were required to “saturate” the coverage for each of the
three P-BNNT materials. The absorption spectra in Figure 4 (a-c) also show that the
intensity of the partially resolved vibronic bands (with maxima at or near 603 nm, 555 nm
and 520 nm) is also different for each material following the trend: 3>
P-BNNT-2> P-BNNT-1. The rra-P3HT methodology suggests that a higher rra-P3HT to BNNT
3 4 5 6 7 8 9 10 11 12 13 14 15 16 17 18 19 20 21 22 23 24 25 26 27 28 29 30 31 32 33 34 35 36 37 38 39 40 41 42 43 44 45 46 47 48 49 50 51 52 53 54 55 56 57
mass ratio at saturation and a higher intensity of the partially resolved bands in the
absorption spectrum implies higher BNNT purity (higher BNNT available surface area)
since only the BNNT surface significantly induces rra-P3HT planarization and subsequent
ordered aggregation. Table 1 summarizes the lower and the upper limits of the saturation
point for each BNNT samples, with the corresponding specific BET surface areas of
P-BNNT samples determined from octane adsorption isotherms. In general, there was a
correlation between the results obtained by the rra-P3HT results and the surface area
trend. 3 4 5 6 7 8 9 10 11 12 13 14 15 16 17 18 19 20 21 22 23 24 25 26 27 28 29 30 31 32 33 34 35 36 37 38 39 40 41 42 43 44 45 46 47 48 49 50 51 52 53 54 55 56 57
Figure 4. Extinction spectra of rra-P3HT/BNNT hybrids with rra-P3HT to P-BNNT mass
ratios approximately equal to the polymer saturation points (top panel) and SEM images
of BNNT samples (bottom panel) for the 1 (a, d), 2 (b, e), and
P-BNNT-3 (c, f) samples.
Direct visualization of impurities can be obtained by imaging the samples using SEM.
Figure 4 shows typical SEM images (Figure 4 d, e, f) obtained for the P-BNNT samples.
Additional images are shown in the supporting information in Figures S4 and S5. The
trends observed from the rra-P3HT tests (Figures 3 and 4a-c) are consistent with the SEM
analysis. P-BNNT-1 with the lowest rra-P3HT to BNNT ratio at the saturation point and
the lowest absorption in the region of the spectrum corresponding to aggregated
rra-P3HT appears to contain significantly higher amount of impurities such as non-tubular
structures indicated in Figure 4d. Comparison of absorption spectra of
rra-P3HT/P-BNNT-2 and rra-P3HT/P-BNNT-3 prompts to a significantly higher purity of P-BNNT-3 since
absorbance is higher by a factor of nearly 2 (Figures 4c and 5). However, only slightly
3 4 5 6 7 8 9 10 11 12 13 14 15 16 17 18 19 20 21 22 23 24 25 26 27 28 29 30 31 32 33 34 35 36 37 38 39 40 41 42 43 44 45 46 47 48 49 50 51 52 53 54 55 56 57
higher purity for P-BNNT-3 would be inferred from examination of corresponding SEM
images. This illustrates one of the limitations of SEM for assessing the quality of bulk
samples. Analysis of the features and characteristics of the absorption spectra of
rra-P3HT/P-BNNT samples sheds light on the observed differences.
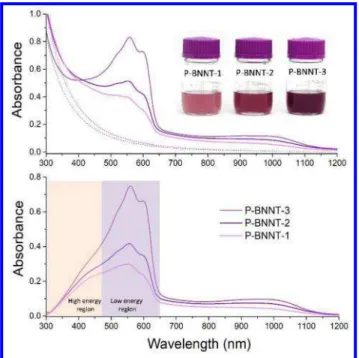
Figure 5. Extinction spectra (solid lines), scattering background (dotted lines) calculated
using equation 1, and sample images of three rra-P3HT/BNNT hybrid materials in CHCl3
after removal of free rra-P3HT (a). Absorption spectra extracted from the extinction
spectra by subtraction of the scattering background (b).
3 4 5 6 7 8 9 10 11 12 13 14 15 16 17 18 19 20 21 22 23 24 25 26 27 28 29 30 31 32 33 34 35 36 37 38 39 40 41 42 43 44 45 46 47 48 49 50 51 52 53 54 55 56 57
Figure 5a shows sample images and extinction spectra of the rra-P3HT/P-BNNT
suspensions recorded after filtration to remove excess (free) rra-P3HT not adsorbed on
BNNT samples, as described in the experimental section and Scheme 1. Although with
different scattering backgrounds, the partially resolved bands are observed in all three
samples indicating the presence of ordered rra-P3HT aggregates strongly bound to
BNNTs. As expected, the absorption band corresponding to the free rra-P3HT is no
longer apparent after filtration; the brownish shading disappeared and the color of the
suspension returned to purple (sample images in Figure 5a) with the color value of the
BNNT suspensions decreasing with increasing sample purity: P-BNNT-3 < P-BNNT-2 <
P-BNNT-1. Pure absorption spectra extracted by subtraction of the scattering background
(Figure 5a dotted lines) calculated using Eq. 1 are shown in Figure 5b. Subtraction of the
scattering background better visualizes additional differences in the absorption spectra of
these samples in the 300 nm to 700 nm range. A non-structured high energy region (320
nm to 470 nm) is attributed to nonaggregated or disordered rra-P3HT chains and a
low-energy region (470 nm to 650 nm range) characterized by the partially resolved vibronic
3 4 5 6 7 8 9 10 11 12 13 14 15 16 17 18 19 20 21 22 23 24 25 26 27 28 29 30 31 32 33 34 35 36 37 38 39 40 41 42 43 44 45 46 47 48 49 50 51 52 53 54 55 56 57
bands corresponds to aggregated rra-P3HT chains.17,18 It is clear from Figure 5b that in
P-BNNT-3 the vibronic bands (low energy region) are better resolved than in P-BNNT-1
and P-BNNT-2. This is an indication of a more uniform and narrower conformation
distribution of rra-P3HT chains on P-BNNT-3. On the other hand, the higher energy region
of the spectrum between 320 nm and 470 nm, corresponding to absorption by disordered
rra-P3HT chains, follows the opposite trend with a higher relative integrated intensity
contribution observed in the lowest purity material P-BNNT-1 followed by P-BNNT-2. A
weaker interaction of rra-P3HT with impurities and also with defective BNNTs present in
BNNT samples could lead to adsorbed rra-P3HT chains with significantly disrupted
conjugation and no significant contribution to the partially resolved vibronic bands at lower
energies.
Regioregular P3HT is known to form ordered aggregates composed of π−π stacked
chains that can adopt different arrangements and packing. The structural characteristics
of aggregated polymer chains have a significant impact on their electronic properties,
which can be revealed by optical spectroscopy.19,20,21,22 In this work we observe
aggregation of regiorandom P3HT promoted by strong polymer interaction with BNNTs.
3 4 5 6 7 8 9 10 11 12 13 14 15 16 17 18 19 20 21 22 23 24 25 26 27 28 29 30 31 32 33 34 35 36 37 38 39 40 41 42 43 44 45 46 47 48 49 50 51 52 53 54 55 56 57
Corresponding absorption spectra are typical of H aggregates. The degree of coupling
between aggregated chains is commonly evaluated from the absorption spectra by
measuring the intensity ratio of the lowest energy peak (A0-0) and the next replica (A1-0) 8
by using Eq. [3] resulting from the H/J aggregate model developed by Spano and
coworkers, where Ep is the energy of the dominant (C=C) intramolecular vibration (0.18
eV) and W is the exciton bandwidth.8
�0― 0 �1― 0=
(
1― 0.24� � � 1 + 0.073� ��)
2 , Eq [3]The A0-0/A1-0 peak ratio (Figure 5b) is similar for samples P-BNNT-2 and P-BNNT-3 with
approximate values of 0.81 and 0.87, respectively. Poor resolution of P-BNNT-1 spectrum
makes reliable determination of the peak ratio more difficult without more rigorous
analysis. The similar values of the A0-0/A1-0 peak intensity ratio indicate that rra-P3HT
aggregates with a similar degree of order were generated in the samples P-BNNT-2 and
P-BNNT-3. On the other hand, as indicated by fractional absorption in the high energy
region (320 nm to 470 nm) compared to the total integrated absorption (320 nm to 650
3 4 5 6 7 8 9 10 11 12 13 14 15 16 17 18 19 20 21 22 23 24 25 26 27 28 29 30 31 32 33 34 35 36 37 38 39 40 41 42 43 44 45 46 47 48 49 50 51 52 53 54 55 56 57
nm range) (Figure 5b) a significantly higher fraction of the total rra-P3HT chains adsorbed
on sample P-BNNT-2 are in a nonaggegated or disordered conformation as compared to
P-BNNT-3. Considering that SEM images appear to show only slightly higher purity for
P-BNNT-3 samples, these results suggest that the characteristics of the absorption
spectrum of rra-P3HT/P-BNNT samples could be determined not only by the samples
purity (fraction of BNNTs in a sample) but also by the sidewall defect density or crystalline
quality. The results from the rra-P3HT test (Figures 3, 4 and 5a), supported by SEM and
AFM microscopy, indicate the highest purity of sample P-BNNT-3 and additionally the
analysis of the morphology of rra-P3HT chains adsorbed on the samples (Figure 5b)
suggests that fewer wall defects (higher crystallinity) are present in sample P-BNNT-3,
which exhibit the lowest fraction of disordered rra-P3HT.
Water adsorption isotherms (Figure S6, right) show decreasing adsorbed amount at 95
% RH on going from P-BNNT-1 to P-BNNT-2 to P-BNNT-3. The water uptake at low
relative humidity (i.e. less than 20 % RH) follows the same trend (Table 1), which
correlates with increasing sample purity as determined from the rra-P3HT/P-BNNT
absorption spectra. The P-BNNT-3 isotherm is characteristic of a hydrophobic material
3 4 5 6 7 8 9 10 11 12 13 14 15 16 17 18 19 20 21 22 23 24 25 26 27 28 29 30 31 32 33 34 35 36 37 38 39 40 41 42 43 44 45 46 47 48 49 50 51 52 53 54 55 56 57
(e.g. carbon black) with a low water uptake at low relative humidity and a hysteresis loop
at higher relative humidity. It can be categorized as Type V in the IUPAC classification.23
Water adsorption behavior can be affected by the presence of polar groups such as
functional groups at the surface of the material, as recently shown in a review on
carbonaceous materials.24 Therefore, water adsorption on the P-BNNT samples can be
explained, in addition to the effect of sample purity, by the presence of varying number of
polar functional groups on the BNNT walls and BN impurities that initiate water primary
clusters.22 Decreasing density of chemical (functional groups) as well as topological
defect sites along the BNNT walls hindering rra-P3HT planarization and aggregation
could contribute to a decreasing fraction of disordered rra-P3HT from BNNT-1 to
P-BNNT-2 and to P-BNNT-3. A less defective (more crystalline) BNNT surface favors
stronger interaction and a more homogeneous orientation of the conjugated polymer
chains, manifested by more intense and better resolved absorption bands.
It is worth noting that other factors such as BNNT diameter and length distribution, level
of debundling, and different characteristics of the impurities present (e.g. material density)
could also have an effect on the interaction with rra-P3HT and the water sorption
3 4 5 6 7 8 9 10 11 12 13 14 15 16 17 18 19 20 21 22 23 24 25 26 27 28 29 30 31 32 33 34 35 36 37 38 39 40 41 42 43 44 45 46 47 48 49 50 51 52 53 54 55 56 57
behavior. As an aside, water sorption studies bring attention to the importance of
controlling relative humidity in a laboratory when weighing and processing BNNT
materials, especially those of low purity and crystalline quality.
Polarized excitation fluorescence microscopy has previously been used to determine
the conformation and orientation of rra-P3HT on BNNT samples5 and the conformation of
P3HT chains in a PMMA matrix.25 However, in the former case identity of BNNTs and
impurities was only indirectly inferred from analyses of P3HT fluorescence in polarized
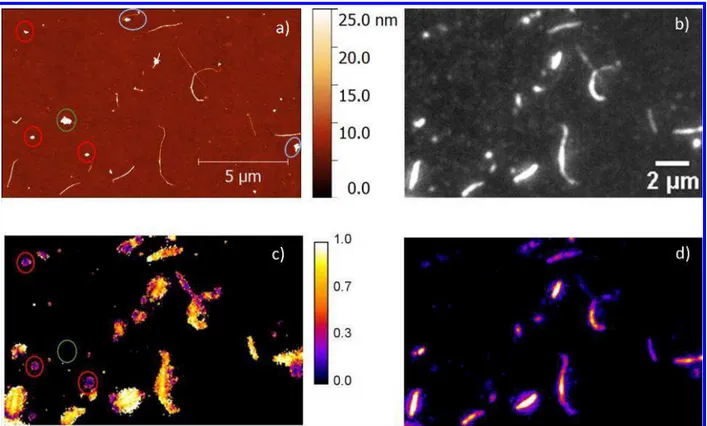
excitation fluorescence microscopy images. Representative correlated AFM and
polarized excitation fluorescence microscopy images for the rra-P3HT/P-BNNT-3 sample
are shown in Figure 6a and 6b, respectively. Additional images of the
P3HT/P-BNNT-3 sample are shown in Figure S7 and the results of height measurement for samples
rra-P3HT/P-BNNT-2 and rra-P3HT/P-BNNT-3 in Table S1. An integration of the two
microscopic techniques facilitates more direct identification of single and bundled BNNTs,
as well as differentiation between rra-P3HT/BNNT hybrids and non-tubular objects
(impurities), which allows assessment of the rra-P3HT coverage and morphology on each
identified object. As a control measurement, the correlated AFM and polarized excitation
3 4 5 6 7 8 9 10 11 12 13 14 15 16 17 18 19 20 21 22 23 24 25 26 27 28 29 30 31 32 33 34 35 36 37 38 39 40 41 42 43 44 45 46 47 48 49 50 51 52 53 54 55 56 57
fluorescence microscopy images for the neat P-BNNT-3 sample (without rra-P3HT) are
presented in Figure S8.
Figure 6. Correlated AFM (a) and polarized excitation fluorescence microscopy images
(b) corresponding to a “polymer saturated” rra-P3HT/P-BNNT-3 sample obtained after
filtration to remove unbound rra-P3HT; corresponding parameter mapping images:
modulation (c) and fluorescence intensity peak amplitude (d) obtained from
voxel-by-voxel fits to Eq. 2.
3 4 5 6 7 8 9 10 11 12 13 14 15 16 17 18 19 20 21 22 23 24 25 26 27 28 29 30 31 32 33 34 35 36 37 38 39 40 41 42 43 44 45 46 47 48 49 50 51 52 53 54 55 56 57
In the AFM images of the hybrid rra-P3HT/P-BNNT-3 sample (Figure 6 a) more
debundled BNNTs (Figure S7), as compared to neat BNNTs (Figure S8), can be clearly
identified together with impurities (indicated by red and green ovals). In some cases
non-tubular structures can be observed attached to an end of a BNNT (blue ovals in Figure
6a), as it has previously been observed by TEM.5 As previously described,5 stacks of
polarized excitation fluorescence microscopy images with varying excitation light
polarization were automatically scanned voxel-by-voxel, and the florescence intensity as
a function of the polarization angle fitted to Eq. 2. A set of five synthetic result images was
created with pixel values equal to � , and best estimates of A, α, M, and r2 of the fit. M
���
and A mapping images are shown in Figure 6 c and d, respectively (Iavr, α, and r2 are
shown in Figure S9). Modulation, M, varies from 0 for randomly oriented or coiled P3HT
(or stretched P3HT chains crossing at right angles) to 1 for aggregates of oriented P3HT
chains. It is evident from the correlated AFM and fluorescence microscopy that most of
the AFM identified impurities (non-tubular structures) on AFM images display fluoresce
with a modulation depth lower than 0.5 (red ovals in Figure 6 d). Additionally,
non-fluorescing impurities (green oval in Figure 6 a and d), were also observed. These results
3 4 5 6 7 8 9 10 11 12 13 14 15 16 17 18 19 20 21 22 23 24 25 26 27 28 29 30 31 32 33 34 35 36 37 38 39 40 41 42 43 44 45 46 47 48 49 50 51 52 53 54 55 56 57
support the hypothesis that rra-P3HT chains with significantly disrupted conjugation,
hence no significant contribution to the vibronic bands in the low energy region of the
absorption spectrum that corresponds to rra-P3HT aggregates, are adsorbed on the
non-tubular impurities. All objects identified by AFM as single or bundled BNNTs showed
fluorescence with varying intensity and intensity modulation depth ranging from 0.5 to 1.
In the case of BNNTs, a strong interaction with rra-P3HT leads to polymer planarization
followed by aggregation of aligned polymer chains and consequently observation of high
values of fluorescence modulation depth. A weaker interaction with defective BNNTs
present in this sample could be responsible for variation of fluorescence intensity and
fluorescence modulation depth values along a length of a nanotube, as observed for
some single isolated BNNTs.
Table 1. rra-P3HT coverage saturation (S) range, corresponding BET surface area (SBET),
water uptake and rra-P3HT quality index for P-BNNT materials.
3 4 5 6 7 8 9 10 11 12 13 14 15 16 17 18 19 20 21 22 23 24 25 26 27 28 29 30 31 32 33 34 35 36 37 38 39 40 41 42 43 44 45 46 47 48 49 50 51 52 53 54 55 56 57
Material rra-P3HT to BNNT mass ratio SBET (m2/g) Water uptake at 20 % RH (%) Water uptake at 20 % RH (µmole m-2 g) rra-P3HT quality index [Qi = I(A1-0)/I420] P-BNNT-1 0.06S0.08 143 5.6 22 1.5 P-BNNT-2 0.08S0.1 199 3.9 8 1.8 P-BNNT-3 0.14S0.16 282 0.7 1 2.6
SBET and water uptake determined experimentally from octane and water adsorption isotherms, respectively (Figure S4)
I(A1-0) and I420: representative absorbance in the low energy region and the high energy region (at 420 nm), respectively (Figure 5b)
Figure 7 illustrates the trends in specific surface area and water uptake at 20% RH as
a function of the A1-0 peak rra-P3HT/P-BNNT absorbance for the evaluated samples. The
amount of water adsorbed at 20% RH normalized to the unit surface area is also included
in Table 1 corroborating a decreasing affinity towards water (i.e. decreasing density of
hydrophilic sites) from P-BNNT-1 to P-BNNT-2 to P-BNNT-3 material. As mentioned
earlier the rra-P3HT/P-BNNT absorbance increases as the SBET increases. The
extrapolation of the linear fit to zero absorbance (Figure 7) indicates that there is 50 %
3 4 5 6 7 8 9 10 11 12 13 14 15 16 17 18 19 20 21 22 23 24 25 26 27 28 29 30 31 32 33 34 35 36 37 38 39 40 41 42 43 44 45 46 47 48 49 50 51 52 53 54 55 56 57
chance that with no absorption by ordered rra-P3HT aggregates, the BET surface area
value is in the range of 35 m2/g to 85 m2/g, thus significantly greater than zero. This range
agrees with the SBET values determined for the h-BN precursor (20 m2/g) and impurities
(52 m2/g) collected from the acetone washes during the purification of P-BNNT-1.9
Therefore, the intercept or zero absorbance BET surface area is attributed to surface area
of impurities. This also supports our stipulation that ordered aggregates, with absorbance
at A1-0 peak, are formed on BNNTs only and are not expected to be attached to impurities.
The large curvature of the BNNTs compared to the lower curvature of impurities (e.g. h-BN
and other BNx derivatives) could be the main reason for the observed selective adsorption of rra-P3HT since only on the nanotubes rra-P3HT chains can orient stretched along the BNNT axis (by π- π interaction) with side alkyl chains wrapping around the tubes.26 In this configuration, unfavorable steric interactions between randomly attached alkyl chains could be minimized
and conduce to the formation of rra-P3HT aggregates. It has been shown that when the
curvature is reduced π- π interactions increase26,27 hence the selectivity observed in this
material cannot be explained by π- π interactions alone but rather by a combination of π- π interactions and Van der Waals forces involving the alkyl chains.
3 4 5 6 7 8 9 10 11 12 13 14 15 16 17 18 19 20 21 22 23 24 25 26 27 28 29 30 31 32 33 34 35 36 37 38 39 40 41 42 43 44 45 46 47 48 49 50 51 52 53 54 55 56 57
Figure 7. Results from water adsorption isotherms (blue squares) and SBET (red squares)
as a function of rra-P3HT/P-BNNT absorbance; red line corresponds to the linear fit and
blue line to guide the eye only.
In summary, we observed that:
rra-P3HT interacts selectively with BNNT to produce a rra-P3HT/BNNT hybrid with unique absorption characteristics that facilitate differentiation from
rra-P3HT, BNNTs and impurities. 3 4 5 6 7 8 9 10 11 12 13 14 15 16 17 18 19 20 21 22 23 24 25 26 27 28 29 30 31 32 33 34 35 36 37 38 39 40 41 42 43 44 45 46 47 48 49 50 51 52 53 54 55 56 57
The amount of rra-P3HT required to titrate the BNNTs, the saturation point S, is directly related to the quality of the BNNT sample with a higher S value indicating
higher sample quality.
The absorption spectrum can be divided into a high (320 nm to 470 nm) and a low (470 nm to 650 nm) energy regions corresponding to absorption by
disordered rra-P3HT/BNNT brought about by lower crystallinity BNNTs and
some complexation with low surface area impurities and ordered
rra-P3HT/BNNT aggregates formed on BNNT external surface.
Based on the above, to compare quality of different purified BNNT materials (P-BNNT)
produced by the HABS method, we introduce a quality index defined as the ratio of
absorbance in the low energy region measured at the maximum of the A1-0 band and high
energy region measured at 420 nm, [Qi = I(A1-0)/I420]. The absorbance at the low and the
high energy regions measures the amount of ordered and amorphous rra-P3HT
aggregates, respectively. 3 4 5 6 7 8 9 10 11 12 13 14 15 16 17 18 19 20 21 22 23 24 25 26 27 28 29 30 31 32 33 34 35 36 37 38 39 40 41 42 43 44 45 46 47 48 49 50 51 52 53 54 55 56 57
CONCLUSIONS
We have demonstrated a simple method for assessing relative quality of BNNT samples
based on colorimetry and absorption spectroscopy of rra-P3HT self-assembled on
BNNTs dispersed in chloroform. The method is based on the observations that rra-P3HT
selectively forms ordered aggregates on BNNTs and has no or little affinity with the
impurities. Although applied here for BNNT produced by the HABS process, the method
should be applicable to BNNT produced using other processes as long as rra-P3HT has
no or little affinity with the impurities. Quality assessment of a BNNT material, which is
critical for accelerating the development of applications based on BNNT, can effectively
be conducted by the methodology proposed in this work. The procedure could also be
employed to monitor creation of wall defects by surface treatments, including covalent
functionalization.
ASSOCIATED CONTENT
Supporting Information. Sample images and absorption spectra of rra-P3HT/h-BN and
rr-P3HT/h-BN samples. Additional SEM, AFM and correlated AFM and polarized
3 4 5 6 7 8 9 10 11 12 13 14 15 16 17 18 19 20 21 22 23 24 25 26 27 28 29 30 31 32 33 34 35 36 37 38 39 40 41 42 43 44 45 46 47 48 49 50 51 52 53 54 55 56 57
excitation fluorescence microscopy images of P-BNNT samples. Water and octane
vapors adsorption isotherms.
AUTHOR INFORMATION
Corresponding Author
*(Y.M.R.) Email: yadienka.martinez-rubi@nrc-cnrc.gc.ca
Author Contributions
All authors contributed intellectually and approved the final version of the manuscript.
Y.M.R. and Z.J.J. contributed equally.
ACKNOWLEDGMENT
This work was supported by the NRC Security Materials Technology Program (Project
A1-9469). The authors are grateful to M. Daroszewska for the DVS measurements, to
S. Walker and V. Gies for their assistance on BNNT purification, and to K. S. Kim, M.
Plunkett and D. Ruth for the synthesis of BNNTs.
3 4 5 6 7 8 9 10 11 12 13 14 15 16 17 18 19 20 21 22 23 24 25 26 27 28 29 30 31 32 33 34 35 36 37 38 39 40 41 42 43 44 45 46 47 48 49 50 51 52 53 54 55 56 57
REFERENCES
1 Zhi, C.; Bando, Y.; Terao, T.; Tang, C.; Kuwaraha, H. Golberg, D. Towards
Thermoconductive, Electrically Insulating Polymeric Composites with Boron Nitride
Nanotubes as Fillers. Adv. Funct. Mater. 2009, 19, 1857–1862.
2 Kang, J. H.; Sauti, G.; Park, C.; Yamakov, V. I.; Wise, K. E.; Lowther, S. E.; Fay, C.
C.; Thibeault, S. A.; Bryant, R. G. Multifunctional Electroactive Nanocomposites Based
on Piezoelectric Boron Nitride Nanotubes. ACS Nano 2015, 9, 11942–11950.
3 Li, L. H.; Chen, Y.; Lin, M. Y.; Glushenkov, A. M.; Cheng, B. M.; Yu, J. Single Deep
Ultraviolet Light Emission from Boron Nitride Nanotube Film. Appl. Phys. Lett. 2010, 97,
141104- 141104-3. 3 4 5 6 7 8 9 10 11 12 13 14 15 16 17 18 19 20 21 22 23 24 25 26 27 28 29 30 31 32 33 34 35 36 37 38 39 40 41 42 43 44 45 46 47 48 49 50 51 52 53 54 55 56 57
4 “Boron Nitride Nanotubes in Nanomedicine” A volume in Micro and Nano
Technologies. Edited by Gianni Ciofani and Virgilio Mattoli. 2016,
https://doi.org/10.1016/B978-0-323-38945-7.00014-6.
5 Martinez-Rubi, Y.; Jakubek, Z. J.; Jakubinek, M. B.; Kim, K. S.; Cheng, F.; Couillard,
M.; Kingston, C.; Simard, B. Self-Assembly and Visualization of Poly(3-hexyl-thiophene)
Chain Alignment along Boron Nitride Nanotubes. J. Phys. Chem. C. 2015, 119,
26605−26610.
6 Kim, K.S.; Kingston, C. T.; Hrdina, A.; Jakubinek, M.B.; Guan, J.; Plunkett, M.; Simard,
B. Hydrogen-Catalyzed, Pilot-Scale Production of Small-Diameter Boron Nitride
Nanotubes and Their Macroscopic Assemblies. ACS Nano. 2014, 8, 6211-6220.
7 Miyata, Y.; Mizuno, K.; Kataura, H. Purity and Defect Characterization of Single-Wall
Carbon Nanotubes Using Raman Spectroscopy, J. Nanomater. 2011, ID 786763, 7
pages, http://dx.doi.org/10.1155/2011/786763. 3 4 5 6 7 8 9 10 11 12 13 14 15 16 17 18 19 20 21 22 23 24 25 26 27 28 29 30 31 32 33 34 35 36 37 38 39 40 41 42 43 44 45 46 47 48 49 50 51 52 53 54 55 56 57
8 Kim, K. S.; Kingston, C.; Simard, B. Boron Nitride Nanotubes and Process for
Production Thereof. US 9,862,604 B2.
9 Simard, B.; Ingold, K.; Walker, S.; Iannitto, R.; Cho, H.; Martinez-Rubi, Y.; Kim, K. S.;
Kingston, C. T.; Dénommée, S.; Ruth, D; Plunket, M. Process and Apparatus for Purifying
BNNT. US. Provisional No. 62/696,377, 2018
10 Agbolaghia, S.; Zenoozi, S. A comprehensive Review on
Poly(3-alkylthiophene)-Based Crystalline Structures, Protocols and Electronic Applications, Org. Electron. 2017,
51, 362–403.
11 Yamagata, H.; Spano, F. C. Interplay Between Intrachain and Interchain Interactions
in Semiconducting Polymer Assemblies: The HJ-Aggregate Model. J. Chem. Phys. 2012,
136, 184901-1-184901-14.
12 Scharsich, C.; Lohwasser, R. H.; Sommer, M.; Asawapirom, U.; Scherf, U.; Thelakkat,
M.; Neher, D.; Köhler A. Control of Aggregate Formation in Poly(3‐hexylthiophene) by
3 4 5 6 7 8 9 10 11 12 13 14 15 16 17 18 19 20 21 22 23 24 25 26 27 28 29 30 31 32 33 34 35 36 37 38 39 40 41 42 43 44 45 46 47 48 49 50 51 52 53 54 55 56 57
Solvent, Molecular Weight, and Synthetic Method. J. Polym. Sci., Part B: Polym. Phys.
2012, 50, 442–453.
13 Tremel K; Ludwigs, S. Morphology of P3HT in Thin Films in Relation to Optical and
Electrical Properties. Adv. Polym. Sci. 2014, 265, 39–82.
14 Guo, Y.; Jiang, L.; Ma, X.; Hu, W.; Su, Z. Poly(3-hexylthiophene) Monolayer
Nanowhiskers. Polym. Chem. 2013, 4, 4308–4311.
15 Schmidt-Mende, L.; Weickert, J. Organic and Hybrid Solar Cells: An Introduction.
Walter de Gruyter GmbH. Berlin/Boston. 2016, 304 pages.
16 Ma, P.; Spencer, J. T. Non-covalent Stabilization and Functionalization of Boron
Nitride Nanosheets (BNNSs) by Organic Polymers: Formation of Complex
BNNSs-Containing Structures. J. Mater. Sci. 2015, 50, 313-323.
17 Nagarjuna, G.; Baghgar, M.; Labastide, J. A.; Algaier, D. D.; Barnes, M. D.;
Venkataraman, D. Tuning Aggregation of Poly- (3-hexylthiophene) within Nanoparticles,
ACS Nano, 2012, 6, 12, 10750–10758. 3 4 5 6 7 8 9 10 11 12 13 14 15 16 17 18 19 20 21 22 23 24 25 26 27 28 29 30 31 32 33 34 35 36 37 38 39 40 41 42 43 44 45 46 47 48 49 50 51 52 53 54 55 56 57
18 Istif, E.; Hernández-Ferrer, J.; Urriolabeitia, E. P.; Stergiou, A.; Tagmatarchis, N.;
Fratta, G.; Large, M. J.; Dalton A. B.; Benito, A. M.; Maser, W. K. Conjugated Polymer
Nanoparticle–Graphene Oxide Charge-Transfer Complexes, Adv. Funct. Mater. 2018,
1707548.
19 Spano, F. C. Absorption in Regio-Regular Poly(3-hexyl)thiophene thin films: Fermi
Resonances, Interband Coupling and Disorder, Chem. Phys. 2006, 325, 22.
20 Clark, J.; Silva, C.; Friend, R. H.; Spano, F. C. Role of Intermolecular Coupling in the
Photophysics of Disordered Organic Semiconductors: Aggregate Emission in
Regioregular Polythiophene. Phys. Rev. Lett. 2007, 98, 206406.
21 Roehling, J. D.; Arslan, I.; Moule, A. J. Controlling Microstructure in
Poly(3-hexylthiophene) Nanofibers, J. Mater. Chem. 2012, 22, 2498.
22 Paquin, F.; Yamagata, H.; Hestand, N. J.; Sakowicz, M.; Bérubé, N.; Côté, M.;
Reynolds, L. X.; Haque, S. A.; Stingelin, N.; Spano, F. C.; Silva, C. Two-Dimensional
3 4 5 6 7 8 9 10 11 12 13 14 15 16 17 18 19 20 21 22 23 24 25 26 27 28 29 30 31 32 33 34 35 36 37 38 39 40 41 42 43 44 45 46 47 48 49 50 51 52 53 54 55 56 57
Spatial Coherence of Excitons in Semicrystalline Polymeric Semiconductors: The Effect
of Molecular Weight. Phys. Rev. B. 2013, 88, 155202.
23 Thommes, M.; Kaneko, K.; Neimark, A. V.; Olivier, J. P.; Rodriguez-Reinoso, F.;
Rouquerol J.; et al. Physisorption of Gases, with Special Reference to the Evaluation of
Surface Area and Pore Size Distribution (IUPAC Technical Report). Pure Appl. Chem.
2015, 87, 1051–1069.
24 Liu, L.; Tan, S.; Horikawa, T.; Do, D.D.; Nicholson, D.; Liu, J. Water Adsorption on
Carbon - A Review. Adv. Colloid Interface Sci. 2017, 250, 64–78.
25 Adachi, T.; Brazard, J.; Ono, R. J.; Hanson, B.; Traub, M. C.; Wu, Z.-Q.; Li, Z.;
Bolinger, J. C.; Ganesan, V.; Bielawski, C.; et al. Regioregularity and Single
Polythiophene Chain Conformation. J. Phys. Chem. Lett. 2011, 2, 1400−1404.
26 Shen, C.; Chai, S.; Zou, S.; Zhai, L. Crystallization of Poly(3-hexylthiophene) on
Graphitic Surfaces with Different Curvatures. Polymer 2018, 144, 168-178.
3 4 5 6 7 8 9 10 11 12 13 14 15 16 17 18 19 20 21 22 23 24 25 26 27 28 29 30 31 32 33 34 35 36 37 38 39 40 41 42 43 44 45 46 47 48 49 50 51 52 53 54 55 56 57
27 Nasrabadi, A. T.; Foroutan, M. Interactions between Polymers and Single-Walled
Boron Nitride Nanotubes: A Molecular Dynamics Simulation Approach. J. Phys. Chem.
B. 2010, 114, 15429. 3 4 5 6 7 8 9 10 11 12 13 14 15 16 17 18 19 20 21 22 23 24 25 26 27 28 29 30 31 32 33 34 35 36 37 38 39 40 41 42 43 44 45 46 47 48 49 50 51 52 53 54 55 56 57