HAL Id: hal-01989168
https://hal.archives-ouvertes.fr/hal-01989168
Submitted on 31 May 2021
HAL is a multi-disciplinary open access archive for the deposit and dissemination of sci-entific research documents, whether they are pub-lished or not. The documents may come from teaching and research institutions in France or abroad, or from public or private research centers.
L’archive ouverte pluridisciplinaire HAL, est destinée au dépôt et à la diffusion de documents scientifiques de niveau recherche, publiés ou non, émanant des établissements d’enseignement et de recherche français ou étrangers, des laboratoires publics ou privés.
Mapping seismic vulnerability at urban scale: Discussion
on relevant cartography representations and smoothing
for urban planning purposes on the Oran case study
Abbas Senouci, Pierre Yves Bard, Elise Beck, Mohamed Naboussi Farsi,
Stéphane Cartier
To cite this version:
Abbas Senouci, Pierre Yves Bard, Elise Beck, Mohamed Naboussi Farsi, Stéphane Cartier. Mapping seismic vulnerability at urban scale: Discussion on relevant cartography representations and smoothing for urban planning purposes on the Oran case study. Soil Dynamics and Earthquake Engineering, Elsevier, 2018, 115, pp.545-563. �10.1016/j.soildyn.2018.08.034�. �hal-01989168�
1
Mapping seismic vulnerability at urban
scale:
discussion
on
relevant
cartography
representations
and
smoothing for urban planning purposes
on the Oran case study
Abbas SENOUCI
Département d'Architecture, Faculté d’Architecture et de Génie-Civil, Université des
Sciences et de la Technologie USTO-MB d'Oran , BP 1.505 El-M’naouar, Bir el Djir, Oran,
Algérie
sncbbs@yahoo.fr; abbas-senouci@univ-usto.dz Phone: +213 664739290
Pierre-Yves BARD
ISTERRE, University of Grenoble-Alpes, CNRS, IFSTTAR, Maison des Géosciences, BP 53,
38041 Grenoble cedex 9, France
pierre-yves.bard@univ-grenoble-alpes.fr Phone: +33476635172 ; Fax: +33476635252
Elise BECK
Laboratoire Territoires - UMR PACTE 5194 CNRS,
Institut de Géographie Alpine, University of Grenoble-Alpes, 14 bis, Avenue Marie Reynoard,
38100 Grenoble, France
elise.beck@univ-grenoble-alpes.fr
Phone: +33 476 82 20 64; Fax: +33 4 76 82 20 21
Mohamed Naboussi FARSI
Centre National de Recherche Appliquée en Génie Parasismique
Rue Kaddour Rahim Prolongée , Hussein Dey, Alger
mnfarsi@cgs-dz.org Phone: +213 21 49 55 60 Fax: +213 21 49 55 36
Stéphane Cartier
Laboratoire Territoires - UMR PACTE 5194 CNRS
Institut de Géographie Alpine, University of Grenoble-Alpes, 14 bis, Avenue Marie Reynoard,
38100 Grenoble, France
scartier@univ-grenoble-alpes.fr Phone: +33 476 82 20 64 Fax: +33 4 76 82 20 21
2
ABSTRACT
Earthquake damage and loss scenarios are considered as a powerful tool to help in the design of efficient seismic mitigation policies. Moreover, at a city scale, adequate urban planning may significantly contribute to improve resilience through requalification of inherited urban fabrics and/or appropriate land use. In this perspective, the present paper investigates what could be the optimal graphic representation of probable losses at urban scale, which be most relevant for seismic risk management. The goal is to provide urban planners with guidelines on how to combine the use of vulnerability index-based damage estimates and GIS tools, to identify urban fabrics that need requalification. The proposed methodology consists in starting from damage estimates at the individual building scale, and using GIS (Geographic Information Systems) capacities to aggregate the expected damage on neighborhoods of increasing size, from blocks to large urban districts, in order to delimitate homogeneous urban zones. The criteria thus for choosing the optimal aggregation level are based on the need to obtain legible maps combining robust damage estimations – which implies statistics over a large enough number of buildings –, and a clear identification of the most vulnerable urban areas on which dedicated actions should be focused in priority.
These methodologies are presented and tested on the example of the city of Oran (Algeria), and on the basis of a prior vulnerability study based on GNDT and RISK-UE vulnerability index approaches. The main outcome is the identification of different urban zones, which exhibit some homogeneity regarding both their average seismic response and their urban function. The most vulnerable urban fabrics require not only individual retrofitting measures at building scale; they also need urban requalification because it is more convenient to deal simultaneously with urban and safety considerations.
Key words: earthquake damage scenarios, urban scale, urban planning, aggregation, GIS, urban fabrics, urban requalification.
3
1. Introduction
Emergency response has been the main focus of seismic risk assessment for a long time until the advent of the International Decade for Natural Disaster Reduction (IDNDR, 1990-2000) that is considered as a turning point to include other aspects that were formerly ignored, mainly socio-economic development (Dusan Zupka 1992). In this new trend for seismic prevention, urban planning has been considered to be useful. However, the implementation of an urban project is subject to numerous constraints: legal status of land and buildings, economic feasibility, availability of financial resources, current regulation, etc. Therefore, handling vulnerability raises more uneasy issues at urban scale than at individual building scale. This latter is the most used through retrofitting actions in respect of current building regulations.
Thus, it is worth to recognize the limits of such approach and to propose a map document that anticipates the urban situation after an earthquake. Hence, thanks to a vulnerability assessment at the right scale can helps the multiple stakeholders in a city to debate about undertaking detailed surveys of highly vulnerable zones, to choose the scale of intervention: at building scale by retrofitting or demolition-reconstruction or at urban scale by conceiving a whole requalification with integration of new urban functions, restructuration of the urban tissue, modifications of land subdivision, modification of street network, etc.
At urban scale, this action is more feasible when great urban metamorphose has to be achieved at city scale. In this case, the vulnerability increases the need of coordinated intervention to meet safety, socio-economic and urban goals. In this sense, long-term urban planning is highlighted (Fäh et al. 2001; ISDR-United Nation 2004). Moreover, communication between geosciences, architecture and urban planning disciplines can be improved by the production of maps which show clear delineation of higher vulnerability zones. Urban planners or decision-makers would like to delineate urban zone that can be handled with available resources. Here, it is evident that local constraints (technical, economic and financial) are determinant in the definition of a schedule for the implementation of the urban plan. As an example form Oran, in the last years a project of rehabilitation of buildings has been implemented by defining 200 buildings in accordance of the available budget offered by central governmental instances; the project does not handle the seismic vulnerability but only the maintenance conditions (Cartier, Valette, and Mediene 2012; Senouci et al. 2013).
Since the beginning, earthquake damage scenarios have been used to assess the level and the spatial distribution of expected damage in order to plan risk mitigation. Nowadays, it exists a plurality of seismic risk assessment models embedded on software where seismic scenarios are used to simulate post-earthquake situation: HAZUS (FEMA 1997); RADIUS (UNISDR 1999); Seismocare (Nisticò et al. 2001); SELENA (NORSAR and University of Alicante 2004); etc. The outcomes of these programs; earthquake loss estimations, can be used for different purposes: formulating seismic risk
4
mitigation policies; planning emergency response measures or/and planning long-term measures (Anagnostopoulos et al. 2008). Generally, the methodology is summarized in three main assessment phases: seismic hazard; seismic vulnerability; seismic risk. However, the advancement achieved in the last decades in this fields, uncertainties are a main common element that characterizes their assessment and that leads to our proposal.
For generalized applications, seismic hazard analysis can also be used to prepare macro or micro-zoning maps of an area by estimating the strong-motion parameters for a closely spaced grid of sites. Two basic methodologies used for the purpose are the “deterministic” and the “probabilistic” seismic hazard analysis (PSHA) approaches (Gupta 2002). According to Wang (2011) the purpose of seismic hazard assessment is to quantify seismic hazard and its associated uncertainties in time and space from the instrumental, historical, and geological observations (i.e., from earthquake science), and to provide a base for seismic risk assessment. Quantitatively, seismic hazard is defined by three parameters: level of severity, and spatial and temporal measurements. Seismic hazard is assessed from instrumental, historical, and geological observations. Two methods are commonly used for seismic hazard assessment: probabilistic seismic hazard analysis (PSHA) and deterministic seismic hazard analysis (DSHA) (Wang 2011). The U.S Geological Survey, a pioneer in this field, has developed in the seventies probabilistic seismic hazard maps for the United States. It has been followed by the creation of the National Earthquake Hazards Reduction Program (NEHRP) that has lead to the establishment of ground motions maps in the nineties (Frankel 1995).
Seismic vulnerability of a construction is defined as its susceptibility to damage by ground-shaking of a given intensity. The aim of a vulnerability assessment is to obtain the probability of a given level of damage to a given building type due to a scenario earthquake (Calvi et al. 2006). From the seventies, empirical and analytical vulnerability assessment methods have been developed for large geographical scales. Empirical methods are based on post-earthquake damages that are statistically correlated to building type and macroseismic intensity (Calvi et al. 2006). Damage probability matrices (DPM) method is the earliest one developed by Whitman et al. (1973). In Italy, the Vulnerability Index Method proposed by Benedetti et al (1988) has integrated additionally to building typology the variable characteristics of building stock (geometric form in plan and elevation, structural elements, preservation state, etc.) that modulate the vulnerability index. Although the uncertainties that are inherent to this type of method they are suitable to carry a preliminary seismic risk evaluation at a large geographical scale. Thus it contributes to portray a post-earthquake situation and to raise awareness of decision-makers and urban planners forward the necessity of a mitigation policy. Data are a critical element in vulnerability assessment of urban fabrics. There is generally insufficient data related to seismic vulnerability at an urban scale. This fact leads to use poor databases to overcome this issue (Guéguen et al. 2007; Riedel et al. 2015). In this situation, census information
5
provides some characteristics of construction as structure type (masonry, concrete, steel, etc.), age, etc. Therefore a low level of detail of data leads to a low accuracy of the final results of seismic risk assessment whilst it is enhanced in the case of a comprehensive survey involving qualified technicians. Thus beside uncertainties inherent to vulnerability evaluation methods, there are additional uncertainties related to data.
For Lantada et al. (2010) “Urban seismic risk is the convolution of hazard and vulnerability; it describes the potential expected loss which can be represented in maps showing the expected damage of the urban area due to a specified earthquake”. At the basis of the parameters and data of hazard and vulnerability, it is possible to perform earthquake scenarios for a given hazard intensity. As it is dependent on hazard and vulnerability assessment it is highly dependent on their reliability and accuracy. The outcomes of seismic risk assessment are therefore subject to uncertainties. However, seismic risk assessment can highlight the benefits of a strategy of risk reduction on the basis of a cost-benefit analysis for instance.
Within this framework, this study aims to perform a map of vulnerability distribution that will be useful for requalification of existing urban fabrics. Based on the test of different aggregation methods, this paper examines the relevance and legibility of resulting maps and shows that mapping damage for urban planning purposes should take into account urban structure in order to increase legibility. Data used in this study come from a joint assessment of vulnerability of study area in Oran city (Algeria) consisting of about 5,000 buildings with three distinct qualitative vulnerability evaluation methods, GNDT (Benedetti, Benzoni, and Parisi 1988), RISK-UE (Lagomarsino and Giovinazzi 2006; Milutinovic and Trendafiloski 2003) and VULNERALP (Guéguen, Michel, and LeCorre 2007). All three approaches estimate an index of vulnerability for a masonry or reinforced concrete building and permit to derive probable seismic damage considering a given seismic intensity. The cartography of the results can be critical because the interpretation of spatial distribution can be greatly influenced by some map elements, e.g. map unit and displayed damage value. Thus the present study focused on the processing using GIS possibilities to get a relevant cartographic representation dedicated to urban planning purposes. Applied to some urban fabrics of Oran city (Algeria), the study aims at answering the following questions: what is the suitable element to be used as a map unit? How to improve the legibility of urban structure and most vulnerable fabrics in a vulnerability map? In this sense, this paper presents 1) a short state of the art of seismic vulnerability mapping, 2) a definition of the context and objectives of the study, 3) the data used in this paper, 4) the aggregation methods, and 5) a final discussion.
6
2. Mapping seismic vulnerability: a short state of the art
A literature review has been undertaken in order to explore current practices in this field. Twenty-one (21) paper have been selected from the available literature. The searched items in the different studies are vulnerability evaluation method, mapping method, map unit, and the intended use of the outputs.
2.1.
examples of seismic vulnerability maps
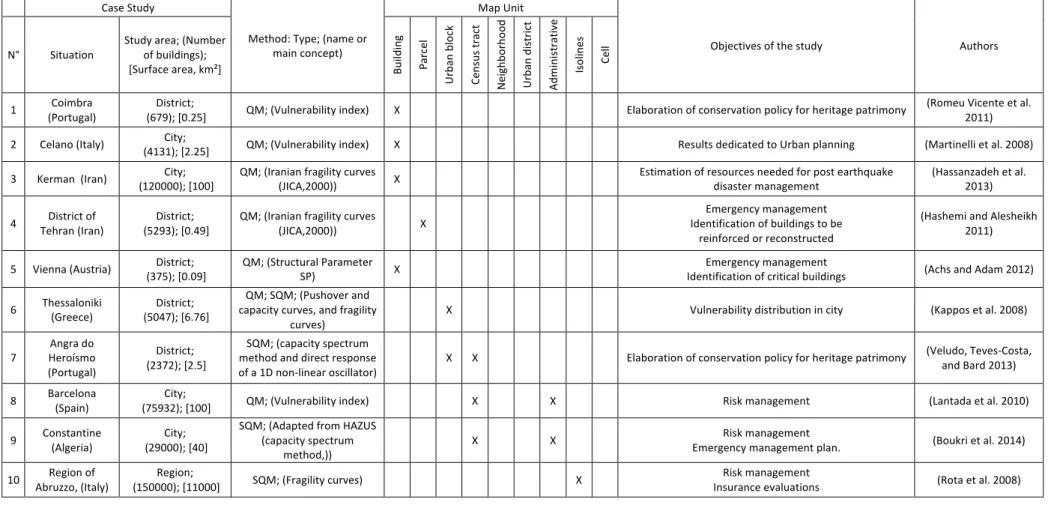
To find out how seismic vulnerability has been mapped, a sample of studies has been examined (Table 1). Each study has assessed and mapped vulnerability by performing seismic scenarios of an urban area with innovative or adapted methods. This review determines for each one: 1) map unit used to display damage, 2) damage value displayed and 3) the range of their use as declared by their authors. To ensure a representative sample, selected study cases belong to different countries: European countries which are the most represented in addition of Asian, American and African countries. Furthermore, study cases correspond to different methodologies and models; for instance: GNDT (Benedetti, Benzoni, and Parisi 1988; GNDT and CNR 2007), HAZUS (HAZUS 2003; FEMA 2012); RISK-UE (Milutinovic and Trendafiloski 2003; Lagomarsino and Giovinazzi 2006), LessLoss (Spence et al. 2007), Seismocare (Anagnostopoulos et al. 2008), etc. A common thread is that all researchers have used Geographic Information Systems (GIS) to perform seismic damage scenarios and their resulted maps.
Table 1 lists study cases according to some features: geographical scale, approximate area, number of buildings, vulnerability evaluation method, map unit used to display damage, and the declared usages of the outcomes. The sample is characterized by a noticeable variety. For example, the surface varies from 0.1 to 32,000 km² and the stock of buildings fluctuates from 375 to 3,500,000 buildings. It is worth to note that studies dealing with area less than 0.1km² or less than 300 buildings have not been selected because we considered that smaller areas could be easily viewed at building level and did not reveal aggregation issues. This observed variety reflects the difficulty to define a standardized urban scale. In fact, what is considered a wide urban zone in a country can be seen as a small one in another context. This fact highlights the necessity to adapt procedure to the urban context of the case study. Regarding vulnerability assessment methods used in this sample, they can be categorized in two types: 1) qualitative methods as EMS98, GNDT, RISK-UE, using the concept of vulnerability index, and 2) simplified quantitative methods as for instance fragility curves and capacity curves that can be obtained with different approaches. The sample confirms the trend to utilize empirical methods or simplified quantitative at urban scale studies rather than detailed surveys and analytical methods. In fact, the implementation of the latter is often unfeasible due to the huge task of surveys implied by sophisticated method. The studies use generally walk-down survey (street survey) also called “Rapid Visual Screening” (RVS) (FEMA 2002). In larger areas, data are extracted directly from general census. This shows the limit of these studies due to uncertainties related to this type of surveys and
7
assessments. Other limitations are attributed to objective practical and financial constraints, as recognized by Tantala et al. in the case of New York Metropolitan Region (Tantala et al. 2008). Therefore they pointed out the importance to identify the areas of highest potential vulnerability.
2.2.
Map unit
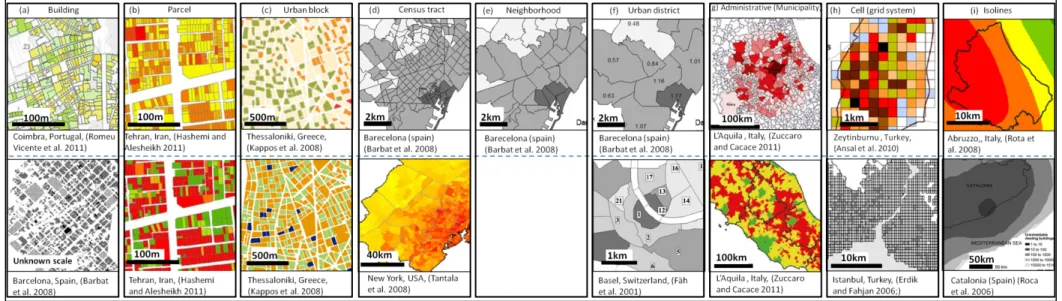
Nine map units have been inventoried in this set of studies: building, parcel, block, census tract, neighborhood, district, cell resulting from grid system, municipality (administration or territorial subdivision), and isolines. In some studies, a single map is showed while others use different cartographic representations. This latter case is illustrated in Barbat et al. (2008), where different maps have been performed based on the following map units: building, census zone, neighborhood and district. On the opposite, in Hassanzadeh et al. (2013), similar case regarding the size of the covered area (100km²), only building is used as a map unit. It is clear that using different maps based on different units reflects a concern of a legible overview of produced map which cannot be obtained when using building as a map unit.
Figure 1 presents the variety of graphic display of damage maps in this sample. Building as map unit refers directly to real element of built context. Damage value displayed is directly the estimation without additional processing. Parcel is a similar case when it contains a single building; a mean value is displayed if the parcel contains multiple built units. Thus, building or parcel has the advantage to point out directly the expected damage of individual objects. On the other side, when study area size is around several square kilometers, it becomes impossible to get an overall sight of the map as it contains too many details. The mosaic character makes it complex to visualize urban entities. Similarly to building and parcel cases, block refers to a real element of the built environment. It is a constructible area limited by streets. Therefore, it is an urban unit which has the same configuration over the world and does not depend on administrative subdivision. The aggregation of damage buildings of block increases the size of graphical map unit but mosaic aspect persists.
Another common map unit is census tract which is a geographical area defined for census purpose. Their limits (regarding number of inhabitants or housing units) is adopted in many countries in order to facilitate the task of surveyor agent (e.g. it's the case in Canada, France, Algeria, US, etc.). It is important to note that this leads to a variety of census tract surface. In comparison with building, parcel, and block units -which correspond to building scale-, census tract unit has the advantage to refer to urban scale. It permits a direct use of census data, as it is originally defined for its homogenous characteristics (population, building typology). The use of census tract also permits to have an overview of a wide urban area. The damage value of the census tract corresponds to the average damage value of buildings located within the census tract. This aggregation hides details and shows heavy trends which are suitable for the purpose of identifying the most vulnerable urban zones. Despite those appreciable advantages, the use of census tract as map unit may produce an effect of
8
abrupt transition between contiguous units. In addition, it hides the real urban structure, which is replaced by a puzzle picture with low legibility.
The authors having used grid system have motivated their choice by a better resolution unlike census tract or urban district (Ansal, Kurtuluş, and Tönük 2010). A cell size of 0.005° x 0.005° equivalent to 400m x 600m has been implemented in the metropolitan region of Istanbul and a grid system of 250mx250m cell size is implemented to the Zeytinburnu district (in Istanbul) (Erdik and Fahjan 2006). From a legibility point of view, this grid system totally hides urban structure and mosaic aspect is amplified. Besides these map units, district is an administrative subdivision which is a grouped neighborhood unit and is used to get an overall sight of a large area like a city or a conurbation. Its main disadvantage is the scale of map unit which corresponds in reality to a wide urban zone. Displaying an average value to such a zone ignores the effective variation of damage level at urban scale. In addition, if municipal map unit is meaningful for a global assessment at regional and national scale, it is obvious that at this scale the urban structure is illegible. Finally, another specific category of map of expected damage is constructed by isolines derived from the convolution of hazard isolines by fragility curves of a given building typology (Rota, Penna, and Strobbia 2008). This typological risk map is dedicated primarily to insurance purposes. It displays expected damage in any point of a region for a single building typology and does not reflect the expected damage for the exact building stock of a given urban zone. Thus it cannot be used for the purpose of urban requalification. Especially, in Roca et al. (2006), the adopted geographical scale and map unit do not allow visualizing damage variation at urban scale in relation to the real urban structure.
2.3.
Comments
This overview leads to the following comments:
1) Map unit: the very diverse map units used to map vulnerability reflects a lack of consensus and a need of a suitable map unit. The map units identified in this sample can be grouped in three categories according to their geographical scale: 1) building, parcel, block which can be considered as local or detail scales, 2) census tract, cell (grid system), neighborhood which refer to urban scale, and 3) district, municipality, region (by the mean of isolines map) which are administrative subdivision. For the purpose of this study and since the criteria of legibility of urban structure and damage variation at urban scale are considered essential for urban planning needs, it is therefore necessary to choose a map unit to display larger urban but not at cost of legibility.
2) Terminology: as this study deals with vulnerability at urban scale which means large scale study, it has faced an issue to define what are “large scale” and “urban scale”. In the domain of seismic vulnerability assessment, it is not easy to give a standardized definition of these terms. Large scale is used by some authors to refer to few hundreds of buildings or to areas smaller than 1km², meanwhile
9
others deal with hundreds of km² or hundreds of thousands buildings. It is therefore mandatory to define rationally those terms by its linking to the logic of urban structure.
3) New concern: urban requalification is not the main goal of seismic scenarios. This confirms the statement that management of emergencies is still the main focus as it was stated by Dusan Zupka (1992). However, some studies clearly refer to the preservation of historic cities as it is the case with Vienna (Achs and Adam 2012), Siexel (Ferreira et al. 2013) and Coimbra (Romeu Vicente et al. 2011). It is noticeable that these studies are very recent and it may indicate a new trend in the aims of seismic scenarios. Thus there is a need to develop adapted methodologies.
3. Urban requalification considerations, uncertainties issue and
proposal
Over centuries, urban dynamics have transformed cities into complex systems where inherited urban tissues coexist with new urban zones and heterogeneous building stock belong to different periods. Urban fabric is characterized by perpetual transformation of their buildings to fit with current urban dynamic. An insight in urban studies indicates that complexity is a recurrent concept due to the social, economic and urban interactions (Batty 2007; Helsley and Strange 2011; Rydin et al. 2012; Pickett et al. 2013; Samet 2013). For instance, growing needs: transportation (Timmermans, van der Hagen, and Borgers 1992; Dulal, Brodnig, and Onoriose 2011), densification (Govender, Jo M. Barnes, and Clarissa H. Pieper 2011; Arnberger 2012; Schmidt-Thomé et al. 2013), economic development (Jenkins and Wilkinson 2002; Semm 2011), etc. This induces permanent monitoring and answers by urban planning. In addition, since the 1990s, mitigation of industrial, ecological and natural risks is becoming a concern and urban planning is recognized to be an efficient tool (ISDR- United Nation 2004). Likewise, urban planners, architects and decision makers have to deal with growing complexity of the urban fact. An optimal solution does not lay in the consideration of single urban aspects but in the integration of most of them.
In this sense, this study aims at facilitating the exchanges by translating the results of geosciences in an understandable language for urban planners.
Over the world, it is common to use Master plan, general plan, specific plan, detailed plan, local plan (terms depend on specific country's terminology) to regulate and manage urban areas. These are considered as tools to guide private and public projects in a whole framework to ensure coherence of the totality. In addition to this regulatory approach, urban requalification as active action is undertaken when the opportunity is available. In these two situations, there is a need of communication of the outcomes of seismic vulnerability assessment to the different stakeholders and maps are an efficient tool of communication.
10
Another aspect that leads to search for a convenient mapping method is the uncertainty issue related to vulnerability evaluation. Several authors highlight the fact that huge uncertainties make difficult to consider results at the scale of individual building (Fäh et al. 2001; Roca et al. 2006; Guéguen, Michel, and LeCorre 2007; Oliveira 2008; Rota, Penna, and Strobbia 2008; Senouci et al. 2013). For instance, Fäh et al. (2001) established seismic scenarios for the city of Basel (Switzerland) using fragility curves derived from EMS vulnerability classes and ATC13 methodology. They mentioned that calculated damage must be taken as indicative values and can only be used as a rough estimate of the damage to buildings. Also, Roca et al. (2006) which implemented regional assessment (region of Catalonia in Spain) based on EMS98 macroseismic scale, stated that these methods are useful for large scale and when there is a lack of data or when preliminary results are needed in a short time. In the same sense, Rota et al. (2008) noted that estimated damage with fragility curves obtained by empirical approach does not represent the expected damage of single building. Moreover, Oliveira (2008), who worked on the Metropolitan area of Lisbon, identified the different sources of uncertainties in earthquake scenarios from seismic source to vulnerability modeling. Therefore, it is recognized that qualitative methods enclose uncertainties due to assumptions and summary survey. In this study which concerned more than 5,000 buildings, it has been found that differences in estimation from a method to another (GNDT, RISK-UE, and VULNERALP) are limited to acceptable intervals for the whole sample (equal or less than a half EMS grade) (Senouci and al. 2013). However, differences are higher at the individual building scale and can exceed one EMS grade. Those uncertainties have been explicitly shown in the EMS98 macroseismic scale (Grünthal 1998) which has considered vulnerability class in an interval of plausible vulnerability for the different building types. Thereafter, RISK-UE method has explicitly used this concept to estimate a vulnerability index as a plausible interval characterized by a mean value bounded by upper and lower limits. Thus, mapping the estimated seismic damage for individual buildings is irrelevant and lacks of accuracy. In addition, the use of single building as a visualization unit can lead to the misreading of earthquake scenarios by pointing individual buildings at a stage of overall seismic risk evaluation. Earthquake scenarios can enhance public awareness and decision makers can be involved to develop more effective steps to reduce seismic risk by undertaking detailed surveys. Considering earthquake scenario maps as an interface between scenario makers and stakeholders (as well as general public), such convenient interfaces should be developed.
Therefore, the present study has tested different aggregations of seismic damage of neighboring buildings in order to select the most relevant method. It takes into account uncertainties, urban scale, legibility of urban structure, and identification of the most vulnerable urban zones. Thus several cartography representations based on different map units have been performed and compared to deduce the most relevant.
11
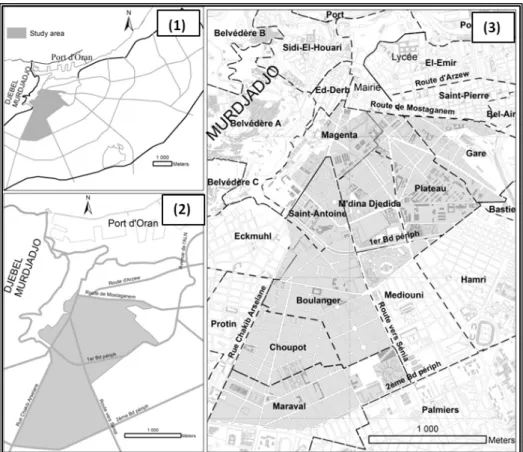
4. Origin of data
This study has used the outcomes of a preliminary evaluation of seismic risk in a district of Oran city (Senouci et al. 2013) (Figure 2). Vulnerability index and subsequently physical damage have been robustly estimated with semi-qualitative methods for a set of more than 5,000 buildings. The building data come from a detailed field survey performed in 2009 by CTC (the Algerian technical organism officially in charge of the Technical Control of Construction) in order to assess the state of conservation of existing buildings in Oran. This survey was not however intended to address the seismic safety of the existing building stock. As a consequence, the application of vulnerability evaluation methods has required adaptations and assumptions to use these data (Senouci et al. 2013). The choice of vulnerability evaluation methods among available ones in literature has considered the Algerian context, i.e. building types. In this sense, the methods corresponding to Mediterranean basin are the most convenient to our case study. Three qualitative methods of vulnerability evaluation using vulnerability index concept have been used: a) GNDT-level 2 (Benedetti et al. 1988); b) RISK-UE LM1 (Milutinovic and Trendafiloski 2003; Lagomarsino and Giovinazzi 2006) and c) VULNERALP (Guéguen et al. 2007). Estimate of probable physical damage varies from 0 to 1 for each of the five damage grades (1 to 5) of EMS98 macroseismic scale (G. Grünthal 1998). In regard to historic seismicity and recent seismic hazard studies of the city (CGS 2010), four scenarios have been established for the following intensities: VII, VIII, IX, and X. To illustrate the proposed methodology, the results obtained by GNDT method for the IX intensity scenario are shown in this paper. It is considered here that the soil conditions in Oran city, which are mostly rocky, play only a marginal role in the damage distribution compared to the variation in building vulnerability.
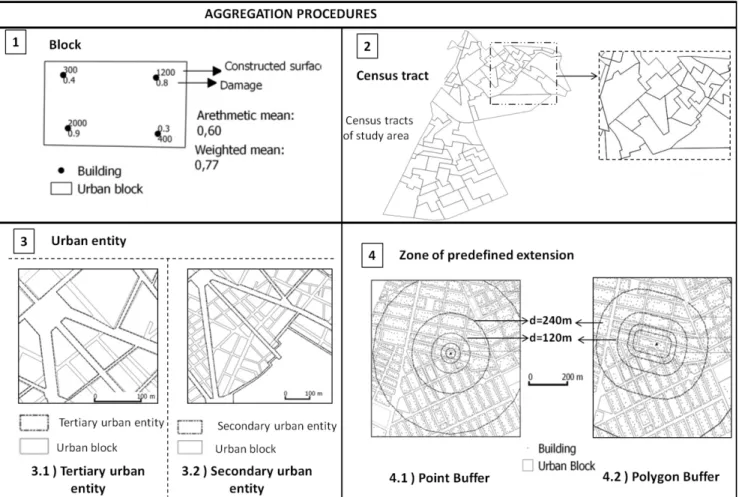
5. Aggregation procedures
Various aggregation scales have been considered and implemented within a GIS environment: 1) block, i.e., area limited by streets, 2) census tract, i.e., territorial unit used for census data, 3) urban entity, i.e., area which corresponds to one or multiple neighborhood and is defined by urban structure, and 4) a zone of predefined extension around a building or a block which is implemented in GIS by the "buffer function" (Figure 3). For each aggregation two values have been calculated and mapped: 1) arithmetic mean and 2) weighted mean which keeps proportional to the total floor surface by building surface (total floor surface i.e. ground level surface times number of floors). While the first mean considers equally all buildings, the second mean points out the vulnerability trends related to higher total surface buildings as is illustrated in Figure 3 (in the top left of figure). The arithmetic mean found a lower vulnerability (i.e. 0.60) than the weighted mean (0.77). In order to visualize easily the most vulnerable zones, an average damage has been computed for the whole study area (considering both averaging procedures: arithmetic and weighted), and only zones with damage higher
12
than this average value are displayed for outlining the most vulnerable areas. The idea of weighting by total floor surface has been proposed by Kappos et al. (2008) (Kappos, Panagopoulos, and Penelis 2008) and the idea of map representing higher values than average can be attributed to Benedetti et al. (1988) who suggested to establish maps showing the difference of each building vulnerability index with the average value of the studied area. Graphically, the different values cited above are displayed for each kind of aggregation in maps organized in two pairs of columns (from Figure 5 to Figure 8). The right pair (two columns) is for maps displaying arithmetic values while the left pair is for weighted values.
Three main criteria are considered to evaluate the relevance of cartographic representation of earthquake damage for urban planning needs.
The first one takes into account the statistical significance of the estimated damage, which cannot be considered reliable at individual building scale as it is estimated by methods based on damage statistics observed during past earthquakes. Thus, aggregations are deemed reliable only when performed over a large enough number of neighboring buildings. Statistics of aggregated buildings has revealed four categories: a) units, b) tens, c) Hundreds, d) thousands (Figure 4). For example, the units category which refers to less than ten or few tens is represented by: 1) aggregation by point buffer of 30m which contains for 75% less than 10 buildings, 2) aggregation by block which contains in average 12 buildings and exceeds 20 buildings only for a minority of blocks (around 15%). The next category; corresponds to typically tens of buildings; groups various aggregations: census tract, point buffer of 60m, polygon buffer of 30m and 60m, and tertiary urban entity. This gives to the obtained average value a specific representativeness of neighboring buildings.
The second criterion is to keep the possibility to identify clear variations at urban scale in order to delineate homogenous urban zones with a suitable size for urban projects. A small number of very large zones are not convenient because of limited resources and the same for the other extreme i.e., many, very small zones because of the difficulty to select priority zones.
The third one deals with the legibility of the urban structure. It is a central concern for urban planning and depends basically on the map unit used.
5.1.
Urban block
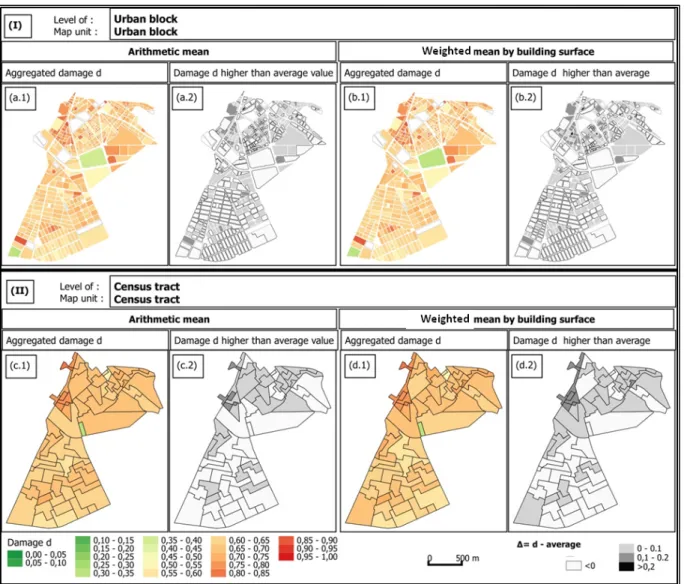
Aggregating the damage of buildings belonging to a given block is an evident procedure. The concerned buildings are in an area generally limited by streets. In addition, block as a map unit displays the average damage of its constituent buildings. For the downtown area of the city of Oran, the number of aggregated buildings by this procedure is in most cases (83% of the 447 blocks of the study area) less than 20 buildings (Figure 4). As a result, the cartographic representation of this aggregation is dominated by local variations that confer a mosaic aspect (Figure 5). The alternative
13
weighting by total floor surface leads to only slight differences. Visually it is not possible to distinguish a clear homogenous vulnerable urban zone due to the dispersion of vulnerable blocks.
5.2.
Census tract
Census tracts are a territorial subdivision used for periodic census of population and housing. Therefore, to facilitate data collection, the size is adapted locally as a function of population density to obtain units with comparable number of inhabitants. This results in irregular shapes and heterogeneous sizes for census tracts in the study area (General census of population and housing of 2008), which in addition may not always follow the urban structure. The number of buildings included in each census tract varies a lot with a mean of 78±48 buildings (Figure 4). The use of weighted damage has a perceptible effect in the display of most vulnerable urban zones (maps c and d of Figure 5). The lack of legibility of these maps should be mentioned: on one hand, it is not possible to identify clearly the concerned urban zone (absence of landmarks as streets) and on the other hand, the transition from unit to its contiguous neighbor is abrupt. The result is a puzzle with a mosaic aspect over relatively larger area.
5.3.
Urban entity
To avoid the observed drawbacks in the previous aggregations (i.e. by block and census tract), an attempt has been done by defining aggregation entities according to the urban structure. Therefore, it is named herein urban entity a zone outlined by continuous elements of urban structure like streets and urban limits (railway, city wall, natural limits, etc.). It represents the notion of neighborhood from urban function and organization point of view. The delineation is based then on street hierarchy: primary, secondary and tertiary streets (Figure 3). It is notable that the notion of urban scale is imprecise and not unique, i.e. multiple urban scales coexist. The smallest urban scale is the block which constitutes an elementary urban module, while the largest possible one is the whole conurbation.
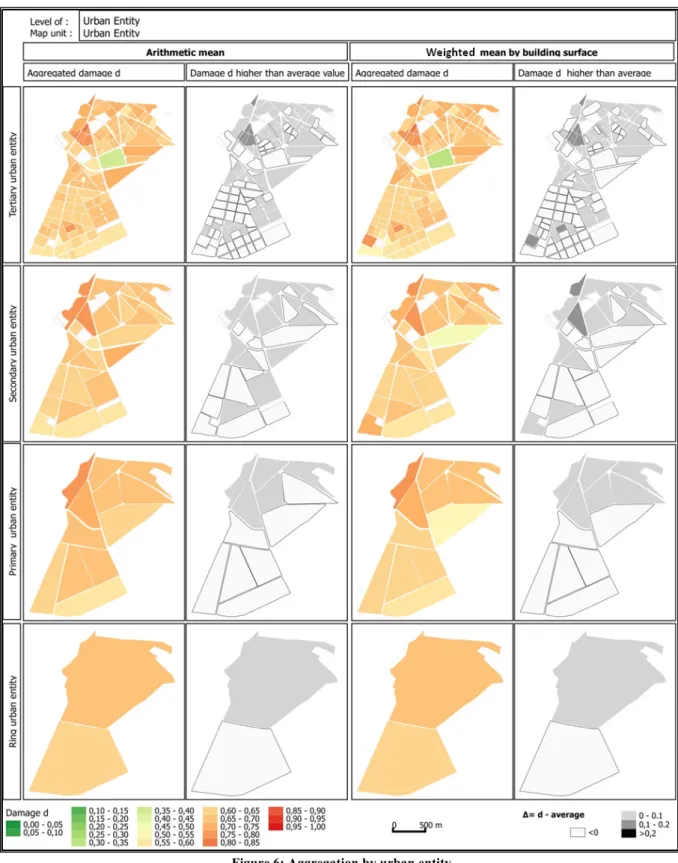
Due to concentric urban development of Oran city, another street type of higher hierarchy is noted: ring road. Nowadays there are four ring roads that delimitate larger urban zones of Oran city and constitute major landmarks of successive phases of urban extension of the town. In this sense, the study area is limited in the South by the second ring road and it is divided from East to West in two parts (northern and southern parts) by the first ring road. Thus, four different subdivisions have been performed. The first one is the subdivision of the study area in two big "ring entity" while the second one uses primary streets which have produced 12 "primary urban entities" (primary entity). The third subdivision also considers secondary streets, resulting in 30 urban entities (secondary entity). Finally, the use of tertiary streets has produced 129 urban entities (tertiary entity). For each subdivision, it is noted that the number of aggregated buildings varies significantly from an entity to another as attested by the high value of standard deviation. For instance the average number of aggregated buildings for
14
primary entity is 450±254 and for secondary entity is 180±173 (Figure 4). Despite the fact that the subdivision strategy has been based on a determinant element of urban structure (street hierarchy), difficulties have risen during the identification of urban entities due to unclear status of some streets, to the existence of fragment entities in the border sides of the study area and also in relation to the desirable goal to obtain urban entities of comparable size.
Each subdivision has led to a different cartographic representation of aggregated damage (Figure 6). The use of floor surface weighting has generally only a slight impact but exception is observed for the map based on secondary urban entity where two urban entities are evidenced more vulnerable than the average of study area. It is also possible to notice that the passage from a map of subdivision to another with increasing urban entity size is accompanied by the disappearance of higher vulnerability zones for instance from secondary entity subdivision to primary entity subdivision. The inverse is also true: low vulnerability zones disappear when passing from secondary to primary subdivision.
From a legibility of view, the use of urban entity (tertiary and secondary subdivisions) offers more clarity on the vulnerability distribution and it is spatially clearly delimitated. However, the increase of size (primary and ring subdivisions) has a strong smoothing effect, and tends to show only the mean of the study area and consequently does not reveal the most vulnerable zones.
5.4.
Predefined area based on GIS buffer function
The difficulties revealed by the use of census tract and urban entity as map units have led to find out an alternative aggregation procedure with easier automation in GIS software. Among GIS functions, buffer as a spatial analysis function is defined by the Environmental Systems Research Institute (Esri 2014) as “a zone around a map feature measured in units of distance or time or as a polygon enclosing a point, line, or polygon at a specified distance”. Therefore buffer function is used in this study to aggregate damage of neighbor buildings at different distances in order to outline the existence or not of a consistently higher vulnerability. Buffers which have been generated for buildings represented by point feature are named "point buffer". For blocks represented by polygon buffer features are named "polygon buffer" (Figure 3). Different distances have been used. They have been generated by a geometric progression based on the distance 30m and a ratio of 2 (30, 60, 120, 240, 480, and 960m). 30m is chosen to permit the aggregation of the closest buildings; with the increase of distance, more and more buildings are involved.
5.4.1 Point buffer (building buffer)
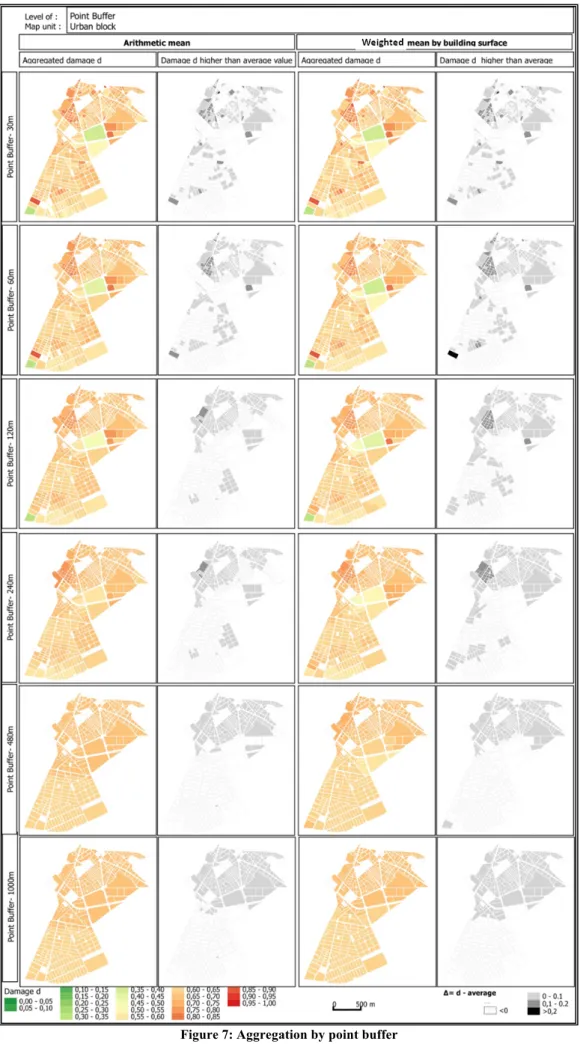
Six maps have been realized using the six different distances obtained by geometric progression. For each map, a point buffer is generated for each building with a specified distance (30 to 960m). For each buffer, the average damage of buildings located within the buffer circle is calculated and affected to its origin building as its new damage value. Each building is thus assigned a new smoothed damage
15
value. Then, these new damage values are averaged for each urban block, which is used here simply as a map unit. The average number of buildings involved for such a smoothing increases greatly with buffer length, from 7±4 for a 30m buffer to 2676±530 buildings for a 960 m buffer (Figure 4). For the map based on point buffer with distance 30m (Figure 7), the cartographic representation indicates an almost similar distribution to the map based on aggregation by block (Figure 5). A slight smoothing effect of the aggregation procedure is perceptible on the map based on a 60 m buffer distance, while an extreme smoothing is noted for distance 960m. The latter is almost similar to the map based on urban "ring entities" (Figure 6). The successive buffers (from 30m to 960m) tend to approach more and more the average value of the study area (Figure 7).
5.4.2 Polygon buffer (block buffer)
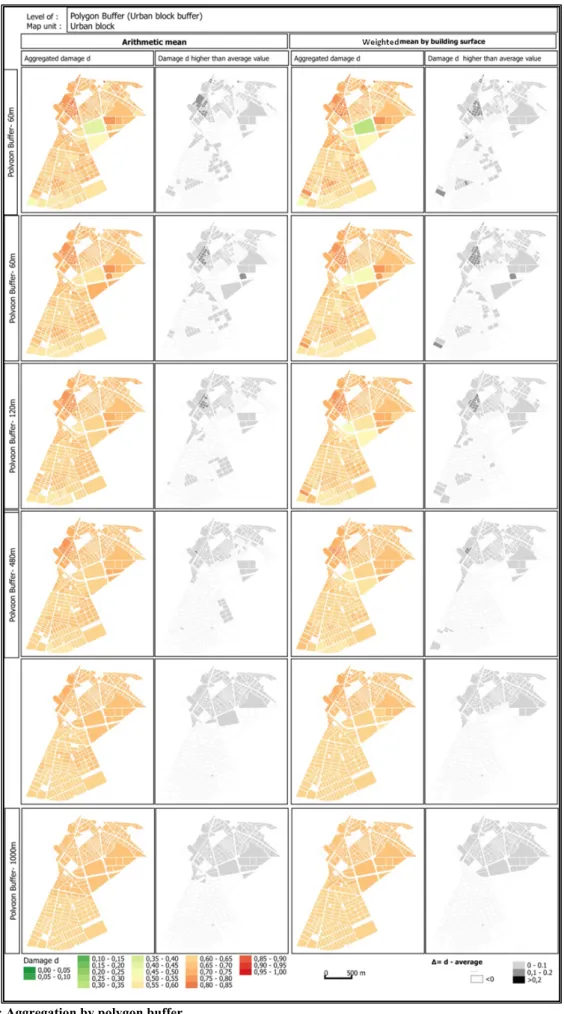
Aggregation by polygon buffer involves buildings surrounding the concerned 447 blocks using the different distances mentioned above. The mean value obtained for each polygon buffer is affected to its concerned block. As for the previous point buffer procedure, block is used as the elementary map unit to display the estimated average damage. In parallel to the increasing size of buffer, more and more buildings are aggregated; mean for polygon buffer of 30m is 31±16 and reaches 2645±564 for polygon buffer 960m, resulting in a much stronger smoothing. For buffers of 480m and 960m, the obtained maps are visually similar to others based on primary urban entities subdivision and ring entities, where it is clearly visible that the Northern zone has higher vulnerability than the Southern zone (Figure 8).
5.4.3 Comments about aggregation procedures
Point and polygon buffers lead to very similar results. Compared to other aggregation procedures, they are easier to implement in GIS software and they gradually detect vulnerable urban zones by hiding local variations in favor of heavy trends of vulnerability distribution. In this way, buffers have the ability to detect the extension of vulnerable zones and to confirm concerned urban fabrics. In comparison with point buffer aggregation procedure, polygon buffer procedure needs less calculation resources of PC and is also less time-consuming. The distances (30m, 60m, 120m, 240m, 480m, and 960m) used to generate buffers as a multiple of 30m were chosen empirically to fit with urban characteristics of the study area. 30m permits an aggregation of the closest buildings while with successive increasing length larger and larger zones are enclosed. Compared to urban entities, a certain resemblance in terms of aggregated buildings number (Figure 4) and visual aspect of map are noted, e.g. between: map of polygon buffer/120m and map based on secondary urban entity (Figure 6); map of polygon buffer/240m (Figure 8) and map of primary urban entity; and polygon buffer/960m, point buffer/960m and ring urban entity. But these specific results, e.g. buffer size, may vary from a city to another due to different urban structure (street network, street hierarchy and size of blocks). Thus it is suggested to consider the methodological process of selection of a convenient display of vulnerability trends by searching a compromise between global and local vulnerability distribution in the study area.
16
In other words, the identification of vulnerable urban zones is based on multiple views at various urban scales.
6. Discussion
The implementation of the different aggregation procedures on the study area has produced several visualizations of vulnerability distribution via multiple maps (from Figure 5 to Figure 8). The problem is now more precise: how to define an optimal compromise between the two extreme, i.e. between maps showing average value of wide urban zone, and maps with mosaic aspect (e.g. buildings or block vulnerability maps)? A comparison of their statistical characteristics concerning the number of aggregated buildings and the obtained value of aggregated damage has therefore been performed to select the suitable map. For small aggregation scales, one may also question the robustness of the estimated damage values, since vulnerability index methods have only a statistical meaning and should not be applied to too small building samples. Also, displayed aggregated values are compared to original values of buildings or block and it is considered herein an effective aggregation that conserves damage value the nearest possible to original values and in the same time detects the most vulnerable zones.
6.1.
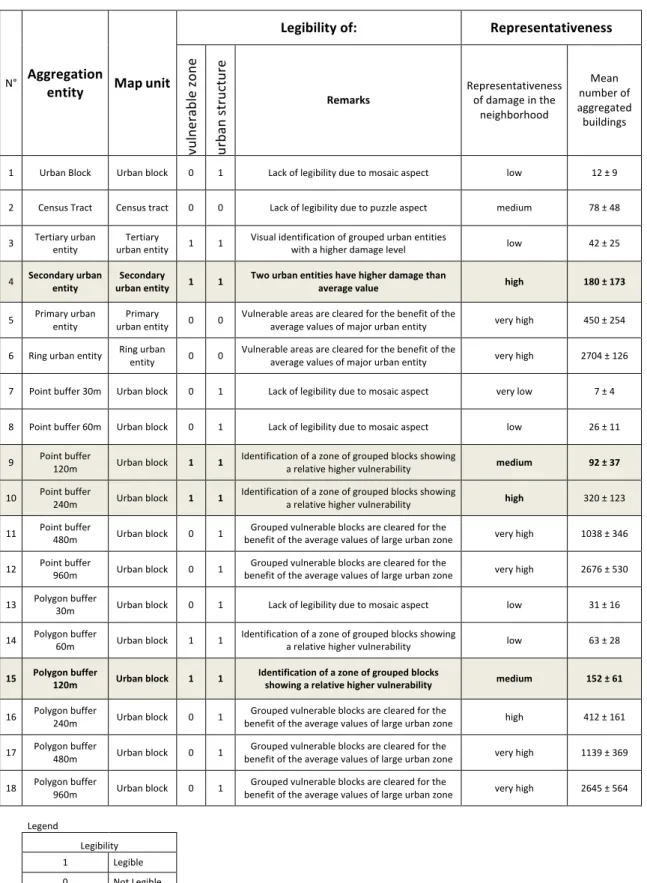
Legibility and representativeness
The different aggregation procedures have produced 18 different maps (or 36 maps, considering 18 maps with arithmetic mean and 18 with weighted mean). Table 2 summarizes the obtained legibility and the statistical measure of representativeness of displayed damage values. According to visual aspect of a given vulnerability map, a judgment is done whether it provides legibility of vulnerable zones, i.e. evident visual distinction of the most vulnerable zones. A derived map showing the difference between damage level of a given unit with the average damage value of the whole study area is used to rank vulnerable zones based on a step of half an EMS damage grade (damage d=0.1 is equivalent to a half EMS damage grade). In addition, it is stated for each map category whether the urban structure is legible or not. Maps based on census tract and large urban entities have been judged not suitable for urban structure legibility, unlike maps based on block as a map unit as they reveal urban structure. Another judgment made for each aggregation procedure concerns the representativeness of aggregated damage of its neighboring. For a single aggregation procedure, a low average number of aggregated buildings is synonymous of dominating local variations; a high value reflects heavy trends of vulnerability distribution where punctual vulnerable buildings have no impact (hidden by the average value of their neighbors). On the other hand concentration of several buildings will create a zone with an evident relative higher vulnerability compared to its neighboring. According to this criterion, aggregation by block (mean aggregated buildings number is 12±9), tertiary urban entity (42±25), point buffer/30m (7±4), point buffer/60m (26±11), polygon buffer/30m (31±16) can be
17
considered as providing a hardly-legible mosaic-like damage map, which is in addition based on not so reliable and robust estimates. On the other side, secondary urban entity (180±173), primary urban entity (450±254), ring urban entity (2704±126), point buffer/240m (320±123), point buffer/480m (1038±346), point buffer/960m (2676±530), polygon buffer/240m (412±161), polygon buffer/480m (1139±369) and polygon buffer/960m (2645±564) provide largely smoothed maps where only large-scale damage zones can be identified. Between these two extreme groups, an intermediate one is observed: polygon buffer/60m (63±28), census tract (78±48), point buffer/120m (92±37) and polygon buffer/120m (152±61) seem good compromise where local variations are not entirely cleared and heavy trends of vulnerability distribution are outlined. In conclusion, the crossing of judgments has highlighted the relevance of aggregation by secondary urban entity, point buffer/120m, point buffer/240m and polygon buffer/120m.
6.2.
Increase of robustness of vulnerability assessment
At the stage of vulnerability assessment, a good agreement has been found at urban scale between VULNERALP, RISK-UE, and GNDT approaches (Senouci et al. 2013). For instance, the mean difference between the last two methods is -0.067, i.e. slightly above one quarter EMS grade (Figure 9). Meanwhile, at the level of single building the variation has a relatively wide range of more than one and a half EMS damage grade [-0.3; 0.3], given that an EMS grade is equivalent to 0.2.
Figure 9 displays that aggregation increases the robustness of damage estimation. The different box-and-whisker plots indicate a different variation of the box and whiskers The level of single building shows a wide interval of difference between damage estimated by the two methods [-0.335; 0.333], while the aggregation by buffer of 960m is characterized by small interval [-0.082; -0.051] around the constant mean value -0.07. The smoothing by aggregation by block has a significant impact in the reduction of the variation interval of the two parts box and whiskers. While the extreme values (whiskers) remains more or less comparable in the cases of aggregation by block, block buffer of 30m and 60m the box shows a gradual reduction. From the distance of 120m, both box and whiskers are decreasing until the distance 960m. The standard deviation is another expression of this trend of reduction of differences between the two methods due to aggregation. The buffer length of 120m appears as a balance between representation of global and local trends of vulnerability as it represents a significant reduction of the variation of differences between the two methods and at the same moment keep enough variation to distinction of zones of high and low vulnerability.
A reduction trend of their differences according to growing buffer size (point buffer or block buffer) is noted. The smoothing operated by aggregation eliminates high differences and tends to bring them closer to their mean value of difference (-0.067), which is clearly shown by buffer of 960m.
18
Observing the evolution of differences between the two methods, the trend leading to the reduction of their variation interval is dependent on the amount of aggregated buildings. Values of buildings number is minimum in the case of aggregation of block, less than 20 buildings, and grows with the increase of the length of buffer, for instance the polygon buffer, in a steady way: 31, 63, 152, 413, 1142, and 2649 buildings for the six buffer's lengths (30, 60, 120, 240, 480, and 960m). With the lengths of 60m and 120m, an appreciable amount of buildings are involved: 63 and 152 respectively. That confers a statistical meaning because dozens of buildings are aggregated and at the same time, it conserves a consistent interval of damage variation allowing the display of vulnerability variation on the map.
Other statistical parameters have been used to describe this impact of smoothing which are: standard deviation of differences between the estimations by the two methods and correlation coefficient of the aggregated values of damage (Figure 9). Concerning standard deviation, it decreases from a value of 0.091 (i.e. half a EMS damage grade) at the level of building and drops to a negligible value of 0.005 for the largest units. The correlation coefficient increases with smoothing realized by aggregation by block and buffer (point and polygon buffer). Originally, the correlation coefficient between the two methods has a value of 0.58. This value is improved by aggregation by block which brings it to 0.69. This tendency is confirmed with buffers. For example, in the case of polygon buffer, the coefficients of correlation are: 0.63; 0.64; 0.69; 0.72; 0.81; 0.96 respectively for 30m; 60m; 120m; 240m; 480m; and 960m. This finding is important for vulnerability assessment using vulnerability index approach, in regard to the inaccuracy of vulnerability index (or probable damage) at the level of building due to huge uncertainties related to summary survey and statistical significance of the estimation. The latter is related to the empirical and statistical approach leading to the elaboration of qualitative methods which have been based on statistical studies of damages of past earthquakes. Furthermore, recent EMS98 macroseismic scale (G. Grünthal 1998) and subsequent qualitative methods, e.g. RISK-UE, emphasize the fact that the estimation should be considered in the interval of confidence which varies according to the typology of building. Thus, this statistical significance does not allow an interpretation of damage estimated at the level of building. In this sense, a gain of robustness and significance can be obtained by aggregation that enhances the reliability of the vulnerability assessment independently of used method.
6.3.
Quantitative search for the most suitable compromise
In addition to visual judgments of maps and statistics of aggregated buildings, the search of a suitable compromise between displaying local or global variations of vulnerability has used as indicators the damage range and the difference between two pairs of values (F100; F99) and (F1; F0). The idea is that
extreme values hinder a global sight of vulnerability distribution at urban scale as it is the case in maps obtained by aggregation by block where a mosaic aspect has been noted (Figure 5). While successive
19
aggregations with growing entity size bring extreme values back to the average of the study area, it is possible to investigate how the aggregation scale reduces the span of extreme values. Figure 10 displays the evolution of fractile values (extreme values F0 and F100 , fractiles 1%, 15%, 50%, 85% and
99%). The convergence between the two pairs of line graphs (F100;F99) and (F1;F0) leads to their
superposition.
A common characteristic of the three main aggregation procedures (urban entity, point buffer, and block buffer) is the gradual decrease of damage range with increasing aggregation scale. The latter reaches 0.65 at the building level, which is equivalent to three and a quarter EMS damage grades, and it decreases slightly by aggregation by block to the value of 0.59. If the aggregation by polygon buffer is considered, a first drop of damage range to 0.38 is recorded for the buffer/30m and it drops down to negligible value of 0.06 (almost a quarter of EMS damage grade) with buffer/960m. An intermediate situation is offered by buffers of 60m and 120m where damage range is about one EMS damage grade. The visual judgment of maps indicates that this range is the minimal one to classify urban zones in distinct levels of damage with intervals of a half EMS damage grade.
At the bottom right side of Figure 10, graph 9 shows the convergence between the two pairs fractiles (F100;F99) and (F1;F0) starting from an important difference of 0.17 for building level (close to one
EMS damage grade) to a negligible value (0.005) at the length of 120m. It is also the case for aggregations based on urban entity or point buffer. For the first convergence, it is noted at secondary urban entity and for the second at point buffer of 120m (for graphs with arithmetic mean). For graphs using weighted mean (by total building surface), convergence is reached for tertiary urban entity, polygon buffer/120m and point buffer/240m. Furthermore the graphs show also the standard deviation of damage having a steady decrease according to the growth of aggregation entity.
In view to identify most vulnerable fabrics, it is important to balance by the aggregation process the display of punctual and global variations of vulnerability at urban scale in order to identify homogenous vulnerable zones. An excessive smoothing leads to invariable damage level on wide zones. In consequence, zones with low vulnerability can be contaminated by a high vulnerable neighborhood. In Figure 7, an example of this case is available and is represented by a large green block in the center of the study area. The green color in the map based on aggregation by point buffer/30m expresses that second EMS damage grade changes progressively with the increase of the length of buffer forward 960m to orange color representing the fourth EMS damage grade. To avoid such situations, it is important to detect the most convenient threshold of aggregation by considering the damage range and the difference of the two pairs fractiles (F100;F99) and (F1;F0) that confirm the
20
6.4.
Adopted map and results for urban requalification
The multiple choices for cartography of probable damage have been reduced by crossing the following criteria: 1) robustness of damage estimation, 2) legibility of urban structure, 3) Identification of the most vulnerable zones, 4) representativeness of displayed damage value of the neighborhood damage, and 5) convergence between the two fractiles of (F100;F99). The attempt to obtain a vulnerability map
with a legibility of urban structure had recourse to the subdivision of study area in urban entities reflecting urban structure. But this revealed to be an uneasy task due to intrinsic complexity of urban structure and to the coexisting different urban scales, related to modularity and hierarchy phenomena in urban structure. As a result, the coexistence of multiple urban scales implies different visualizations of urban vulnerability in order to determine the extension of vulnerable urban zones. The use of small urban entities (e.g. tertiary entity) has led to multiple contiguous and dispersed vulnerable zones. On the other extreme, the use of very large urban entities has hidden the most vulnerable zones as it was the case in ring entities or buffers of 960m. The comparison of maps based on arithmetic mean and those based on weighted mean by the total building surface has shown a better detection of vulnerable zone by the second type (weighted mean). This shows the interest of using both of them: in the case of dominant low-surface vulnerable buildings, arithmetic mean is more indicated to detect vulnerability zone; in case of dominant large-surface vulnerable buildings, the weighted mean is more suitable, which is the case of the present study area.
Considering the numerous needs of a city, the various levels of decision making (local, regional, national), it is an evidence that those outcomes may be differently used or interpreted. To prioritize the actual piece of urban fabrics that need requalification, the proposed method consists in combining and crossing different views of the vulnerability spatial distribution. The best aggregation maps have been selected from each aggregation procedure (based on weighted mean damage): 1) secondary urban entity, 2) point buffer/120m and 3) polygon buffer/120m (Figure 11). The map obtained by aggregation by block is considered as a reference map because it displays the original damage values (with a slight smoothing). The other three selected maps, representing a relatively strong smoothing, have the role to facilitate the identification of the most vulnerable zones at the scale of urban fabrics. The goal is to take urban fabric as a unit entity to facilitate for urban planner or decision makers the conception of appropriate urban interventions. Thus, the following steps in this prioritization process are: 1) crossing the selected maps to determine the common higher vulnerability zones and 2) referring to block aggregation map (the reference map) to confirm the level of vulnerability especially at the urban limits of the study area.
The final map (Figure 12) is a refinement of the map based on secondary urban entity (Figure 11) to fit with the limits of urban zones indicated by the aggregation by point and polygon buffers and confirmed by the reference map. The crossing of the maps has revealed that some urban entities (of the
21
map to refine) enclose zones with both low and high vulnerability. Then the limits of those entities have been modified and in consequence the resulted zones are more homogenous. In addition of homogeneity parameter, the existence of grouped vulnerable block has been considered as a criterion to class a given urban fabric as vulnerable. In the case of dispersed vulnerable blocks, the corresponding urban fabric is assigned a lower priority order. In the context of urban requalification, priority order is used to indicate whether a given urban fabrics needs a global urban intervention in case of high priority (1st First priority). A global urban intervention includes a set of actions at the level of buildings, blocks, street network, and activities. In case of low priority (3rd Third priority), the
actions are limited to the most vulnerable buildings. Such actions may include retrofitting or demolition-reconstruction. The intermediate priority (2nd priority) corresponds to entities with several
vulnerable buildings. Three situations can be faced: 1) dispersed vulnerable buildings needing actions at the single building level; 2) dispersed blocks enclosing grouped vulnerable buildings that need intervention at the level of block, or 3) grouped vulnerable blocks as a fragment of urban fabric which need similar actions of entities of first priority (1st priority).
7. Conclusion
In this ongoing research, an attempt to perform a relevant cartographic representation for the purpose of urban requalification projects has been undertaken. Noting the diversity characterizing the mapping of probable earthquake damage in the available literature, and the lack of a priori optimal scale for urban planning, the questions were: 1) how to identify vulnerable zones starting with estimated damage at building level?; 2) what would be a suitable map unit to ensure legibility of vulnerability distribution and urban structure?
Starting with the outputs of probable damage estimation for an intensity IX scenario by qualitative methods (GNDT, RISK-UE and VULNERALP) at the level of building of a set of more than 5,000 buildings, the proposed method has used GIS to perform different aggregations by: block, census tract, urban entity, point and polygon buffer to realize gradual smoothing. Each performed map displayed one of the following aggregated damage: 1) arithmetic mean and 2) weighted mean by total building surface. The goal of those aggregations is to pass from a display of individual values to aggregated values which express heavy vulnerability trends in the study area. In addition to visual judgment, quantitative indicators as range of damage and difference between the two pairs (maximum; 99th
fractile) and (1st fractile; minimum) have been used to find suitable aggregation. Urban block as an actual and a modular element of urban fabrics ensures legibility of urban structure by revealing its street network and built elements has been used as map unit (map pixel). The maps generated with increasing aggregation scales allow to detect at what urban scale the legibility of the most vulnerable zones is optimal, and which averaging procedure (arithmetic or total floor surface weighting) better detects vulnerable zones. In addition, aggregation increases the robustness of the results of the damage
22
estimation independently of used method as it is shown by the decrease of range of differences between the results of GNDT and RISK-UE methods. The decrease of standard deviation of those differences and the increase of correlation coefficient attest the same finding.
As one among several eventual uses of the outcomes of the maps based on aggregation, a prioritization process has been suggested. The selected maps from the different aggregation procedures have been crossed and combined to refine the limits of urban entities. A priority scale of three classes with decreasing importance (first, second and third priority) assigns each urban fabric the most convenient actions. The research of legibility of both most vulnerable zones and urban structure is intended to help decision makers in undertaking a requalification project to ensure both the prevention of earthquake disaster and current urban needs.
Finally, this study has to be considered in its limits. The focus has been made on the graphic representation of vulnerability at urban scale to identify the most vulnerable zones that would be eligible for an urban requalification. Further and detailed studies are needed when the option of urban requalification is adopted in the decision making process. Concerning dispersed vulnerable buildings, it is assumed that they have to be handled individually. In addition, in view to get confirmation of this approach tested on Oran city, there is a need to implement it in other contexts. Further developments of this ongoing research should focus on the refinement of the delimitation of urban units (entities), prioritization procedure of vulnerable zones and also the full automation of the method in GIS environment.
Acknowledgment
This work has been achieved thanks to the support of different institutions: Department of Architecture of the Faculty of Architecture and Civil-Engineering (FAGC) of USTO-MB University of Oran (Algeria), CTC d'Oran (Office of Technical Control of Construction), and ISTerre Laboratory of UGA (University of Grenoble-Alpes, France)
References:
Achs G, Adam C (2012) Rapid seismic evaluation of historic brick-masonry buildings in Vienna (Austria) based on visual screening. Bull. Earthq. Eng. 10:1833–1856
Anagnostopoulos S, Providakis C, Salvaneschi P, Athanasopoulos G, Bonacina G (2008) SEISMOCARE: An efficient GIS tool for scenario-type investigations of seismic risk of existing cities. Soil Dyn. Earthq. Eng. 28:73–84