Anti-glitches in the Ultraluminous Accreting
Pulsar NGC 300 ULX-1 Observed with NICER
The MIT Faculty has made this article openly available.
Please share
how this access benefits you. Your story matters.
Citation
Ray, Paul et al. "Anti-glitches in the Ultraluminous Accreting Pulsar
NGC 300 ULX-1 Observed with NICER." Astrophysical Journal 879, 2
(July 2019): 130 © 2019 The American Astronomical Society
As Published
http://dx.doi.org/10.3847/1538-4357/AB24D8
Publisher
American Astronomical Society
Version
Final published version
Citable link
https://hdl.handle.net/1721.1/130259
Terms of Use
Article is made available in accordance with the publisher's
policy and may be subject to US copyright law. Please refer to the
publisher's site for terms of use.
1Space Science Division, U.S. Naval Research Laboratory, Washington, DC 20375, USA;paul.ray@nrl.navy.mil 2
IRAP, CNRS, 9 avenue du Colonel Roche, BP 44346, F-31028 Toulouse Cedex 4, France
3
Université de Toulouse, CNES, UPS-OMP, F-31028 Toulouse, France
4
Department of Physics and Astronomy, Haverford College, 370 Lancaster Avenue, Haverford, PA 19041, USA
5
Mathematical Sciences, Physics and Astronomy, and STAG Research Centre, University of Southampton, Southampton SO17 1BJ, UK
6
The Hakubi Center for Advanced Research and Department of Astronomy, Kyoto University, Kyoto 606-8302, Japan
7
X-Ray Astrophysics Laboratory, NASA Goddard Space Flight Center, Greenbelt, MD 20771, USA
8
Physics and Astronomy, University of Southampton, Southampton, Hampshire SO17 1BJ, UK
9
Columbia Astrophysics Laboratory, Columbia University, 550 West 120th Street, New York, NY 10027, USA
10
Chesapeake Aerospace, Grasonville, MD 21638, USA
11
MIT Kavli Institute for Astrophysics and Space Research, Massachusetts Institute of Technology, Cambridge, MA 02139, USA
12George Mason University, resident at the Naval Research Laboratory, Washington, DC 20375, USA 13
National Space Institute, Technical University of Denmark, Elektrovej 327-328, DK-2800 Lyngby, Denmark
14
Code 681, NASA Goddard Space Flight Center, Greenbelt, MD 20771, USA
15
NASA Marshall Space Flight Center, NSSTC, 320 Sparkman Drive, Huntsville, AL 35805, USA18
16
Universities Space Research Association, NSSTC, 320 Sparkman Drive, Huntsville, AL 35805, USA
17
Astrophysics Science Division and Joint Space-Science Institute, NASA Goddard Space Flight Center, Greenbelt, MD 20771, USA Received 2018 December 7; revised 2019 May 23; accepted 2019 May 26; published 2019 July 16
Abstract
We present evidence for three spin-down glitches(or “anti-glitches”) in the ultraluminous accreting X-ray pulsar NGC 300 ULX-1, in timing observations made with the Neutron Star Interior Composition Explorer. Our timing analysis reveals three sudden spin-down events of magnitudes Δν=−23, −30, and −43 μHz (fractional amplitudesΔν/ν=−4.4, −5.5, and −7.7×10⁻⁴). We determined fully phase-coherent timing solutions through thefirst two glitches, giving us high confidence in their detection, while the third candidate glitch is somewhat less secure. These are larger in magnitude (and opposite in sign) than any known radio pulsar glitch. This may be caused by the prolonged rapid spin up of the pulsar, causing a sudden transfer of angular momentum between the superfluid and non-superfluid components of the star. We find no evidence for profile or spectral changes at the epochs of the glitches, supporting the conclusion that these are due to the same process as in normal pulsar glitches, but in reverse.
Key words: pulsars: general– pulsars: individual (NGC 300 ULX-1) – X-rays: binaries
1. Introduction
Ultraluminous X-ray sources (ULXs) are extragalactic, bright X-ray point sources with super-Eddington luminosities for isotropic emission due to accretion onto a neutron star or stellar-mass black hole (see Kaaret et al. 2017, for a recent review). Following the discovery of X-ray pulsations from a handful of ULXs, with periods ranging from 0.42 s to ∼31 s (Bachetti et al. 2014; Fürst et al. 2016; Israel et al.
2017a,2017b), it has been suggested that the central engines
of most ULXs could be highly magnetized accreting neutron stars, based on theoretical (King & Lasota 2016; Mushtukov et al. 2017) or observational arguments (Koliopanos et al. 2017; Walton et al. 2018b). Further evidence comes from the
claimed discovery of cyclotron resonant scattering features (CRSFs) in two ULXs (Brightman et al. 2018; Walton et al.
2018a), albeit one of them with no detected pulsations.
The ULX in the nearby spiral galaxy NGC 300(D=1.87± 0.12 Mpc; Rizzi et al. 2006) was mistakenly classified as a
supernova (SN 2010da) upon its discovery (Monard 2010).
Follow up Chandra observations showed that the system
is instead a high-mass X-ray binary undergoing an outburst (Binder et al. 2011). Using observations obtained in 2016
December with XMM-Newton and NuSTAR, Carpano et al. (2018b) discovered X-ray pulsations at a frequency of ν=
31.6 mHz(P=31.6 s, first reported in Carpano et al.2018a),
thus revealing the compact object as a neutron star. They also found that the pulsar is spinning up very rapidly with n =˙
´
-5.57 10 10Hz s−1.
This article reports on the regular monitoring of NGC 300 ULX-1 with the Neutron Star Interior Composition Explorer (NICER; Gendreau et al. 2016), and the discovery of three
apparent spin-down glitches that occurred over a span of about 120 days. In the many hundreds of radio, X-ray, and γ-ray pulsars monitored for glitches, all of the hundreds of detected glitches were spin-up glitches (Δν>0; see, e.g., Espinoza et al. 2011; Yu et al. 2013; Fuentes et al. 2017). Among
magnetars, observations reveal approximately twenty glitches, consisting of both spin-up and spin-down ones(see, e.g., Dib & Kaspi 2014). The largest magnetar spin-down glitch (with
Δν=−21 μHz) is inferred to possibly have occurred during a giantflare of SGR1900 + 14 (Woods et al. 1999), while the
second largest was over a hundred times smaller
18
(Δν∼−0.09 μHz) and accompanied by radiative changes (Archibald et al.2013). The glitches described above all occur
in nonaccreting pulsars, whose long-term spin frequencies decrease with time (n < 0˙ ) due to rotational energy loss from electromagnetic dipole radiation (Pacini 1968; Gunn & Ostriker 1969). For pulsars that accrete matter from a binary
companion, the torque due to accretion can cause the neutron star to spin up or spin down and is usually much stronger than the dipole radiation torque. There are only a few reported glitches in accreting pulsars; two spin-up glitches with Δν≈1 μHz, each occurring during an accretion outburst episode(Galloway et al.2004; Serim et al.2017), and possibly
two spin-down glitches(Klochkov et al. 2009).
2. Observations
In response to a series of Astronomer’s Telegrams reporting the discovery of pulsations and the period evolution of NGC 300 ULX-1(Bachetti et al.2018a,2018b; Carpano et al.2018a; Grebenev & Mereminskiy 2018a, 2018b; Kennea 2018; Vasilopoulos et al. 2018a), NICER observed NGC 300
ULX-1 on 20ULX-18 February 6 for ULX-1.6 ks. Following that, the source entered NICER’s solar exclusion zone and became unobser-vable until 2018 May 1, when NGC 300 ULX-1 was again sufficiently far from the Sun. NICER then started a monitoring campaign on the source, primarily designed to discover evidence of an orbital period. NICER generally has a visibility window of a few hundred to ∼2000 s in one segment of an orbit, and observations were generally made during 1–10 consecutive orbital segments per day (most often 2, 3, or 4). Here we present an analysis of NICER ObsIDs 1034200101 (2018 February 6) through 1034200198 (2018 October 20).
The X-ray timing instrument of NICER provides≈1900 cm2 of collecting area at 1.5 keV thanks to its 56 coaligned X-ray concentrating optics paired with single-pixel silicon drift detectors (SDDs) working in the 0.2–12 keV energy band (52 detectors are operational on orbit). The GPS time tagging of photons permits obtaining an accuracy better than 100 ns root mean square(rms; LaMarr et al.2016; Prigozhin et al.2016).
The data were processed following standard procedures using the NICER data analysis softwareNICERDAS version 4, together with HEASOFT version 6.24. The standard filtering criteria define the good time intervals for which the NICER pointing offset is<0°.015 from the nominal source position; the source is at least 30° from the Earth limb (at least 40 ° in the case of a Sun-illuminated Earth), and intervals when NICER was not within the boundaries of the South Atlantic Anomaly. In a few observations, we masked “hot” detectors exhibiting out-of-family count rates. Also, for ObsID 1034200101, we had to remove MPU319because of extreme count rates caused by solar loading on the detectors, and relaxed the filtering for the bright Earth to 30°. For each observation, we selected events in the 0.4–12 keV band and barycentered the data using the NASA/JPL DE405 solar system ephemeris and the coordinates of the ULX from Chandra imaging data (R.A.= 13°.770208, decl.=−37°.695417; Binder et al. 2011). All
barycentric times and frequencies in this work use the Barycentric Dynamical Time (TDB) timescale. Some of the observations exhibited background flares when the Interna-tional Space Station(ISS) was at extreme northern or southern
latitudes. We applied a count rate cut of 7.5 c s−1 on non-overlapping 8 s intervals to exclude the times of suchflares.
3. Timing
The timing analysis demonstrates the power of NICER for timing studies of faint X-ray pulsars. NICER’s flexible scheduling enabled monitoring of the source in a way that maximized the ability to do precise timing. We scheduled observations to cover two or more consecutive ISS orbits, spreading a relatively small amount of observing time over a duration long enough to make a precise frequency measure-ment, but not so long that the window function caused significant ambiguity in the pulse counting between data segments. These precise frequency measurements allowed us to bootstrap a fully coherent timing solution. In the following, we present the timing analysis of the pulsations, working from coarse frequency measurements to phase-coherent timing.
For the initial timing analysis, we binned the data at 1/128 s and used the PRESTO software package(Ransom et al.2002)
to perform a periodicity search over a range of possible accelerations. In essentially every observation until 2018 August 22, when the source seems to have faded significantly, the ULX pulsations (at around 53–57 mHz) were detected as the highest significance peak coming out of the search. This allowed us to confirm that the period evolution was continuing as previously reported. In addition, we confirmed the broad Gaussian pulse profile of this ULX reported previously (Carpano et al.2018b). Figure 1shows the pulse profile from
Figure 1.Phaseogram of NGC 300 ULX-1 in the 0.4–12 keV band, from the NICER observations around MJD 58246.
19
MPU: Measurement Power Unit; each MPU connects 8 of the focal plane modules, each containing one SDD.
MJD 58246, NICER’s densest day of observations. The profile is reasonably well modeled as a Gaussian with a full width at half maximum(FWHM) of 0.35 cycles.
To go from initial periodicity detections to precise period measurements, we employed a maximum likelihood technique to measure pulsed frequencies and significance. In this case, given a selection of photons from a segment of the observation, we searched over a grid of trial ν values. For each trial we computed the pulse phase of each photon according to a model with the trial ν (and n˙ fixed at the long-term average, 4.16×10⁻¹⁰Hz s−1). We modeled the probability distribution of this set of phases using a Gaussian template with a FWHM 0.35 of the pulse period and subsequently maximized the likelihood to determine the optimal values of the Gaussian peak position and amplitude. By profiling over these nuisance parameters, we arrived at a profile likelihood for ν; see Kerr et al. (2015) and Ray et al. (2011) for a discussion of similar
likelihood techniques. This finally yielded a maximum like-lihood estimate for the pulse frequency at that observation, as well as an estimate of the measurement uncertainty determined by the frequency range over which the log likelihood decreased by 0.5.
The rapid and noisy period evolution, combined with the window function of the observations, made precision timing difficult, so we developed a bootstrapping technique to make precise pulse frequency measurements. The first step was making likelihood frequency measurements for each nearly contiguous segment of NICER data(i.e., with no gaps greater than 1000 s and a total span less than 3000 s). These measurements are low-precision, but unambiguous. We note that the last significant pulsed detection was at MJD 58352.5 (2018 August 22; ObsID 1034200183). All subsequent observations show no strong evidence of pulsations from NGC 300 ULX-1; this includes an 800 s observation at MJD 58351.5, followed by a gap of a month, then 21 observations between MJD 58386 and 58411.20
The measured frequencies for each segment of NICER data are shown in Figure2. Fitting the pulse frequency evolution to a simple model with two frequency derivatives gives the bestfit n=n0+n t-t0 + n¨ t-t 1 2 0 2 ˙ ( ) ( ) , whereν0=53.350(5) mHz, n =˙ 4.16 5( )´10-10Hz s−1, n = -¨ 2.5 12( )´10-18Hz s−2, and
t0=MJD(TDB) 58243.515. Here, and elsewhere in the paper, the
numbers in parentheses are the 1σ uncertainty in the last digit. If the spin down proceeds as W µ W˙ n (where Ω is the angular velocity), the “braking index” n is defined as n =nn n¨ ˙ . For2
NGC 300 ULX-1, n is −0.8(4). The small magnitude of n indicates that we are likely seeing the secular spin up of the system and the n¨ is not strongly contaminated by timing noise or changing Doppler shift from an orbit. An analysis of the long-term spin up in terms of accretion torque theory is presented in Vasilopoulos et al. (2018b).The fitting procedure also yields a pulsed count rate for
each observation; these are shown in Figure3.
To make more precise frequency measurements, we repeated the likelihood analysis above, with expanded observation segments with a maximum span of 15,000 s (limiting the duration to three NICER orbits). In this stage, there are potential pulse counting ambiguities due to the long gaps between orbits in some observations. However, in nearly all cases, measurements that suffered from an off-by-one counting error between observation subsets were very clearly identified from the short-segment likelihood frequency estimates and the known position of the sidelobes from the observation window function.
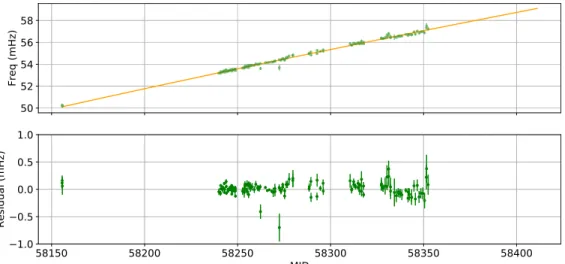
These precise frequency measurements, excluding the single observation in 2018 February, are shown in Figure4, where a constant frequency derivative has been subtracted to allow the fine structure to be seen. This reveals relatively smooth frequency evolution that shows some evidence for several negative frequency steps, which we identify as candidate glitches. However, the sampling and large uncertainties in some of the measurements, coupled with the rapid underlying spin evolution, makes this result tentative, requiring con firma-tion from the phase-coherent analysis presented in Secfirma-tion4.
We attempted tofit the frequency evolution with a secular evolution up through n¨ and three glitches. The residuals to this fit are shown in Figure5. There are clearly some unmodeled residuals, particularly in the high-precision measurements between glitches 1 and 2, and glitches 2 and 3. This could
Figure 2.Pulse frequency evolution of NGC 300 ULX-1 as measured with NICER from each short, nearly contiguous data segment. The line is thefitted model as described in the text, and the bottom panel shows the residuals to thefit. Note that glitches are not readily apparent here because of the poor precision of the individual period measurements.
20
While this paper was in review, monitoring continued and the source rebrightened allowing some additional pulsation detections after MJD 58450. These were not sufficient to establish a coherent timing solution or to search for additional glitches. For an analysis of those data and the implications of the spin evolution, see Vasilopoulos et al.(2019).
Figure 3.Pulsed count rate for each NICER observation where pulsations from NGC 300 ULX-1 were significantly detected. The count rates near MJD 58155 have been scaled by 7/6 to account for the exclusion of MPU3 in the analysis. Observations with at least 500 s of exposure where no significant pulsation was detected are marked with red×symbols.
Figure 4. NICERpulse frequency measurements for NGC 300 ULX-1, after subtraction of a simple model with a constant frequency derivative. The candidate glitch epochs are marked with red dashed lines.
Figure 5.Residuals to the best-fit three-glitch model for the NGC 300 ULX-1 frequency evolution. The upper (orange) points are the same data (offset by 2.0×10⁻⁴ Hz) with the glitch magnitudes set to 0, to show the location and amplitude of the glitches. For reference, the time ranges segments A–F used in the coherent analysis in Section4are also shown.
potentially be modeled as frequency derivative steps at the glitch, or exponentially decaying glitch “recoveries.” Both of these phenomena are observed in rotation-powered pulsar glitches, but it is not clear which applies here, so we keep the model as simple as possible. The model parameters are shown in Table1. We note that these model parameters yield a braking index n=−0.9(2).
3.1. Search for Profile Variations
In most radio pulsar glitches the pulse profile does not change at the epoch of the glitch, though significant profile changes are observed at the epoch of some magnetar glitches (e.g., see Archibald et al. 2013) and radiative changes were
seen after a glitch in one high magneticfield pulsar PSR J1119 −6127 (Weltevrede et al.2011). To help constrain the models
for the NGC 300 ULX-1 glitches, we looked for profile variations. To do this in a timing-model-independent way, we considered observations where the pulsations were strongly detected (6σ or more). For each segment, we fitted a single Gaussian template to determine phase 0 and generated a set of phases using that as a reference. We then collected all of these phases from six different sections of the NICER monitoring observation, splitting the data at the glitches, and at the first significant data gap after each glitch. We binned these phases into 40-bin histograms, subtracted the mean and divided by the standard deviation, to account for the changing background and evolving pulsed count rate. These six pulse profiles are displayed in Figure6. We alsofitted a three-Gaussian template model to the complete data set and displayed the residuals of each profile to that mean shape. We saw no significant pulse profile changes during our observations.
4. Coherent Timing Analysis
Using the observed frequency evolution, we computed pulse times of arrival(TOAs) for each 150 s segment of NICER data (300 s for segment F, as defined below, where the count rate was significantly lower), using the unbinned maximum likelihood technique described in Ray et al. (2011). The
reference phase for each TOA is the peak of the Gaussian pulse. Typical TOA uncertainties are 0.5 s, or about 3% of a pulse period.
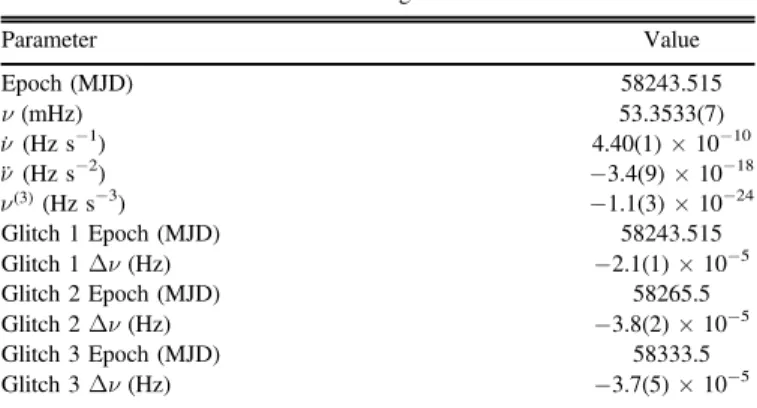
Table 1
Incoherent Timing Parameters
Parameter Value Epoch(MJD) 58243.515 ν (mHz) 53.3533(7) n˙(Hz s−1) 4.40(1)×10−10 n¨ (Hz s−2) −3.4(9)×10−18 n( )3 (Hz s−3) −1.1(3)×10−24 Glitch 1 Epoch(MJD) 58243.515 Glitch 1Δν (Hz) −2.1(1)×10−5 Glitch 2 Epoch(MJD) 58265.5 Glitch 2Δν (Hz) −3.8(2)×10−5 Glitch 3 Epoch(MJD) 58333.5 Glitch 3Δν (Hz) −3.7(5)×10−5
Figure 6.Pulse profiles (0.4–12 keV) from six different sections of data. Each profile has the mean subtracted and is normalized by the standard deviation. Two cycles are shown. The red points with error bars on the second cycle are the residuals of each profile to a model profile fitted to all of the data.
Because of the significant red noise, the rapid spin evolution, and the gaps between observations, generating a phase-connected timing model for the full data set is not possible. However, we were able to make phase-connected timing models for several contiguous sections of data(which we label as segments A–F), including spans that cover the first (segment A) and second (segment B) glitches. For later segments (C–F) of observations, wefitted simple models with ν and n˙. We use
TEMPO2(Hobbs et al.2006) to fit timing models to the TOAs
from each segment. The timing model parameters for each segment are presented in Tables 2–4, and the modeled spin-frequency evolution is displayed in Figure 7. The TOA residuals for each model are presented in Figures8–10.
We considered the possibility of a glitch between segments C and D, but rejected that hypothesis since the extrapolatedfits do not appear to require one. For segments E and F, we were able to get a good measurement of the frequency step at the glitch.
The coherent timing models shown in Figures 8–10clearly demonstrate that there are sudden pulse frequency changes. However, it is conceivable that such features could be just a manifestation of the red noise in the system.To test this, we simulated red noise residuals. Most accretion-powered pulsars show white torque noise(Bildsten et al. 1997), which gives a
pulse phase power spectrum with an index of −4, while some are even steeper. We made multiple realizations of residuals with red noise spectral indices of −3, −4, and −5, with normalizations set to match the rms of the observed residuals. The simulations with index −3 sometimes showed cusp-like features, but never with the large difference in scale between the red noise wiggles and the glitch residuals that we see in Figures 8and 10. For more realistic red noise spectral indices of −4 and −5, the red noise is much smoother and extremely unlikely to be mistaken for a glitch. We therefore conclude that the timing features we observe are best characterized as glitches.
5. Spectral Characteristics
Spectral analysis was performed withXSPEC version 12.10 (Arnaud 1996), and with the NICER response files version
0.06. For these analyses, the datafiltering is more stringent than that of the timing analyses presented above. This is in an effort to minimize the non-astrophysical background that affects the spectra. First, we limit the energy range to 0.4–10 keV because of significant optical loading affecting channels below 0.4 keV, especially when NICER is observing at low Sun angles. In addition to the standardfiltering described in Section2, we also exclude the detectors with DET_ID 14, 34, and 54, which often suffer from optical loading. Finally, we exclude periods with the conditions: COR_SAX<1.5, FPM_OVERONLY_COUNT>1.0, and FPM OVERONLY COUNT_ _ >(1.52´COR SAX_ -0.633).
This last condition is an empirical relation obtained from a large number of “blank sky” pointings to characterize NICER back-ground over a wide range of orbital environments. Together, these remove time intervals with high particle background.
Table 2
Parameters for Glitch 1(Segment A) Fit and Data Set
MJD range 58238.9–58249.9 Data span(d) 10 Number of TOAs 385 rms timing residual(s) 0.607 Reducedχ2value 1.6 Fixed Quantities R.A.,α (hh:mm:ss, J2000) 00:55:04.86 decl.,δ (dd:mm:ss, J2000) −37:41:43.7 Frequency second derivative, n¨(Hz s−2) 0 Epoch of frequency determination(MJD) 58243.5 Glitch epoch(MJD) 58243.509876 Measured Quantities Pulse frequency,ν (mHz) 53.35285(19) Frequencyfirst derivative, n˙ (Hz s−1) 4.358(13)×10−10 GlitchDn −2.340(20)×10−5 GlitchD˙n 1.41(13)×10−11 Derived Quantities Δν/ν −4.39(4)×10−4 n n D˙ ˙ 3.2(3)×10−2 Table 3
Parameters for Glitch 2(Segment B) Fit and Data Set
MJD range 58252.5–58278.7 Data span(d) 26 Number of TOAs 235 rms timing residual(μ s) 1.36 Reducedχ2value 7.0 Fixed Quantities R.A.,α (hh:mm:ss, J2000) 00:55:04.86 decl.,δ (dd:mm:ss, J2000) −37:41:43.7 Frequency second derivative, n¨(Hz s−2) 0 Epoch of frequency determination(MJD) 58265 Glitch epoch(MJD) 58265.25263
Measured Quantities
Pulse frequency,ν (mHz) 54.12969(9) First derivative of pulse frequency, n˙(s−2) 4.1603(17)×10−10 GlitchΔν −2.990(14)×10−5 GlitchD˙n 1.24(3)×10−11 Derived Quantities Δν/ν −5.52(2)×10−4 n n D˙ ˙ 2.98(6)×10−2
Figure 7. Piecewise coherent spin-frequency model for NGC 300 ULX-1. Each color represents a segment of data with a coherent timing model fit (denoted by the letters).
We generated a background spectrum specific to small time intervals using a library of spectra populated with NICER observations of seven blank sky regions, corresponding to the RXTE background regions (Jahoda et al. 2006). The
back-ground spectra we obtain are a combination of these blank sky spectra weighted according to space-weather observing condi-tions common to both the NGC 300 ULX-1 and background-field observations.
To each ObsID spectrum with its corresponding background, we fit a simple absorbed power law to study the spectral evolution over the several weeks of NICER observations of NGC 300 ULX-1. No obvious spectral changes can be determined at the epochs of the glitches. However, large variations of the background count rates estimated for each ObsID may hamper the precise study of the evolution.
Instead, we focus our study on the spectral evolution of the pulsed component only. For each ObsID, we extract spectra from the on-pulse phase range(0.75–1.25) and off-pulse phase range(0.25–0.75; see Figure6). The off-pulse spectra, used as
backgrounds for the on-pulse spectra, therefore permit subtraction of the non-astrophysical background and of the other X-ray sources within the NICER field of view. The typical flux of the pulsed component is fX∼2×
10−12erg s−1cm−2(0.4–10 keV).
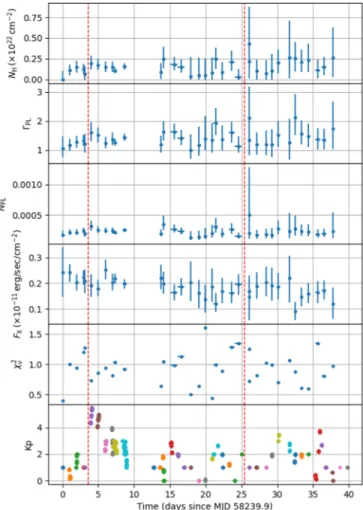
We fit each of these on-minus-off spectra with a simple absorbed power law. The best-fit parameters are shown in Figure11, together with the reduced c2values. No significant
spectral change is observed at the time of glitches 1 and 2. The observations around glitch 3 were shorter and provided low signal-to-noise spectra for a similar study. We therefore conclude that no detectable radiative changes were associated with the glitches.
6. Discussion
6.1. Characterization of the Glitches
We measured three glitches interrupting the rapid spin up of NGC 300 ULX-1, with magnitudes Δν=−23, −30, and −43 μHz. In the first two glitches, our best-fit coherent timing models include frequency derivative steps of D˙ =1.4 andn 1.2×10⁻¹¹Hz s−1, while in the third(more poorly sampled) glitch, we observe no significant nD˙ .
With approximately daily sampling, we do not catch any of the glitches as they happen. We can generally only constrain the epoch of the glitch to about±0.5 day accuracy, unless we impose the constraint that the pulse phase be continuous through the glitch, which gives a couple of more precise possible glitch epochs. There are significant unmodeled
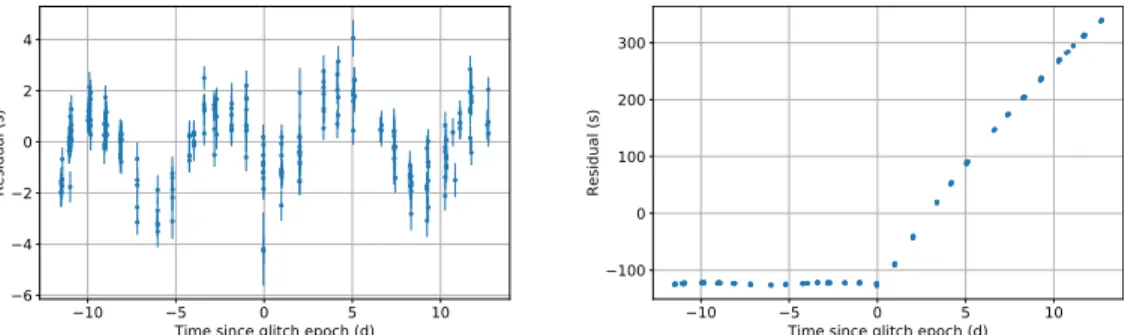
Figure 8.Coherent timing of glitch 2(segment B). Left: residuals to a timing model including the glitch. Substantial red noise is visible in the residuals. Right: residuals to the same model withΔν, nD˙ set to 0 to show the effect of the glitch.
Table 4
Coherent Timing Model Parameters for Segments C–F Fit and Data Set
Sequence C D E F MJD range 58292.6–58296.0 58310.4–58318.4 58327.2–58332.3 58334.2–58353.2 Data span(d) 3.4 8 5.1 19 Number of TOAs 28 89 39 76 rms resid.(s) 0.93 0.88 0.73 2.0 Reducedχ2 3.0 2.3 1.5 15.5 Fixed Quantities R.A.,α 00:55:04.86 decl.,δ −37:41:43.7 n¨ (s−3) 0 Epoch(MJD) 58298 58298 58333 58333 Measured Quantities ν (mHz) 55.3280(8) 55.3295(5) 56.5046(3) 56.46146(13) n˙(Hz s−1) 4.25(3)×10−10 3.877(3)×10−10 3.838(9)×10−10 3.8299(14)×10−10 Derived Quantities Δν (Hz) (D–C) 1.5(9)×10−6 (F–E) −4.32(3)×10−5 Δν/ν 2.7(16)×10−5 −7.66(6)×10−4
residuals(red noise) evident in the coherent fits to the glitches 2 and 3; however, they are much smaller than the inferred glitch-induced component. Wefit for a nD˙ at the glitch, but the nature of the red noise could include glitch recovery, accretion torque noise, and Doppler shifts from the orbit of the neutron star. We are unable to distinguish among these possibilities at this point. We note that the residuals look periodic in Figure 8. If fitted with an orbit, one gets a period of PB=7.3 day, with a
semimajor axis(a1sin i)/c=1.8 lt-s. This does not seem like a
plausible orbit for the neutron star as it implies a median companion mass of only 0.07 Me(for an inclination of 60°), when the companion mass is known to be 20 Meor larger. In addition, this oscillation does notfit the other data sets with the same period and phase, so we conclude that it is not due to an orbit.
6.2. Nature of the Glitches
The glitches measured in NGC 300 ULX-1 are unique among glitches observed to date. The lack of strong evidence
for any radiative change associated with the glitch in NGC 300 ULX-1 suggests a glitch mechanism internal to the neutron star, rather than a magnetospheric mechanism. Even in the case of magnetar glitches, where only some glitches are accom-panied by radiative changes, they are thought to be caused by a source within the neutron star(Dib & Kaspi2014). The internal
mechanism that produces glitches in nonaccreting pulsars is thought to be due to a superfluid in the pulsar’s inner crust and possibly core. The free neutrons that are present there are expected to be in a superfluid state because the typical crust temperature is well below the critical temperature for super-fluidity. Unlike normal matter, superfluid matter rotates by forming vortices whose areal density determines the spin rate of the superfluid. These vortices are normally pinned to the lattice of crust nuclei, and as a result, while the rest of the star slows down owing to electromagnetic dipole radiation, the superfluid does not. A lag develops between the stellar spin rate and that of the superfluid. When this lag reaches a critical value, superfluid vortices unpin and transfer angular
Figure 9.Residuals to the coherent timing models for segments C, D, E, and F.
Figure 10.Coherent timing of glitch 1(segment A). Left: residuals to a timing model including the glitch. Right: residuals to the same model with Δν, nD˙ set to 0 to show the effect of the glitch.
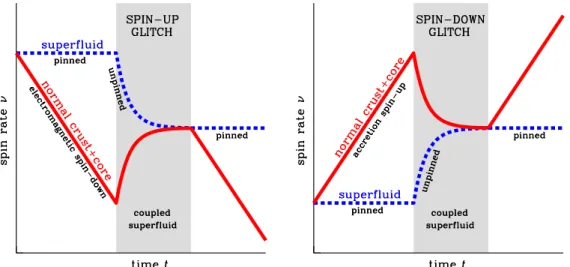
momentum to the rest of the star, causing the stellar spin rate to increase, i.e., a spin-up glitch(Anderson & Itoh1975; see, e.g., Haskell & Melatos 2015, for a review; see left panel of Figure12).
The above mechanism can still apply to the case of a spin-down glitch (see, e.g., Pines et al. 1980; see right panel of Figure12), such as that seen here for NGC 300 ULX-1. Here,
the pulsar spin frequency increases with time due to accretion (pre-glitch n = ´˙ 4 10-10Hz s-1), with a characteristic
spin-up timescale tcºn n2˙ =2 yr. Because of this short time-scale, we might expect a lag to build up quickly, where in our case most of the star spins faster than the superfluid. Once the lag is too great, the superfluid receives angular momentum from the rest of the star, and the star undergoes a spin-down glitch. This can be shown from the calculation of e.g., Andersson et al. (2012), by simply replacing the torque due
to dipole radiation with that due to accretion. Such an interpretation provides a constraint on the superfluid fraction in the neutron star (Link et al. 1999; Andersson et al. 2012; Chamel 2013) and even potentially a determination of the
neutron star mass (Ho et al. 2015, 2017). The former yields
»
Isf I (mneff mn) (-S Di n ni ) (2t tc obs)≈0.02(mneff mn)
t 116 d obs
( ), where the superfluid and total moments of inertia are Isfand I, respectively, the average effective neutron mass
2017) if the underlying glitch mechanism is the same.
The rise time of a glitch is uncertain, due to unknown properties of superfluidity, but is thought to be >8 P (Sidery et al.2010; Sourie et al.2017). Such a limit is in accord with
glitches seen in the Vela pulsar (Palfreyman et al. 2018) and
suggests a short rise time of>150 s for NGC 300 ULX-1, well within the ∼12 hr of our nearest post-glitch TOA (see Section3).
6.3. Glitch Recurrence Timescale
Wefind three glitches in 116 days of monitoring, giving a rate of one glitch per 39 days. Alternatively, the two measured interglitch times are 22 and 68 days. Ducci et al.(2015) consider a
model of the evolution of superfluid vortices that can produce a spin-down glitch. For this system, depending on the vortex pinning force, their model predicts a maximum amplitude of 2–20 μHz, glitch recovery timescale of 102–103s, and recurrence time of 40 days, although the observed spin-downD˙ ˙ seem to be muchn n smaller than that estimated from this model, with the discrepancy possibly due to model extrapolations and uncertainties.
6.4. No Evidence for an Orbit
The initial motivation for these timing observations was to determine the orbit of the neutron star. To search for a short-period orbit, we used a Lomb–Scargle periodogram of the frequency residuals(Figure5). No significant periodic Doppler
shifts are detected.
If we assume the pulsar is a neutron star in orbit with a 30 Mecompanion(suggested masses range from 20 to 40 Me; see Binder et al.2016; Lau et al.2016), for a typical inclination
of i=60°, the mass function will be about 17.8 Me. From this, we can compute the expected amplitude of the orbital Doppler shifts, given a choice of orbital period, PB. For a relatively short
orbital period of a few days, the predicted amplitude would be easily detected in our data. For example, for PB=7 days, the
amplitude of the sinusoidal Doppler modulation would be 0.05 mHz, which is much larger than the frequency residuals in Figure5. Therefore, unless the system is very nearly face-on, short orbital periods with massive companions can be excluded. As described above, the residuals to the coherent fits may suggest a short orbit around a very low mass companion(<0.1 Me), but we conclude that this is just a few cycles of a red noise process.
If, on the other hand, the orbital period is long (e.g., ∼400 days, as suggested by Lau et al.2016), the amplitude of
the frequency modulation would be about 0.01 mHz, but on a longer timescale, so it would be absorbed in the n˙ and n¨ fit to our frequency evolution. The expected n˙ for a 400-day orbit with the same component masses is two orders of magnitude smaller than the observed value, so it would not contribute significantly. But, the n¨ magnitude would be up to 5×10⁻¹⁹Hz s−2(depending on Figure 11.Pulsed component spectral evolution spanning segments A and B,
over glitches 1 and 2. Each spectrum wasfitted with an absorbed power law of indexΓPLand normalization NPL. Vertical error bars are 90% confidence level
uncertainties on the parameters, while the horizontal error bars represent the span of the ObsIDs. The dashed vertical lines show the epochs of glitches 1 and 2. The bottom panel shows the Kp space-weather index, an indicator of high backgrounds in NICER data.
the orbital phase and inclination), which is a factor of 7 below the observed n¨. Therefore, we conclude that a long orbital period could be contributing to the measured n¨ but the majority of the observed frequency evolution is from accretion torques.
6.5. Magnetic Field and Energetics
Using an X-ray luminosity of 5×1039erg s−1 (Carpano et al. 2018b) and standard accretion torque of Mr˙ m2WK( ),rm
where rmis the approximate magnetosphere radius andΩK(rm)
is the Keplerian orbital angular frequency at rm, we estimate
that the magnetic field of NGC 300 ULX-1 is ∼1×10¹²G, which is in agreement with that determined from a possible detection of an electron CRSF at E∼13 keV (Walton et al.
2018a), although the field can be much higher if the pulsar is
near spin equilibrium, where spin-up and spin-down torques are nearly equal. In the case of a proton CRSF, the inferred field would be 2×10¹⁵G/(1+z
g). We note that the presence
of this CRSF was called into question by Koliopanos et al. (2019), demonstrating that no spectral feature was required
when modeling the XMM and NuSTAR spectra with a multicolor thermal emission model plus a nonthermal tail.
7. Summary
In this article, wepresented evidence for two spin-down glitches (and a tentative third one) during the spin up of the ULX source NGC300ULX-1. Our NICER monitoring campaign allowed us, using phase-coherent timing analyses, to determine with high confidence that the magnitudes of these two glitches are the largest among known radio pulsar glitches. While the third glitch had an even larger magnitude (Δν=−43 μHz), its identification is somewhat less secure, as gaps in monitoring precluded precise determination of the glitch epoch and amplitude. We argue that these spin-down glitches are similar in nature to the spin-up glitches observed in spinning-down radio pulsars, i.e., the glitches are caused by sudden angular momentum transfer between a superfluid component and the rest of the neutron star. This is supported by the lack of detected radiative changes, which indicates a process internal to the neutron star. Finally, despite our dense
monitoring campaign, our timing solution did not permit determination of the orbit of the binary system, either because the system’s inclination is near 0 ° or because the Doppler amplitude of a long period orbit(hundreds of days) is hidden in the frequency evolution(n˙ and n¨) of the accretion torques in this system. Continued dense monitoring would permit study-ing the spin period evolution and accretion mechanisms of this intriguing source, as well as detecting more spin-down glitches to characterize the superfluid components inside the neu-tron star.
We thank the anonymous referee for useful comments and suggestions that improved this article. We thank Nishanth Anand (Thomas Jefferson High School for Science and Technology) for his work on the analysis for this paper during his SEAP summer internship at NRL. We thank Faith Huynh(MIT) for developing excellent NICER quicklook plotting software used in this work. We also thank Breanna Binder for helpful discussions. This work was supported by NASA through the NICER mission and the Astrophysics Explorers Program. NICER work at NRL is supported by NASA. S.G. is supported by the Centre National d’Etudes Spatiales (CNES). W.C.G.H. is partially supported by the Science and Technology Facilities Council (STFC) in the UK. This research has made use of data and software provided by the High Energy Astrophysics Science Archive Research Center (HEASARC), which is a service of the Astrophysics Science Division at NASA/GSFC and the High Energy Astrophysics Division of the Smithsonian Astrophysical Observatory. This research has also made use of the NASA Astrophysics Data System(ADS) and the arXiv.
Facility: NICER.
Software:astropy (Astropy Collaboration et al. 2013),
PINT (https://github.com/nanograv/pint), HEAsoft (https:// heasarc.nasa.gov/lheasoft/), TEMPO2 (Hobbs et al. 2006),
PRESTO(https://www.cv.nrao.edu/~sransom/presto/).
ORCID iDs
Paul S. Ray https://orcid.org/0000-0002-5297-5278
Sebastien Guillot https://orcid.org/0000-0002-6449-106X
Wynn C. G. Ho https://orcid.org/0000-0002-6089-6836
Figure 12.Left: schematic of spin-up glitch. Pulsar spin frequency(solid line) is observed to decrease due to energy loss from electromagnetic radiation, while a superfluid component within the star is pinned and does not spin down with the rest of the star (dashed line). When the superfluid component unpins and transfers angular momentum to the rest of the star, a spin-up glitch occurs. The pulsar then continues to spin down when the superfluid becomes pinned again. Right: schematic of spin-down glitch. Analogous to a spin-up glitch, except in this case the pulsar spin frequency(solid line) is observed to increase due to accretion torque and a spin-down glitch occurs when the superfluid gains angular momentum (dashed line).
Michael T. Wolff https://orcid.org/0000-0002-4013-5650
References
Anderson, P. W., & Itoh, N. 1975,Natur,256, 25
Andersson, N., Glampedakis, K., Ho, W. C. G., & Espinoza, C. M. 2012,
PhRvL,109, 241103
Antonopoulou, D., Espinoza, C. M., Kuiper, L., & Andersson, N. 2018,
MNRAS,473, 1644
Archibald, R. F., Kaspi, V. M., Ng, C. Y., et al. 2013,Natur,497, 591
Arnaud, K. A. 1996, in ASP Conf. Ser. 101, Astronomical Data Analysis Software and Systems V, ed. G. H. Jacoby & J. Barnes(San Francisco, CA: ASP),17
Astropy Collaboration, Robitaille, T. P., Tollerud, E. J., et al. 2013, A&A,
558, A33
Bachetti, M., Grefenstette, B. W., Walton, D. J., et al. 2018a, ATel,11282, 1
Bachetti, M., Grefenstette, B. W., Walton, D. J., et al. 2018b, ATel,11285, 1
Bachetti, M., Harrison, F. A., Walton, D. J., et al. 2014,Natur,514, 202
Bildsten, L., Chakrabarty, D., Chiu, J., et al. 1997,ApJS,113, 367
Binder, B., Williams, B. F., Kong, A. K. H., et al. 2011,ApJL,739, L51
Binder, B., Williams, B. F., Kong, A. K. H., et al. 2016,MNRAS,457, 1636
Brightman, M., Harrison, F. A., Fürst, F., et al. 2018,NatAs,2, 312
Carpano, S., Haberl, F., & Maitra, C. 2018a, ATel,11158
Carpano, S., Haberl, F., Maitra, C., & Vasilopoulos, G. 2018b, MNRAS,
476, L45
Chamel, N. 2012,PhRvC,85, 035801
Chamel, N. 2013,PhRvL,110, 011101
Dib, R., & Kaspi, V. M. 2014,ApJ,784, 37
Ducci, L., Pizzochero, P. M., Doroshenko, V., et al. 2015,A&A,578, A52
Espinoza, C. M., Lyne, A. G., Stappers, B. W., & Kramer, M. 2011,MNRAS,
414, 1679
Ferdman, R. D., Archibald, R. F., Gourgouliatos, K. N., & Kaspi, V. M. 2018,
ApJ,852, 123
Fuentes, J. R., Espinoza, C. M., Reisenegger, A., et al. 2017,A&A,608, A131
Fürst, F., Walton, D. J., Harrison, F. A., et al. 2016,ApJL,831, L14
Galloway, D. K., Morgan, E. H., & Levine, A. M. 2004,ApJ,613, 1164
Gendreau, K. C., Arzoumanian, Z., Adkins, P. W., et al. 2016,Proc. SPIE,
9905, 99051H
Grebenev, S. A., & Mereminskiy, I. A. 2018a, ATel,11174, 1
Kennea, J. A. 2018, ATel,11229, 1
Kerr, M., Ray, P. S., Johnston, S., Shannon, R. M., & Camilo, F. 2015,ApJ,
814, 128
King, A., & Lasota, J.-P. 2016,MNRAS,458, L10
Klochkov, D., Staubert, R., Postnov, K., Shakura, N., & Santangelo, A. 2009,
A&A,506, 1261
Koliopanos, F., Vasilopoulos, G., Buchner, J., Maitra, C., & Haberl, F. 2019,
A&A,621, A118
Koliopanos, F., Vasilopoulos, G., Godet, O., et al. 2017,A&A,608, A47
LaMarr, B., Prigozhin, G., Remillard, R., et al. 2016, Proc. SPIE, 9905, 99054W
Lau, R. M., Kasliwal, M. M., Bond, H. E., et al. 2016,ApJ,830, 142
Link, B., Epstein, R. I., & Lattimer, J. M. 1999,PhRvL,83, 3362
Monard, L. A. G. 2010, CBET,2289, 1
Mushtukov, A. A., Suleimanov, V. F., Tsygankov, S. S., & Ingram, A. 2017,
MNRAS,467, 1202
Pacini, F. 1968,Natur,219, 145
Palfreyman, J., Dickey, J. M., Hotan, A., Ellingsen, S., & van Straten, W. 2018,
Natur,556, 219
Pines, D., Shaham, J., Alpar, M. A., & Anderson, P. W. 1980,PThPS,
69, 376
Prigozhin, G., Gendreau, K., Doty, J. P., et al. 2016,Proc. SPIE,9905, 99051I
Ransom, S. M., Eikenberry, S. S., & Middleditch, J. 2002,AJ,124, 1788
Ray, P. S., Kerr, M., Parent, D., et al. 2011,ApJS,194, 17
Rizzi, L., Bresolin, F., Kudritzki, R.-P., Gieren, W., & Pietrzyński, G. 2006,
ApJ,638, 766
Serim, M. M., Şahiner, Ş., Çerri-Serim, D., Inam, S., & Baykal, A. 2017,
MNRAS,471, 4982
Sidery, T., Passamonti, A., & Andersson, N. 2010,MNRAS,405, 1061
Sourie, A., Chamel, N., Novak, J., & Oertel, M. 2017,MNRAS,464, 4641
Vasilopoulos, G., Haberl, F., Carpano, S., & Maitra, C. 2018a, ATel,11179, 1
Vasilopoulos, G., Haberl, F., Carpano, S., & Maitra, C. 2018b,A&A,620, L12
Vasilopoulos, G., Petropoulou, M., Koliopanos, F., et al. 2019, arXiv:1905. 03740
Walton, D. J., Bachetti, M., Fürst, F., et al. 2018a,ApJL,857, L3
Walton, D. J., Fürst, F., Heida, M., et al. 2018b,ApJ,856, 128
Weltevrede, P., Johnston, S., & Espinoza, C. M. 2011,MNRAS,411, 1917
Woods, P. M., Kouveliotou, C., van Paradijs, J., et al. 1999, ApJL,
524, L55