HAL Id: hal-00297791
https://hal.archives-ouvertes.fr/hal-00297791
Submitted on 7 Mar 2006HAL is a multi-disciplinary open access
archive for the deposit and dissemination of sci-entific research documents, whether they are pub-lished or not. The documents may come from teaching and research institutions in France or abroad, or from public or private research centers.
L’archive ouverte pluridisciplinaire HAL, est destinée au dépôt et à la diffusion de documents scientifiques de niveau recherche, publiés ou non, émanant des établissements d’enseignement et de recherche français ou étrangers, des laboratoires publics ou privés.
Microbial colonization and alteration of basaltic glass
J. Einen, C. Kruber, L. Øvreås, I. H. Thorseth, T. Torsvik
To cite this version:
J. Einen, C. Kruber, L. Øvreås, I. H. Thorseth, T. Torsvik. Microbial colonization and alteration of basaltic glass. Biogeosciences Discussions, European Geosciences Union, 2006, 3 (2), pp.273-307. �hal-00297791�
BGD
3, 273–307, 2006 Microorganisms in seafloor basalts J. Einen et al. Title Page Abstract Introduction Conclusions References Tables Figures J I J I Back CloseFull Screen / Esc
Printer-friendly Version Interactive Discussion
EGU
Biogeosciences Discuss., 3, 273–307, 2006 www.biogeosciences-discuss.net/3/273/2006/ © Author(s) 2006. This work is licensed under a Creative Commons License.
Biogeosciences Discussions
Biogeosciences Discussions is the access reviewed discussion forum of Biogeosciences
Microbial colonization and alteration of
basaltic glass
J. Einen1, C. Kruber2, L. Øvre ˚as1, I. H. Thorseth2, and T. Torsvik1
1
Department of Biology, University of Bergen, Jahnebakken 5, N-5020 Bergen, Norway
2
Department of Earth Science, University of Bergen, Allegt. 41, N-5007 Bergen, Norway Received: 20 December 2005 – Accepted: 5 January 2006 – Published: 7 March 2006 Correspondence to: J. Einen ([email protected])
BGD
3, 273–307, 2006 Microorganisms in seafloor basalts J. Einen et al. Title Page Abstract Introduction Conclusions References Tables Figures J I J I Back CloseFull Screen / Esc
Printer-friendly Version Interactive Discussion
EGU
Abstract
Microorganisms have been reported to be associated with the alteration of the glassy margin of seafloor pillow basalts (Thorseth et al., 2001, 2003; Lysnes et al., 2004). The amount of iron and other biological important elements present in basalts and the vast abundance of basaltic glass in the earth’s crust, make glass alteration an important 5
process in global element cycling. To gain further insight into microbial communities associated with glass alteration, five microcosm experiments mimicking seafloor con-ditions were inoculated with seafloor basalt and incubated for one year. Mineral pre-cipitations, microbial attachment to the glass and glass alteration were visualized by scanning electron microscopy (SEM), and the bacterial community composition was 10
fingerprinted by PCR and denaturing gradient gel electrophoresis (DGGE) in combina-tion with sequencing. SEM analysis revealed a microbial community with low morpho-logical diversity of mainly biofilm associated and prosthecate microorganisms. Approx-imately 30 nm thick alteration rims developed on the glass in all microcosms after one year of incubation; this however was also seen in non inoculated controls. Calcium car-15
bonate precipitates showed parallel, columnar and filamentous crystallization habits in the microcosms as well as in the sterile controls. DGGE analysis showed an alteration in bacterial community profiles in the five different microcosms, as a response to the different energy and redox regimes and time. In all microcosms a reduction in number of DGGE bands, in combination with an increase in cell abundance were recorded dur-20
ing the experiment. Sequence analysis showed that the microcosms were dominated by four groups of organisms with phylogenetic affiliation to four taxa: The Rhodospir-illaceae, a family containing phototrophic marine organisms, in which some members are capable of heterotrophic growth in darkness and N2fixation; the family Hyphomi-crobiaceae, a group of prosthecate oligotrophic organisms; the genus Rhizobium, N2 25
fixating heterotrophs; and the genus Sphingomonas, which are known as bio-film pro-ducing oligotrophs. Although no bioalteration of glass could be confirmed from our ex-periments, oligotrophic surface adhering bacteria such as the Sphingomonas sp. and
BGD
3, 273–307, 2006 Microorganisms in seafloor basalts J. Einen et al. Title Page Abstract Introduction Conclusions References Tables Figures J I J I Back CloseFull Screen / Esc
Printer-friendly Version Interactive Discussion
EGU
Hyphomicrobium sp. may nevertheless be important for bioalteration in nature, due to their firm attachment to glass surfaces, and their potential for biofilm production.
1 Introduction
When the basaltic magma is extruded into cold seawater at the mid-ocean spreading ridges, the surface layer is cooled so rapidly that its constituent ions do not have enough 5
time to crystallize, but arrests into an amorphous glass rim. As the glass rim is more brittle than the crystalline interior, the density of fractures and cracks are highest in the glassy margins, giving a large surface to mass ratio for water-rock interactions and microbial attachment and growth. The lack of systematic atomic arrangements and the high numbers of cracks in the glass results in a higher dissolution rate for glass then for 10
crystalline basalt, regardless of identical element composition. Subsequent eruptions bury the lava flows, and the pillow lava layer can have substantial depth of the ridge axis. The basalt continues to alter after burial, due to seawater percolations through the pillow lava layer. Oxidized compounds which can be used as electron acceptors and carbon sources are supplied to microorganisms deep within the basaltic layer with 15
the seawater (D’Hondt et al., 2004), and dissolution of glass provides electron donors such as reduced iron and manganese.
Microorganisms have been proved by DNA specific staining and chemical analysis to be associated with the altered glass in seafloor pillow lavas (Thorseth et al., 1995). Fur-thermore, cells and etch marks formed by microorganisms have been directly observed 20
to be associated with altered glass surfaces in seafloor basalt using SEM (Thorseth et al., 1991, 2003). Culture independent molecular phylogenetic techniques have also proved that basaltic glass is colonized by a diverse and unique microflora (Thorseth et al., 2001; Lysnes et al., 2004). One can expect two types of microbial dissolution of glass, passive glass alteration induced by changes in the surrounding environment 25
caused by organisms affecting pH, Eh, or concentration of dissolved ions. Organisms can also actively dissolve glass in order to use the elements either in an assimilatoric
BGD
3, 273–307, 2006 Microorganisms in seafloor basalts J. Einen et al. Title Page Abstract Introduction Conclusions References Tables Figures J I J I Back CloseFull Screen / Esc
Printer-friendly Version Interactive Discussion
EGU
way to obtain trace elements or in a dissimilatoric way to obtain energy. In basaltic glass reduced forms of Fe and Mn, are potential electron donors. Gallionella ferruginea and Leptothrix discophora, are considered classical organisms capable of lithoautotrophic Fe oxidation at neutral pH. Recently it has been shown that groups of microorganisms distantly related with the heterotrophic organisms Marinobacter sp. and Hyphomonas 5
sp. are also capable of lithoautotrophic growth at circum neutral pH on a range of re-duced Fe components (Edwards et al., 2003).
Basaltic glass compromises a significant component of the oceanic crust, is easily altered and important in the global cycling of elements (Staudigel and Hart, 1983). As microorganisms play a major role in element cycling in other habitats, it’s important to 10
increase our knowledge in how microorganisms colonize and alter pillow lava basalt. Bacterial alteration of basaltic glass has even been reported after such short incubation time as one year in laboratory experiments, at room temperature and with high nutrition levels (Staudigel et al., 1995, 1998; Thorseth et al., 1995). The intension of this study was to observe and measure microbial colonization and bioalteration of basaltic glass 15
under controlled conditions, near to the natural environment of seafloor basalts. Five microcosm experiments mimicking seafloor conditions were set up with different nutri-ent and redox regimes. Synthetic glass was added artificial seawater and inoculated with seafloor basalt. The microbial colonisation processes were visualized using SEM and followed genetically using PCR-DGGE.
20
2 Materials and methods
2.1 Inoculum
Glassy basalt was collected by dredging the seafloor at 16 different locations in the neovulcanic zone of the Mohns ridge during the SUBMAR 2001 cruise with R/V H ˚akon Mosby in the Norwegian/Greenland Sea. The samples displayed from none to highly 25
BGD
3, 273–307, 2006 Microorganisms in seafloor basalts J. Einen et al. Title Page Abstract Introduction Conclusions References Tables Figures J I J I Back CloseFull Screen / Esc
Printer-friendly Version Interactive Discussion
EGU
chipped of with hammer and chisel and crushed in a pestle. Two sets of inoculums were initiated; one that was prepared and held under aerobic conditions and one that was prepared and held anaerobicly. The crushed glass was transferred to 100 mL serum bottles completely filled with either aged oxic or anoxic sterile seawater. All equipment used was sterilized. Samples for anoxic inoculum was prepared inside a disposable 5
glove box (Model S30-20, Instrument for Research and Industry Inc.) filled with N2. The samples were stored at 10◦C in the dark for one year prior its use as inoculum. 2.2 Synthetic glass
Synthetic glass was made by melting powdered unaltered seafloor basalt from the Mohns ridge in a platinum crucible, 10 mm diameter and 60 mm high in size at 1250◦C 10
for 3 h, before it was quenched in distilled water. The oxygen fugacity was controlled in a H2-CO2mixture and held at nickel-nickel oxide buffer oxygen fugacity (Deines et al., 1974). The synthetic glass was subsequent crushed to grains of <3 mm, and sterilised in a microwave oven three times one minute before it was added to the microcosm experiments.
15
2.3 Experimental design
Five microcosm experiments with different nutrient- and redox regime were set up ac-cording to Table 1. Polypropylene bottles (50 mL) were filled with 50 mL carbonate buffered (pH 7.6) artificial seawater (Ultramarine synthetic sea salt, Waterlife research LTD.) (Table 2) leaving a headspace volume of 10 mL, and added 0.8 g of crushed syn-20
thetic glass. The five different microcosms (1B to 5B) were all set up in four replicas, in addition to four parallel sterile controls. Microcosms 1B and 2B were inoculated with 2 mL of the aerobic inoculum, and incubated in an atmosphere of air. Microcosm 1B was amended with CH4, while 2B was amended with sodium acetate to a final concentration of 20 mM. Microcosms 3B, 4B and 5B were inoculated with 2 mL of the 25
BGD
3, 273–307, 2006 Microorganisms in seafloor basalts J. Einen et al. Title Page Abstract Introduction Conclusions References Tables Figures J I J I Back CloseFull Screen / Esc
Printer-friendly Version Interactive Discussion
EGU
with H2, while 4B was incubated in an atmosphere of N2 and not amended with any extra carbon or energy source. Microcosm 5B was amended with sodium acetate to a final concentration of 20 mM and inoculated in an atmosphere of N2.
The microcosms were placed inside glass containers with the appropriate atmo-sphere, and incubated in the dark at 10◦C for 1 year. Every third month one of each 5
microcosm replica and its respective control was terminated and analyzed. After each sampling the atmosphere in the glass containers was restored by flushing with the re-spective gases. The bottles in microcosms 1B and 3B was not closed tightly but were open to the atmosphere in the container, giving the microcosms a new supply of CH4 and H2every third month, while those in 2B, 4B and 5B were closed to ensure a stable 10
environment inside the bottles, giving 2B and 5B a one time finite energy amendment. 2.4 Chemical analysis
Gas chromatography (GC) was used to analyze the concentration of CH4in all micro-cosms and of acetate in micromicro-cosms 2B and 5B. CH4was measured with an HP 6890 GC fitted with a packed metal column (Hayasep R, 80/100 Mesh), and a thermal con-15
ductivity detector. Acetic acid concentration was measured with a HP 5890 GC fitted with a fused silica column (carbowax 30 m×0.53 mm, 1.33 µm film thickness) and a flame ionization detector. Helium was used as carrier gas in both analyses.
2.5 Microbial growth and glass alteration
To examine growth in the liquid phase of the microcosms, 1–5 mL suspension was fil-20
tered on to black 0.2 µm polycarbonate filters (Poretics products) which were stained with DAPI (1 µg/mL), and enumerated in a fluorescence microscope. In order to track relative changes in cell concentration, and cell morphology on glass surfaces, glass grains were dehydrated in graded series of ethanol (50%, 75%, and 3×96%, 20 min each), then critical point dried and coated with Au-Pd, before examinations with a 25
fea-BGD
3, 273–307, 2006 Microorganisms in seafloor basalts J. Einen et al. Title Page Abstract Introduction Conclusions References Tables Figures J I J I Back CloseFull Screen / Esc
Printer-friendly Version Interactive Discussion
EGU
tures emerging during the experimental time by SEM, attached cells were removed by submerging the glass for 30 min in distilled water followed by 1 h in 2% Sodium dode-cyl sulphate (SDS). The glass was then rinsed 10 times with distilled water and finally dried with acetone before coated with Au-Pd. By this procedure, an estimated 95% of the attached microbes were removed from the glass surfaces. The washing caused 5
no detectable alteration of the glass surfaces. To examine alteration rims developed in the basaltic glass during the experiment by transmission electron microscopy (TEM) (Philips CM 200), glass grains were sequential dehydrated for 20 min each in 50%, 75%, and 3×96% ethanol, embedded in hard grade acryl resin (LR White®) and sliced into ultra-thin sections (∼1000 ˚A) with an ultra microtome. Sections were mounted on 10
a 200 mesh carbon coated Cu-grids supported with Formvar film. 2.6 Molecular analysis
DNA was extracted from 0.5 g glass, from each of the microcosms terminated every third month, by a combination of freeze-thawing to lyse the cells (Ueda et al., 1995) and the use of the BIO101 Soil DNA extraction kit (Q-Biogen, Ca, USA) (Borneman et al., 15
1996), with small modifications described below. The glass was placed in the FastDNA tube and added 1 mL 0.1 M Na-Phosphate buffer (pH 9) with 5% SDS. The relative high pH was used to help facilitate the release of DNA from the glass. The sample was then subjected to three freeze-thaw cycles in water at 65◦C and a saturated ethanol/dry-ice mixture at approximately −60◦C. Further steps in DNA extraction was performed as 20
described in the protocol supplied with the kit.
16S rDNA fragments were amplified from the isolated DNA using the Bacteria spe-cific primers pA8f (Edwards et al., 1989) and PRUN 518r (Muyzer et al., 1993). A GC clamp, (Muyzer et al., 1993) was attached to the 50end of pA8f primer. PCR reaction mixture consisted of 0.2 µM of each primer, 100 µM of each dATP, dTTP, dCTP, dGTP, 25
1.5 mM MgCl2, 0.02% BSA and 1.25 U of HotStarTaq DNA Polymerase (Qiagen). The amplification was performed in an automated thermal cycler (2400 Perkin-Elmer-Cetus)
BGD
3, 273–307, 2006 Microorganisms in seafloor basalts J. Einen et al. Title Page Abstract Introduction Conclusions References Tables Figures J I J I Back CloseFull Screen / Esc
Printer-friendly Version Interactive Discussion
EGU
with an initial denaturation and enzyme activation at 93◦C for 15 min; 37 cycles of de-naturation (30 s at 94◦C), annealing (30 s at 55◦C) and extension (30 s at 72◦C) and a final extension at 72◦C for 10 min.
The amplified PCR products were separated by DGGE (Muyzer et al., 1993). The gel consisted of 8% acrylamide, 0.5% TAE and was made with a gradient of 30 to 5
55% denaturant (7M urea and 40% formamide is referred to as 100% denaturant). Electrophoresis was carried out first for 10 min at 20 V and then 17 h at 80 V. After electrophoresis the gel was stained with SYBRGold (Molecular Probes) for one hour, rinsed in distilled water and photographed on a UV transiluminatior.
The DNA was extracted from the individual bands as previous described by Øvre ˚as 10
et al. (1997). The eluted DNA was reamplified as described above, but for this am-plification a 35 cycle program was used. The reamplified PCR products were diluted 1:10 in PCR quality water, and sequenced. A cyclic sequencing reaction (Sanger et al., 1977) using the BigDye® Terminator v3.1 Cycle Sequencing Kit (Applied Biosystems) was performed. The samples were sequenced at the sequencing facility at the Univer-15
sity of Bergen. The retrieved sequences were aligned using Clustal X (Thompson et al., 1997) and a bootstrapped, phylogenetic tree was constructed using the Neighbour Joining algorithm in Clustal X.
The phylogenetic affiliation of the different sequences obtained from the DGGE gel, was determined by searching the Genbank database with NCBI Blastn program 20
(Altschul et al., 1990). The DGGE patterns were recorded and analysed using the soft-ware Gel 2K developed by Svein Norland (Dept. of Biology, University of Bergen). For cluster analysis a binary data matrix were created based on the presence and absence of bands in the community profile. Distance was calculated using the Jaccard algorithm while the dendrogram was created using the complete link method.
BGD
3, 273–307, 2006 Microorganisms in seafloor basalts J. Einen et al. Title Page Abstract Introduction Conclusions References Tables Figures J I J I Back CloseFull Screen / Esc
Printer-friendly Version Interactive Discussion
EGU
3 Results
3.1 Growth and chemical analysis of microcosms
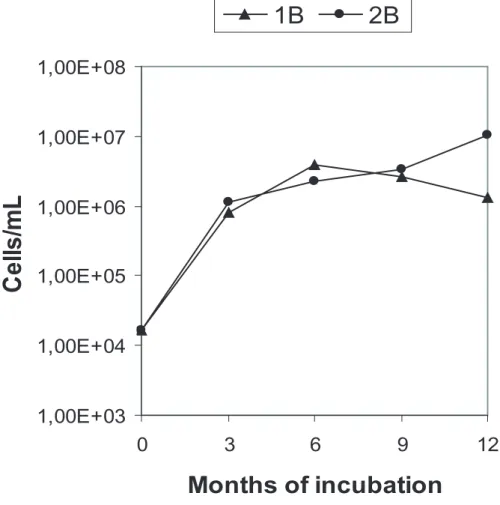
The cell concentration in the liquid phase of all microcosms increased during the exper-iment (Figs. 1 and 2). The two aerobic microcosms displayed different growth profiles; after 12 months the cell numbers had increased from 1×10³ to 1×10⁶cells/mL in 1B 5
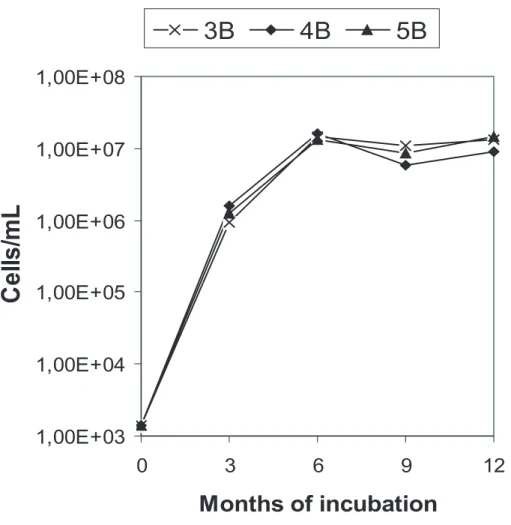
and to 1×10⁷cells/mL in 2B. The three anoxic microcosms showed nearly identical growth profiles. The three microcosms had a cell concentration of 1×10⁴cells/mL at the experimental start, and after 6 months cell numbers in all microcosms stabilized at 1×10⁷cells/mL. No cells were observed either in the liquid phase or on the glass grains in any of the un-inoculated oxic or anoxic controls. Cell density on glass surfaces after 10
12 months of incubation was estimated by SEM to be highest in 2B and lowest in 3B, while microcosms 1B, 4B and 5B were estimated to have a similar, intermediate cell density on glass surfaces.
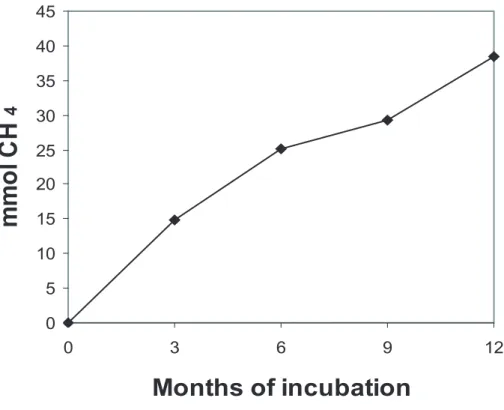
CH4production was not detected in any of the microcosms. In microcosm 1B, CH4 depletion was detected, and the depletion was highest during the first 3 months (Fig. 3). 15
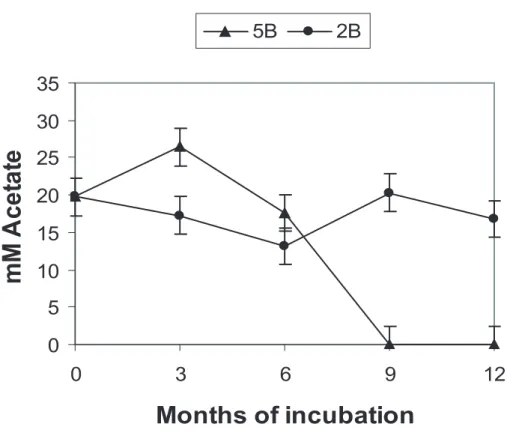
Acetate consumption was not observed in 2B (Fig. 4). In microcosm 5B however, the acetate was exhausted after 9 months. The sterile controls showed no significant reduction of acetate.
3.2 Glass alteration and mineral formation
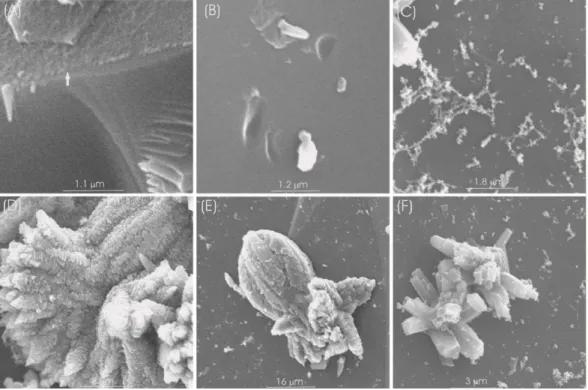
After 12 months of incubation a ∼30 nm deep alteration rim was observed on the sur-20
face of the glass grains (Fig. 5A). However no difference in rim thickness between glass subjected to microbial growth and glass in sterile controls was detected. Irregu-lar cavities (1–4 µm length, 0.5 µm wide) with sharp edges in the glass surfaces, were observed both in the starting material and in inoculated and un-inoculated microcosms. This was a result of mechanical crushing (Fig. 5B). Precipitation of filamentous CaCO3 25
BGD
3, 273–307, 2006 Microorganisms in seafloor basalts J. Einen et al. Title Page Abstract Introduction Conclusions References Tables Figures J I J I Back CloseFull Screen / Esc
Printer-friendly Version Interactive Discussion
EGU
these filamentous precipitates were up to several micrometers long and ∼0.1 µm wide (Fig. 5C), with no cells attached to them. Parallel (Fig. 5D and E) and columnar growth of CaCO3 (Fig. 5F) occurred likewise in all inoculated and un-inoculated microcosms during the whole experimental run.
3.3 DNA and SEM analyses of microorganisms attached to glass surfaces 5
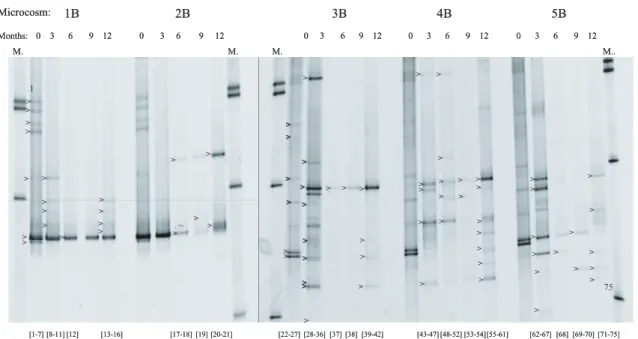
DGGE profiles reflected a fingerprint of the microbial communities for the four micro-cosms (Fig. 6). In the two oxic micromicro-cosms 1B and 2B, nine bands were detected by Gel 2K at time zero. During the experiment the number of bands decreased and af-ter one year of incubation only five and three bands were detected in microcosms 1B and 2B respectively. Nine bands were also detected in 3B, 4B and 5B at time zero, 10
however in these microcosms the numbers of bands stayed high during the whole ex-periment. After one year of incubation, nine bands were detected in 3B and 5B, while in the unamended microcosms the numbers of bands had raised to 12.
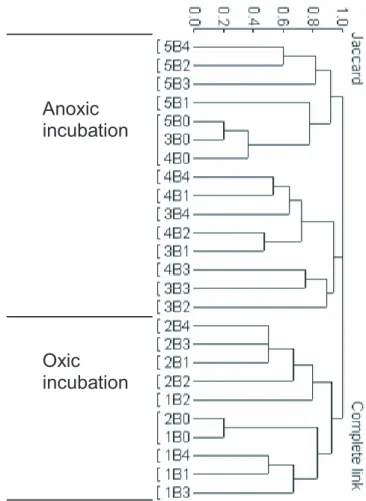
Cluster analysis based on the presence/absence of band in the DGGE gel, showed that the aerobic microcosms 1B and 2B formed one distinct cluster separated from the 15
three anoxic microcosms 3B, 4B and 5B (Fig. 7). The anoxic microcosms was further separated in two clusters, one that contained 3B and 4B (added H2 and unamended, respectively), and one that was composed of the anaerobic samples at the start of the experiment and all samples from microcosm 5B (added acetate).
A total of 64 bands were cut out from the gel and successfully sequenced, they were 20
deposited in GenBank with accession number DQ315606-DQ315669. Several of the sequences showed low similarities with known organisms in GenBank. From the aer-obic inoculums all of the retrieved sequences were affiliated to alpha Proteobacteria. In the CH4 amended, oxic microcosm (1B), the most dominant band, which also was present in the inoculum, continued to dominate in the community profile throughout 25
the experiment. The sequence analysis of this band, (band 6 and 12 in Fig. 6) showed 97% similarity to Rhodospirillaceae bacterium PH30, an organism assigned to the fam-ily Rhodospirillaceae. This famfam-ily is known to contain phototrophic marine organisms,
BGD
3, 273–307, 2006 Microorganisms in seafloor basalts J. Einen et al. Title Page Abstract Introduction Conclusions References Tables Figures J I J I Back CloseFull Screen / Esc
Printer-friendly Version Interactive Discussion
EGU
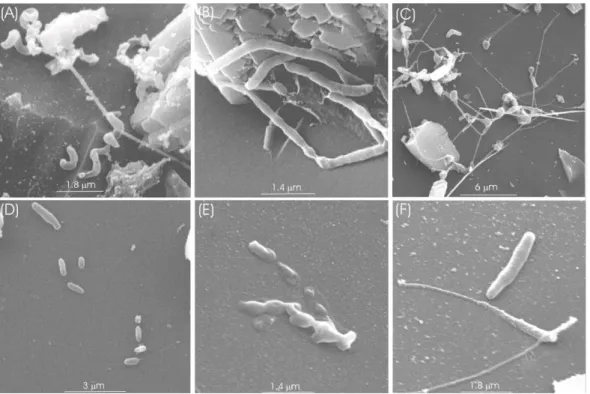
with members capable of N2 fixation and heterotrophic growth. Band 8, a major band after three months of incubation, showed phylogenetic affiliation (but only 93% similar-ity) to a gamma proteobacterium, Colwellia demingiae, a psychrophilic heterotrophic bacterium. This was the only band that did not affiliate to the alpha subgroup of the Proteobacteria from the 1B microcosm. SEM revealed that spirilla (Table 3, Fig. 8A) 5
was a major morphotype after three months of incubation, but were not to be found in later samples. Rod shaped bacteria with lengths up to 4.5 µm were the dominating morphotype after 12 months of incubation (Fig. 8B).
In the acetate amended, oxic microcosm 2B, band 18, which had the same vertical position as band 6 and 12 mention above, was dominating after three and six months 10
of incubation. Sequence analysis revealed that this band showed 98% similarity to the same Rhodospirillaceae bacterium PH30, in microcosm 2B however no spirilla were observed by SEM. The Rhodospirillaceae band was absent in the 12 month sample. Band 20 was not present either in the inoculum or after three months of incubation but became increasingly dominant from six months and beyond. DNA sequence analysis 15
revealed a sequence 100% similar to Hyphomonas oceanitis, a marine oligotrophic organism. Band 21, the other dominant band in the DGGE profile of 2B after twelve months, was shown to have a DNA sequence with 99% similarity to Phyllobacterium myrsinacearum, an aerobic heterotrophic organism usually found in association with plants. SEM microscopy showed a dominance of prosthecate morphotypes (Fig. 8C). 20
The DGGE profile for the anaerobic inoculum showed a different banding pattern compared to the aerobic inoculum (Fig. 6). The DNA sequences from the anaerobic inoculum were found to belong to four taxa, the alpha and the delta subdivision of the Proteobacteria, the Firmicutes, and a sequence derived from a plastid. In the H2 amended, anoxic microcosm 3B, bands 30, 37, 38 and 39 all had the same relative po-25
sition in the DGGE gel, and had similar DNA sequence. This band was not observed in the inoculum, but appeared after tree months and became increasingly dominant during the experiment. The bands revealed DNA sequences with 96 to 99% similarity to Sphingomonas sp. a genus of strictly aerobic heterotrophic bacteria known to
pro-BGD
3, 273–307, 2006 Microorganisms in seafloor basalts J. Einen et al. Title Page Abstract Introduction Conclusions References Tables Figures J I J I Back CloseFull Screen / Esc
Printer-friendly Version Interactive Discussion
EGU
duce extracellular material in biofilms. The most diverse DGGE profile was observed after 3 months, were 7 of 9 sequences affiliated to the order Rhizobiales in the alpha subdivision of the Proteobacteria, whereas 1 sequence affiliated to the epsilon, with a low (89%) similarity to the chemolithotrophic organism Sulfuricurvum kujiense, and finally 1 sequence affiliated to the gamma subgroup, with 97% similarity to Halomonas 5
variabilis. Using SEM, prosthecate organisms were observed to dominate the glass surfaces after three months of incubation, after nine months of incubation cocci and rods were also seen (Fig. 8D). After one year of incubation only rodshaped organisms were observed (Table 3).
The highest variability in DGGE band profiles was seen in the unamended, anoxic 10
microcosm 4B. In this microcosm a distinct shift from the inoculum profile could be observed after 3 months, with DNA sequences with similarities to the orders Rhizo-biales, Sphingomonadales and Alteromonadales. The bands numbered 44, 50, 53 and 55 were present in the microcosms from 3 to 12 months with the same relative po-sition, sequence analysis showed the same Sphingomonas DNA signature, as found 15
in microcosm 3B. The bands became increasingly dominant at the end of the exper-iment (12 months). After 12 months of incubation the families Sphingomonadaceae, Hyphomicrobiaceae and Rhodobacteraceae, were found, all alpha Proteobacteria. Af-ter three months of incubation, no cells were observed by SEM. AfAf-ter three months of incubation, rods and prosthecate organisms were observed, and after 12 months of 20
incubation these two morphotypes were found in association with extensive biofilms. In the acetate amended anoxic microcosm 5B, no clear succession towards a single dominating band could be seen. A dramatic shift in community composition could be tracked from the inoculum to the 3 months sample, in which only alpha and gamma Proteobacteria were detected. Band 68 was only seen after six months of incubation, 25
the sequence of the band showed phylogenetic affiliation (but only 92% similarity) to a member of the genus methylobacter. Three out of five bands in 5B after one year of incubation revealed DNA sequences affiliated to the family Hyphomicrobiaceae, a family with aerobic chemoorganotrophs often found in extremely oligotrophic
environ-BGD
3, 273–307, 2006 Microorganisms in seafloor basalts J. Einen et al. Title Page Abstract Introduction Conclusions References Tables Figures J I J I Back CloseFull Screen / Esc
Printer-friendly Version Interactive Discussion
EGU
ments, which form daughter cells by budding. No Hyphomicrobium sequences were obtained from the inoculum. Rods within biofilms and prostecathing rods were found to dominate the glass surface using SEM.
Sequences retrieved from the DGGE gels were aligned and used to generate a phy-logenetic tree (Fig. 9). The sequences from the aerobic inoculums, marked with an 5
asterisk, are all found on the same branch within the α Proteobacteria, the Rhodospi-rales group. Most of the sequences obtained from 1B during the whole experimental time, were also affiliated to this group, indicating little variation in the bacterial commu-nity composition during the experiment. However, one sequence from 1B was found to be affiliated to the Sphingomonadaceae family, and one sequence affiliated to the fam-10
ily Alteromonadacea. Of the five sequences retrieved from microcosm 2B, one showed phylogenetic affiliation to the Rhodospirillaceae family, one to the family Phyllobacteri-aceae, and three to the genus Hyphomonas.
Sequences obtained from the anoxic inoculum, marked with an asterisk, were more diverse than the aerobic inoculum and showed phylogenetic affiliation to the Phylum 15
Firmicutes and the classes α- and δ Proteobacteria. Sequences obtained from 3B were mainly distributed among two groups, one showing phylogenetic affiliation to the family Sphingomonadaceae and the other to the order Rhizobiales. Sequences from the unamended microcosm 4B were distributed among more phylogenetic groups then sequences from the other microcosms, indicating a higher diversity in 4B. Sequences 20
retrieved from 5B showed high similarity to the sequences retrieved from the other anoxic microcosms 3B and 4B, except that no sequences with phylogenetic affiliation to the family Sphingomonadaceae were found in 5B.
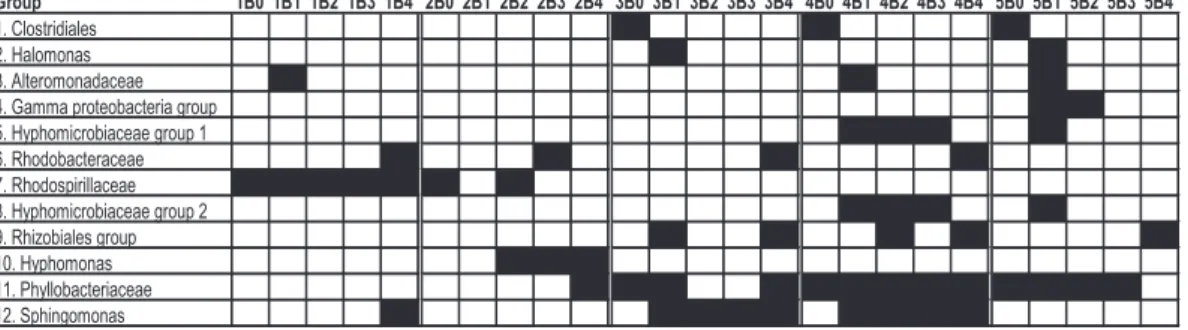
The sequences were placed into 12 phylogenetic groups based on the clustering in the phylogenetic tree (Figs. 9, 10). As seen in Fig. 10, the Rhodospirillaceae, 25
Rhodobacter, and Hyphomonas groups are important in the two oxic microcosms 1B and 2B, while the Sphingomonas, Phyllobacteriaceae, and Hyphomicrobiaceae groups are the most important in the three anoxic microcosms 3B, 4B and 5B
BGD
3, 273–307, 2006 Microorganisms in seafloor basalts J. Einen et al. Title Page Abstract Introduction Conclusions References Tables Figures J I J I Back CloseFull Screen / Esc
Printer-friendly Version Interactive Discussion
EGU
4 Discussion
4.1 Growth of microorganisms in the microcosms
As seen in Figs. 1 and 2, cell concentration in the liquid phase increased from two to four orders of magnitude in the different microcosms. Given a cell dry mass of 2.8×10⁻¹³g (Neidhardt, 1996), and that the elements C, N and P constitute 50, 5 and 5
1% of this mass, respectively, it can be calculated that the artificial sea salt medium as displayed in Table 2, can support 4.2×10⁶cells/mL with C, (90% respiration, 10% to biomass), 3.4×10¹⁰cells/mL with N, and 2.1×10⁷cells/mL with P. Addition of organic carbon in the form of acetate in microcosms 2 and 5B, did not lead to an higher cell density, this would suggest that the microcosms are P restricted. However interpreta-10
tions of these results are difficult since data on cell density are available only from the liquid phase of the microcosm and not from the glass surfaces.
The acetate amendment in microcosms 2B and 5B, represented an additional 200 times increase in total organic carbon (TOC) levels relative to the intrinsic values. All this carbon was exhausted in the anoxic microcosm (5B) but not in the oxic microcosm 15
(2B). The microbial growth curves for the different microcosms (Figs. 1 and 2) might explain some of this difference. If the area below the growth curves is calculated, the results are 1.1×10⁹ cell*days for 1B and 2.8×10⁹ cell*days for 5B. This would lead to an energy requirement for cell maintenance almost three times higher for 5B then for 2B. Another explanation might be that the lack of O2 as a high energy yielding 20
electron acceptor in microcosms 5B, leads to a low energy output per acetate molecule oxidized. In the oxic microcosms 2B, acetate is not noticeable depleted. However a C consumption 10 times higher the intrinsic values, is about the same as the experimental error of acetate amendment. Therefore a substantial acetate oxidation in microcosms 2B could not be excluded.
BGD
3, 273–307, 2006 Microorganisms in seafloor basalts J. Einen et al. Title Page Abstract Introduction Conclusions References Tables Figures J I J I Back CloseFull Screen / Esc
Printer-friendly Version Interactive Discussion
EGU
4.2 Glass alteration
A glass alteration of 30 nm/year, was observed both in the inoculated microcosms and the sterile controls, hence no bioalteration occurred. Calcium carbonate precipitations showed parallel, columnar and filamentous habits in the microcosms as well as in the sterile controls. Consequently the observed CaCO3precipitations were formed by inor-5
ganic processes. Parallel and columnar growth was observed during the whole exper-imental run, where as the filamentous crystal habits only appeared after three months, indicating unstable mineral formation of the crystals with filamentous habits, which will go in solution or re-crystallize to more stable forms by the time. Cavities in the glass surface in the starting material are proof that pit marks with size of microorganisms not 10
necessarily are a result of microbial activity. 4.3 Microcosm 1B, CH4in air
The disappearance of CH4in microcosms 1B (Fig. 3), suggests that oxic methanotro-phy was an active process in 1B. In this microcosm however, none of the sequences showed phylogenetic affiliation to any known methane oxidizers. The explanation for 15
this might be that novel methanotrophs consumed the methane, or the methane oxi-dizers were not dominant and not detected. Sequencing results from the DGGE gel showed that microcosm 1B was dominated by one organism with phylogenetic a ffilia-tion to the spirilla shaped Rhodospirilla sp. during the whole experiment (Fig. 10). SEM analysis however, only revealed spirilla after three months of incubation.
20
4.4 Microcosm 2B, Acetate in air
Acetate consumption in the microcosms was below the detection limit (Fig. 4), however as discussed above, acetate may still have had a significant impact on the microbial community composition. DGGE and DNA sequencing results indicated that two or-ganisms with phylogenetic affiliation to Hyphomonas oceanitis and Phyllobacterium 25
BGD
3, 273–307, 2006 Microorganisms in seafloor basalts J. Einen et al. Title Page Abstract Introduction Conclusions References Tables Figures J I J I Back CloseFull Screen / Esc
Printer-friendly Version Interactive Discussion
EGU
myrsinacearum were dominant components in the community. Hyphomonas spp. be-longs to the budding/prostchate bacteria which represent a heterogeneous group in the alpha proteobacteria. The cells are round to oval and 0.9 µm in diameter, and usually have one hypha which is up to tree times the length of the mother cell. Under favourable growth conditions, a small portion of cells produces two hyphas one at each 5
poles (Hensyl, 1989). Organisms with this type of unique morphology were observed in the microcosm (Fig. 8C). Visualisation by SEM in combination with sequencing results, together form strong evidence that a Hyphomonas sp. was an important community member and dominated microcosm 2B.
4.5 Microcosm 3B, H2in Ar 10
Cluster analysis of the DGGE gel showed that 3B samples clustered together with 4B and separated from 5B, this indicates that H2amendment had little impact on the microcosm. The DGGE gel showed a band emerging after three months which pre-vailed throughout the experiment. Sequencing results showed that this band belonged to an organism with phylogenetic affiliation to Sphingomonas sp., an obligate aerobic 15
heterotrophic rod shaped bacterium (Yabuuchi 1990) often with extensive biofilm pro-duction. SEM analysis showed a rod shaped organism dominated the glass surface in the end of the experiment. This indicates that microcosm 3B was dominated by a sp. after 12 months (Figs. 6, 10). The fact that this Sphingomonas is an obligate aer-obic organism, suggest that the microcosms were in fact microaerophilic rather then 20
anoxic.
4.6 Microcosm 4B, Anoxic without any amendment
The growth profile of this microcosm was nearly identical to the two other microcosms inoculated with anoxic inoculum. This again suggests that the intrinsic C in the media (6 mg/L) was enough to support growth as discussed previously. The DGGE profile 25
BGD
3, 273–307, 2006 Microorganisms in seafloor basalts J. Einen et al. Title Page Abstract Introduction Conclusions References Tables Figures J I J I Back CloseFull Screen / Esc
Printer-friendly Version Interactive Discussion
EGU
experiment, probably because no stress was put on the microbial community in form of energy amendment. The community profile was dominated by one band which was affiliated to the same Sphingomonas found in 3B. Microorganisms from the groups Phyllobacteriaceae and Hyphomicrobiaceae gr1 and gr2 (Figs. 9 and 10) were also important members of the microbial community in 4B. Visual inspection of the samples 5
however, revealed a decrease in morphotypes by time, and biofilm associated rods and prosthecate organisms became dominant (Table 3 and Fig. 8E). This together with the DGGE results strongly indicates that microcosm 4B is dominated by a Sphingomonas sp. and organisms belonging to the family Hyphomicrobiaceae.
4.7 Microcosm 5B, Acetate in N2 10
Acetate was consumed and exhausted after 9 months. This C consumption is not reflected in an elevated growth rate or an increase in cell numbers compared to the two other anoxic microcosm 3B and 4B, however cluster analysis showed that DGGE profiles from 5B clustered separated from the joint cluster of 3 and 4B, indicating that acetate had an impact on community structure rather than growth rate. DNA sequence 15
analysis showed that organisms with phylogenetic affiliation the order Rhizobiales, an order containing many N2fixating organisms. Nine bands was found after 12 months of incubation with a dominating band showing phylogenetic affiliation to Hyphomicrobium sp. SEM analysis also showed abundant prosthecate organisms (Fig. 8F). These facts imply that organisms belonging to the genus Hyphomicrobium were dominating the 20
microcosm 5B after 12 months.
5 Conclusions
Glass alteration on the same levels as found in natural environments was observed in our experiments, but microorganisms were not found to enhance the alteration process. These findings contrast earlier experiments were bioalteration of glass surfaces were 25
BGD
3, 273–307, 2006 Microorganisms in seafloor basalts J. Einen et al. Title Page Abstract Introduction Conclusions References Tables Figures J I J I Back CloseFull Screen / Esc
Printer-friendly Version Interactive Discussion
EGU
easily detectable after only 46 days of incubation (Thorseth et al., 1995). In the experi-ment by Thorseth et al., a nutrient rich medium amended with 10 000 ppm glucose was used. The experiment was then incubated at room temperature. In our experiment we used a medium with low levels of N, P and Fe and only 6 to 1206 ppm TOC, and an incubation temperature of 10◦C, These differences in media composition and incuba-5
tion temperature could explain the different results obtained. High nutrient levels can support a larger biomass with higher activity then oligotrophic condition. Furthermore glucose catabolism will lead to production of organic acids which will speed up the weathering processes by lowering the pH. Some organic acids can also contribute fur-ther to glass dissolution by acting as chelators destabilizing the glass cations. Finally 10
the temperature difference between the two experiments can be expected to have an effect on the microbial activity. In other ecosystems such as soil, an 100% increase in microbial activity is expected with every 10◦C increase in temperature (Killham, 1994). A similar relationship between temperature and activity could also be expected in our experiments. The arguments above suggest that our experiment was too cold, too 15
nutrient poor and had a too short incubation time to observe microbial alteration of glass. In retrospect this is no surprise as our microcosms are similar to the conditions on the seafloor, where glass alterations still occurs in several million years old basalt. Although one year is a long time in microbiology, it’s not in geology.
One would expect the oligotrophic conditions in our experiments to select for au-20
tolithotrophic organisms, but none were detected. The microcosms were instead dom-inated by oligotrophic chemoorganotrophic organisms mainly from the genera Sphin-gomonas and Hyphomicrobium. These organisms may be important for bioalteration in nature, due to their firm attachment to glass surfaces, and their possibility for biofilm formation.
25
The SEM analysis of the negative controls revealed filamentous CaCO3 structures resembling hypha, and pitmarks in the glass. These structures of abiotic origin could easily be misinterpreted as bacterial cells and bacteria formed pit marks. This shows that morphological studies alone are not sufficient for identifying endolithic bacteria.
BGD
3, 273–307, 2006 Microorganisms in seafloor basalts J. Einen et al. Title Page Abstract Introduction Conclusions References Tables Figures J I J I Back CloseFull Screen / Esc
Printer-friendly Version Interactive Discussion
EGU Acknowledgements. This work was supported by the Norwegians Research Council (NFR)
through the SUBMAR program (128418/431). We thank E. Skjoldal for TOC analysis.
References
Altschul, S. F., Gish, W., Miller, W., Myers, E. W., and Lipman, D. J.: Basic Local Alignment Search Tool, J. Mol. Biol., 215, 403–410, 1990.
5
Borneman, J., Skroch, P. W., Osullivan, K. M., Palus, J. A., Rumjanek, N. G., Jansen, J. L., Nienhuis, J., and Triplett, E. W.: Molecular microbial diversity of an agricultural soil in Wis-consin, Appl. Environ. Microbiol., 62, 1935–1943, 1996.
Deines, P., Nafziger, R. H., Ulmer, G. C., and Woermann, E.: Temperature-Oxygen fugacity tables for selected gas mixtures in the system C-H-O at one atmosphere total pressure,
10
Bulletin Earth and Mineral Sciences Experiment Station, 88, University Park, Pennsylvania State University, 1974.
Edwards, K. J., Rogers, D. R., Wirsen, C. O., and McCollom, T. M.: Isolation and character-ization of novel psychrophilic, neutrophilic, Fe-oxidizing, chemolithoautotrophic alpha- and, gamma-Proteobacteria from the deep sea, Appl. Environ. Microbiol., 69, 2906–2913, 2003.
15
Edwards, U., Rogall, T., Blocker, H., Emde, M., and Bottger, E. C.: Isolation and Direct Com-plete Nucleotide Determination of Entire Genes – Characterization of a Gene Coding for 16s-Ribosomal Rna, Nucleic Acids Res., 17, 7843–7853, 1989.
Hensyl, W. R.: Bergeys Manual of Systematic Bacteriology, Baltimore, MD, USA, Williams & Wilkins, 1989.
20
Killham, K.: Soil Ecology, Melbourne, Cambridge University Press, 28–31, 1994.
Lysnes, K., Thorseth, I. H., Steinsbu, B. O., Øvre ˚as, L., Torsvik, T., and Pedersen, K.: Microbial community diversity in seafloor basalt from the Artic spreading ridges, FEMS Microbiol. Ecol., 50, 213–230, 2004.
Muyzer, G., Dewaal, E. C., and Uitterlinden, A. G.: Profiling of Complex Microbial-Populations
25
by Denaturing Gradient Gel-Electrophoresis Analysis of Polymerase Chain Reaction-Amplified Genes-Coding for 16s Ribosomal-Rna, Appl. Environ. Microbiol., 59, 695–700, 1993.
BGD
3, 273–307, 2006 Microorganisms in seafloor basalts J. Einen et al. Title Page Abstract Introduction Conclusions References Tables Figures J I J I Back CloseFull Screen / Esc
Printer-friendly Version Interactive Discussion
EGU
typhimurium- Cellular and Molecular biology, Washington, D.C., American Society for Micro-biology, 1996.
Sanger, F., Nicklen, S., and Coulson, A. R.: DNA Sequencing with Chain-Terminating Inhibitors, Proc. Natl. Acad. Sci. USA, 74, 5463–5467, 1977.
Staudigel, H., Chastain, R. A., Yayanos, A., and Bourcier, W.: Biologically mediated dissolution
5
of glass, Chem. Geol., 126, 147–154, 1995.
Staudigel, H. and Hart, S. R.: Alteration of basaltic glass: Mechanisms and significance for the oceanic crust-seawater budget, Geochim. Cosmochim. Acta, 4, 337–350, 1983.
Staudigel, H., Yayanos, A., Chastain, R., Davies, G., Verdurmen, E. A. T., Schiffman, P.,
Bourcier, R., and De Baar, H.: Biologically mediated dissolution of volcanic glass in
sea-10
water, Earth Planet. Sci. Lett., 164, 233–244, 1998.
Thompson, J. D., Gibson, T. J., Plewniak, F., Jeanmougin, F., and Higgins, D. G.: The CLUSTAL X windows interface: flexible strategies for multiple sequence alignment aided by quality analysis tools, Nucleic Acids Res., 25, 4876–4882, 1997.
Thorseth, I. H., Fumes, H., and Tumyr, O.: Textural and Chemical Effects of Bacterial-Activity
15
on Basaltic Glass – an Experimental Approach, Chem. Geol., 119, 139–160, 1995.
Thorseth, I. H., Furnes, H., and Heldal, M.: The importance of microbiological activity in the alteration of natural basaltic glass, Geochim. Cosmochim. Acta, 56, 845–850, 1991.
Thorseth, I. H., Pedersen, R. B., and Christie, D. M.: Microbial alteration of 0-30-Ma seafloor and sub-seafloor basaltic glasses from the Australian Antarctic Discordance, Earth Planet.
20
Sci. Lett., 215, 237–247, 2003.
Thorseth, I. H., Torsvik, T., Furnes, H., and Muehlenbachs, K.: Microbes play an important role in the alteration of oceanic crust, Chem. Geol., 126, 137–146, 1995.
Thorseth, I. H., Torsvik, T., Torsvik, V., Daae, F. L., and Pedersen, R. B.: Diversity of life in ocean floor basalt, Earth Planet. Sci. Lett., 194, 31–37, 2001.
25
Ueda, T., Suga, Y., and Matsuguchi, T.: Molecular Phylogenetic Analysis of a Soil Microbial Community in a Soybean Field, European Journal of Soil Science, 46, 415–421, 1995. Yabuuchi, E., Yano, I., Oyaizu, H., Hashimoto, Y., Ezaki, T., and Yamamoto, H.: Proposals of
Sphingomonas paucimobilis gen. nov. and comb. nov., Sphingomonas parapaucimobilis sp. nov., Sphingomonas yanoikuyae sp. nov., Sphingomonas adhaesiva sp. nov., Sphingomonas
30
capsulata comb. nov., and two genospecies of the genus Sphingomonas, Microbiology and Immunology, 34, 99–119, 1990.
meromic-BGD
3, 273–307, 2006 Microorganisms in seafloor basalts J. Einen et al. Title Page Abstract Introduction Conclusions References Tables Figures J I J I Back CloseFull Screen / Esc
Printer-friendly Version Interactive Discussion
EGU
tic Lake Saelenvannet, as determined by denaturing gradient gel electrophoresis of PCR-amplified gene fragments coding for 16S rRNA, Appl. Environ. Microbiol., 63, 3367–3373, 1997.
BGD
3, 273–307, 2006 Microorganisms in seafloor basalts J. Einen et al. Title Page Abstract Introduction Conclusions References Tables Figures J I J I Back CloseFull Screen / Esc
Printer-friendly Version Interactive Discussion
EGU
Table 1. Experimental set-up.
Microcosm Inoculum Amendment TOC mg/L
1B Aerobe CH4 6
2B Aerobe Acetate 1206
3B Anaerobe H2 6
4B Anaerobe – 6
BGD
3, 273–307, 2006 Microorganisms in seafloor basalts J. Einen et al. Title Page Abstract Introduction Conclusions References Tables Figures J I J I Back CloseFull Screen / Esc
Printer-friendly Version Interactive Discussion
EGU
Table 2. Ultramarine synthetic sea salt compositiona.
Element Fraction Element Fraction Element Fraction
O 85.7% H 10.8% Cl− 1.9% Na 1.05% Mg 1295 ppm S 885 ppm Ca 400 ppm K 380 ppm Br 65 ppm C 29 ppm TOC 6 ppm B 4.6 ppm Si 3.0 ppm F− 1.3 ppm N 480 ppm I− 60 ppm Li 60 ppb P 58 ppb Zn 4.9 ppb As 3.7 ppb V 2.5 ppb Fe 2.0 ppb Al 2.0 ppb Ni 1.7 ppb Ti 1.0 ppb Cu 500 ppb Mn 200 ppt Co 50 ppt Pb 30 ppt Sn 10 ppt a w/vol.
BGD
3, 273–307, 2006 Microorganisms in seafloor basalts J. Einen et al. Title Page Abstract Introduction Conclusions References Tables Figures J I J I Back CloseFull Screen / Esc
Printer-friendly Version Interactive Discussion
EGU
Table 3. Morphotypes observed by SEM.
Morphotypes 1B1 1B2 1B3 1B4 2B1 2B2 2B3 2B4 3B1 3B2 3B3 3B4 4B1 4B2 4B3 4B4 5B1 5B2 5B3 5B4
cocci (∼0.5–0.7 µm) X X
spirilla (2 µm) X
rods (≤1 µm) X X X Xd X X X
rods (1–5 µm) X X Xd X X X Xd X Xd Xde Xd Xe Xe rods (0.5–1 µm)+ single stalk (0.5–5µm) Xd X X X X rods (1–2 µm)+ single stalk (<25 µm) X X X X Xd X Xd X X Xde Xd rods (∼1.5 µm)+ single stalk (<20 µm) + budding Xd Xd
rods (∼1.5 µm)+ dipolar stalks ± budding X rods (1.5 µm)+ multiple stalks ± budding X
rods “with one twin end” (∼5 µm) X “budding” bacteria (Fig. 7B) X
BGD
3, 273–307, 2006 Microorganisms in seafloor basalts J. Einen et al. Title Page Abstract Introduction Conclusions References Tables Figures J I J I Back CloseFull Screen / Esc
Printer-friendly Version Interactive Discussion EGU
1,00E+03
1,00E+04
1,00E+05
1,00E+06
1,00E+07
1,00E+08
0
3
6
9
12
Months of incubation
Ce
lls
/m
L
1B
2B
Fig. 1. Cell concentration in the liquid phase of the two oxic microcosms 1B (with CH4), and 2B
BGD
3, 273–307, 2006 Microorganisms in seafloor basalts J. Einen et al. Title Page Abstract Introduction Conclusions References Tables Figures J I J I Back CloseFull Screen / Esc
Printer-friendly Version Interactive Discussion EGU
1,00E+03
1,00E+04
1,00E+05
1,00E+06
1,00E+07
1,00E+08
0
3
6
9
12
Months of incubation
C
ells
/m
L
3B
4B
5B
Fig. 2. Cell concentration in the liquid phase of the three anoxic microcosms, 3B (with H2), 4B
BGD
3, 273–307, 2006 Microorganisms in seafloor basalts J. Einen et al. Title Page Abstract Introduction Conclusions References Tables Figures J I J I Back CloseFull Screen / Esc
Printer-friendly Version Interactive Discussion EGU 0 5 10 15 20 25 30 35 40 45 0 3 6 9 12
Months of incubation
mmo
l C
H
4Fig. 3. Accumulated methane consumption in microcosm 1B (aerobic, amended with CH4)
BGD
3, 273–307, 2006 Microorganisms in seafloor basalts J. Einen et al. Title Page Abstract Introduction Conclusions References Tables Figures J I J I Back CloseFull Screen / Esc
Printer-friendly Version Interactive Discussion EGU
0
5
10
15
20
25
30
35
0
3
6
9
12
Months of incubation
m
M
A
cet
at
e
5B
2B
Fig. 4. Acetate consumption in microcosms 2B (aerobe with acetate) and 5B (anaerobe with acetate). The error bars shows the experimental error.
BGD
3, 273–307, 2006 Microorganisms in seafloor basalts J. Einen et al. Title Page Abstract Introduction Conclusions References Tables Figures J I J I Back CloseFull Screen / Esc
Printer-friendly Version Interactive Discussion
EGU
25 Figure 5: Glass alteration and secondary mineral formation during the experiment. (A) Typical alteration rim developed at the surface of glass grains (arrow) after 12 months in both inoculated microcosms and un-inoculated controls. (B) Pit marks in surface of glass grain from 2B (aerobic, amended with acetate), non-inoculated control, after 12 months. (C) Filamentous CaCO3 precipitations after 3 month in both inoculated and un-inoculated
microcosms. No cells were attached to the filamentous precipitates. After 6, 9, and 12 months, no filamentous precipitates were observed. Parallel (D&E) and columnar (F) growth of CaCO3 precipitations occurred in all inoculated microcosms and un-inoculated
controls.
Fig. 5. Glass alteration and secondary mineral formation during the experiment. (A) Typical al-teration rim developed at the surface of glass grains (arrow) after 12 months in both inoculated
microcosms and un-inoculated controls.(B) Pit marks in surface of glass grain from 2B
(aero-bic, amended with acetate), non-inoculated control, after 12 months. (C) Filamentous CaCO3
precipitations after 3 month in both inoculated and un-inoculated microcosms. No cells were attached to the filamentous precipitates. After 6, 9, and 12 months, no filamentous precipitates
were observed. Parallel(D) and (E) and columnar (F) growth of CaCO3precipitations occurred
in all inoculated microcosms and un-inoculated controls.
BGD
3, 273–307, 2006 Microorganisms in seafloor basalts J. Einen et al. Title Page Abstract Introduction Conclusions References Tables Figures J I J I Back CloseFull Screen / Esc
Printer-friendly Version Interactive Discussion EGU 1B 2B 3B 4B 5B Months: 0 3 6 9 12 0 3 6 9 12 0 3 6 9 12 0 3 6 9 12 0 3 6 9 12 Microcosm: 1 [1-7] [8-11] [12] [13-16] [17-18] [19] [20-21] [22-27] M.. M. M. M. [28-36] [37] [38] [39-42] [43-47] [48-52] [53-54][55-61] [62-67] [68] [69-70] [71-75] 75 > > > > > > > > > > > > > > > > > > > > > > > > > > > > > > > > > > > > > > >> > > > > > > > > > > > > > > > > > > > > > > > > > > > > > > > > > > > > > > > > > > > >> > > 1B 2B 3B 4B 5B Months: 0 3 6 9 12 0 3 6 9 12 0 3 6 9 12 0 3 6 9 12 0 3 6 9 12 Microcosm: 1 [1-7] [8-11] [12] [13-16] [17-18] [19] [20-21] [22-27] M.. M. M. M. [28-36] [37] [38] [39-42] [43-47] [48-52] [53-54][55-61] [62-67] [68] [69-70] [71-75] 75 > > > > > > > > > > > > > > > > > > > > > > > > > > > > > > > > > > > > > > >> > > > > > > > > > > > > > > > > > > > > > > > > > > > > > > > > > > > > > > > > > > > >> > >
Fig. 6. DGGE gels showing a genetic fingerprint of the bacterial communities in the two aerobic
microcosms 1B (with CH4), 2B (with acetate) and the three anaerobic microcosms 3B (with H2),
4B (unamended) and 5B (with acetate) during the twelve months of incubation. The arrows indicate sequenced bands. The numbers below each lane shows the band/sequence number of each band in that particular lane, numbered from top to bottom. The numbering given here
BGD
3, 273–307, 2006 Microorganisms in seafloor basalts J. Einen et al. Title Page Abstract Introduction Conclusions References Tables Figures J I J I Back CloseFull Screen / Esc
Printer-friendly Version Interactive Discussion EGU
Oxic
incubation
Anoxic
incubation
Fig. 7. Clustering of samples based band patterns from the DGGE gel in Fig. 6. The sample names are constructed with microcosm name followed by sampling number. i.e. 1B2 means second sampling (6 months of incubation) of microcosms 1B.
BGD
3, 273–307, 2006 Microorganisms in seafloor basalts J. Einen et al. Title Page Abstract Introduction Conclusions References Tables Figures J I J I Back CloseFull Screen / Esc
Printer-friendly Version Interactive Discussion
EGU
28 Figure 8: Attached bacterial cells on glass surfaces during the experiment. (A) and (B) Glass grains from microcosm 1B (aerobe with CH4)showing typical attached bacteria at 3 months
(A) and 12 months (B). (C) Growth of bacteria on glass surface in microcosms 2B (aerobe with acetate) after 12 months. (D) Cells attached to the glass surface after 9 month under anaerobe conditions with H2 from microcosm 3B. (E) Exopolymer producing cells from
microcosm 4B (anaerobic with no amendment) after 12 months. (F) Prostechate bacterial cells from microcosm 5B (Anaerobic with acetate) after 12 month
Fig. 8. Attached bacterial cells on glass surfaces during the experiment. (A) and (B) Glass
grains from microcosm 1B (aerobe with CH4) showing typical attached bacteria at 3 months
(A) and 12 months (B).(C) Growth of bacteria on glass surface in microcosms 2B (aerobe
with acetate) after 12 months. (D) Cells attached to the glass surface after 9 month under
anaerobe conditions with H2 from microcosm 3B.(E) Exopolymer producing cells from
micro-cosm 4B (anaerobic with no amendment) after 12 months.(F) Prostechate bacterial cells from
microcosm 5B (Anaerobic with acetate) after 12 month.
BGD
3, 273–307, 2006 Microorganisms in seafloor basalts J. Einen et al. Title Page Abstract Introduction Conclusions References Tables Figures J I J I Back CloseFull Screen / Esc
Printer-friendly Version Interactive Discussion EGU 97 52 98 83 92 97 86 54 22 99 50 46 32 32 32 32 32 32 32 32 34 89 0.1 [AY349389] Peptococcus sp. 3B0-23* 3B0-25* [D13722] Sphingomonas adhaesiva 4B2-50 3B3-37 4B1-43 4B1-44 3B3-38 3B1-29 3B4-39 1B4-13 4B4-55 [U63956] Sphingomonas sp. 4B3-53
[U41562] Pelobacter venetianus 3B0-22*
[AF099062] Desulfotalea psychrophilus
[AJ298748] Nitrosococcus halophilus [AF016981] Methylobacter sp.
5B1-65 5B2-68
[AF038843] Sulfurospirillum barnesii 4B2-48
[AB080645] Sulfuricurvum kujiense [L40808] Thiomicrospira denitrificans [AY616755] Halomonas variabilis
3B1-35 5B1-67
[U85907] Shewanella gelidimarina [AB003191] Photobacterium profundum 4B1-45
5B1-62 1B1-8 [U85844] Colwellia demingiae [AJ227759] Caulobacter fusiformis [AB017203] Prosthecomicrobium pneumaticum
4B1-46 4B2-51 4B3-54 5B1-63 [AB110414] Blastochloris sulfoviridis 1B4-15
4B4-57 3B4-41 2B3-19
[AJ582227] Loktanella vestfoldensis [AJ534225] Jannaschia helgolansis 4B4-58
4B4-60
[AF513476] Rhodospirillaceae bacterium PH30 1B0-2* 1B2-12 1B1-11 1B0-3* 1B0-6* 1B0-5* 1B1-9 2B2-18 1B0-7* 1B0-4* 1B0-1* 1B4-16 [D30791] Rhodobium marinum [AB087720] Rhodopseudomonas julia 4B4-56 5B4-71 5B4-72 3B1-28 4B2-49 4B4-59 3B1-32 3B4-40 [D49423] Pseudomonas riboflavina [AJ227814] Hyphomonas jannaschia 2B2-17
2B4-20 [X94198] Xanthobacter agilis [AJ132378] Defluvibacter lusdtiae 3B4-42
[D12789] Phyllobacterium myrsinacearum [Y15403] Aquamicrobium defluvium 3B1-34 5B1-66 4B4-61 5B3-70 4B2-52 2B4-21 3B1-31 3B0-26* 5B1-64 5B3-69 [X05567] Archaeoglobus fulgidus [M83548] Aquifex pyrophilus α γ Firmicutes 97 66 77 95 52 99 38 99 94 51 95 96 25 26 77 99 31 51 65 78 99 30 51 78 36 80 7 29 6 10 99 44 9 4 2 25 21 14 51 99 59 50 40 29 39 46 97 98 47 ε 1. Clostridiales group 2. Halomonas group 3. Alteromonadaceae group
4. Gamma proteobacteria group
5. Hyphomicrobiaceae group 1 6. Rhodobacteraceae group 8. Hyphomicrobiaceae group 2 7. Rhodospirillaceae group 9. Rhizobiales group 10. Hyphomonas group 11. Phyllobacteriaceae group 12. Sphingomonas group 97 52 98 83 92 97 86 54 22 99 50 46 32 32 32 32 32 32 32 32 34 89 0.1 0.1 [AY349389] Peptococcus sp. 3B0-23* 3B0-25* [D13722] Sphingomonas adhaesiva 4B2-50 3B3-37 4B1-43 4B1-44 3B3-38 3B1-29 3B4-39 1B4-13 4B4-55 [U63956] Sphingomonas sp. 4B3-53
[U41562] Pelobacter venetianus 3B0-22*
[AF099062] Desulfotalea psychrophilus
[AJ298748] Nitrosococcus halophilus [AF016981] Methylobacter sp.
5B1-65 5B2-68
[AF038843] Sulfurospirillum barnesii 4B2-48
[AB080645] Sulfuricurvum kujiense [L40808] Thiomicrospira denitrificans [AY616755] Halomonas variabilis
3B1-35 5B1-67
[U85907] Shewanella gelidimarina [AB003191] Photobacterium profundum 4B1-45
5B1-62 1B1-8 [U85844] Colwellia demingiae [AJ227759] Caulobacter fusiformis [AB017203] Prosthecomicrobium pneumaticum
4B1-46 4B2-51 4B3-54 5B1-63 [AB110414] Blastochloris sulfoviridis 1B4-15
4B4-57 3B4-41 2B3-19
[AJ582227] Loktanella vestfoldensis [AJ534225] Jannaschia helgolansis 4B4-58
4B4-60
[AF513476] Rhodospirillaceae bacterium PH30 1B0-2* 1B2-12 1B1-11 1B0-3* 1B0-6* 1B0-5* 1B1-9 2B2-18 1B0-7* 1B0-4* 1B0-1* 1B4-16 [D30791] Rhodobium marinum [AB087720] Rhodopseudomonas julia 4B4-56 5B4-71 5B4-72 3B1-28 4B2-49 4B4-59 3B1-32 3B4-40 [D49423] Pseudomonas riboflavina [AJ227814] Hyphomonas jannaschia 2B2-17
2B4-20 [X94198] Xanthobacter agilis [AJ132378] Defluvibacter lusdtiae 3B4-42
[D12789] Phyllobacterium myrsinacearum [Y15403] Aquamicrobium defluvium 3B1-34 5B1-66 4B4-61 5B3-70 4B2-52 2B4-21 3B1-31 3B0-26* 5B1-64 5B3-69 [X05567] Archaeoglobus fulgidus [M83548] Aquifex pyrophilus α γ Firmicutes 97 66 77 95 52 99 38 99 94 51 95 96 25 26 77 99 31 51 65 78 99 30 51 78 36 80 7 29 6 10 99 44 9 4 2 25 21 14 51 99 59 50 40 29 39 46 97 98 47 εε δ 1. Clostridiales group 2. Halomonas group 3. Alteromonadaceae group
4. Gamma proteobacteria group
5. Hyphomicrobiaceae group 1 6. Rhodobacteraceae group 8. Hyphomicrobiaceae group 2 7. Rhodospirillaceae group 9. Rhizobiales group 10. Hyphomonas group 11. Phyllobacteriaceae group 12. Sphingomonas group Fig. 9.
BGD
3, 273–307, 2006 Microorganisms in seafloor basalts J. Einen et al. Title Page Abstract Introduction Conclusions References Tables Figures J I J I Back CloseFull Screen / Esc
Printer-friendly Version Interactive Discussion
EGU
Fig. 9. Neighbour Joining tree showing the sequenced DGGE band (bold) and reference se-quences from GenBank. The phylogenetic taxa indicated on the right hand side of the tree are based on the phylogenetic affiliation of the reference sequences. The tree was bootstrapped a 100 times, and values are shown on the nodes (100% values are not shown). The bar repre-sents 0.1 substitutions per nucleotide position. Archaeoglobus fulgidus was used as outgroup. Sequences marked with asterisks are retrieved from the inoculums.
BGD
3, 273–307, 2006 Microorganisms in seafloor basalts J. Einen et al. Title Page Abstract Introduction Conclusions References Tables Figures J I J I Back CloseFull Screen / Esc
Printer-friendly Version Interactive Discussion EGU Group 1B0 1B1 1B2 1B3 1B4 2B0 2B1 2B2 2B3 2B4 3B0 3B1 3B2 3B3 3B4 4B0 4B1 4B2 4B3 4B4 5B0 5B1 5B2 5B3 5B4 1. Clostridiales 2. Halomonas 3. Alteromonadaceae 4. Gamma proteobacteria group 5. Hyphomicrobiaceae group 1 6. Rhodobacteraceae 7. Rhodospirillaceae 8. Hyphomicrobiaceae group 2 9. Rhizobiales group 1 10. Hyphomonas 11. Phyllobacteriaceae 12. Sphingomonas 1
Fig. 10. Presence of phylogenetic groups during the experiment in the five different
micro-cosms. Black squares means that at least one sequence from that sample group into the specified phylogenetic group as established in Fig. 9. The sample names are constructed with microcosm name followed by sampling number. i.e. 1B2 means second sampling (6 months of incubation) of microcosms 1B.