HAL Id: hal-00297766
https://hal.archives-ouvertes.fr/hal-00297766
Submitted on 24 Jun 2005HAL is a multi-disciplinary open access
archive for the deposit and dissemination of sci-entific research documents, whether they are pub-lished or not. The documents may come from teaching and research institutions in France or abroad, or from public or private research centers.
L’archive ouverte pluridisciplinaire HAL, est destinée au dépôt et à la diffusion de documents scientifiques de niveau recherche, publiés ou non, émanant des établissements d’enseignement et de recherche français ou étrangers, des laboratoires publics ou privés.
Nitric oxide and nitrous oxide emission from Hungarian
forest soils; link with atmospheric N-deposition
L. Horváth, E. Führer, K. Lajtha
To cite this version:
L. Horváth, E. Führer, K. Lajtha. Nitric oxide and nitrous oxide emission from Hungarian forest soils; link with atmospheric N-deposition. Biogeosciences Discussions, European Geosciences Union, 2005, 2 (3), pp.703-723. �hal-00297766�
BGD
2, 703–723, 2005
NO and NO2 emission from Hungarian
forest soils
L. Horv ´ath et al.
Title Page Abstract Introduction Conclusions References Tables Figures J I J I Back Close
Full Screen / Esc
Print Version Interactive Discussion EGU Biogeosciences Discussions, 2, 703–723, 2005 www.biogeosciences.net/bgd/2/703/ SRef-ID: 1810-6285/bgd/2005-2-703 European Geosciences Union
Biogeosciences Discussions
Biogeosciences Discussions is the access reviewed discussion forum of Biogeosciences
Nitric oxide and nitrous oxide emission
from Hungarian forest soils; link with
atmospheric N-deposition
L. Horv ´ath1, E. F ¨uhrer2, and K. Lajtha3
1
Department for Analysis of Atmospheric Environment, Hungarian Meteorological Service, Gilice t ´er 39, 1181 Budapest, Hungary
2
Forest Research Institute, Frankel Le ´o u. 42-44, 1023, Budapest, Hungary
3
Department of Botany and Plant Pathology, Oregon State University, Corvallis, Oregon, USA Received: 2 May 2005 – Accepted: 14 June 2005 – Published: 24 June 2005
Correspondence to: L. Horv ´ath ([email protected])
BGD
2, 703–723, 2005
NO and NO2 emission from Hungarian
forest soils
L. Horv ´ath et al.
Title Page Abstract Introduction Conclusions References Tables Figures J I J I Back Close
Full Screen / Esc
Print Version Interactive Discussion
EGU
Abstract
Studies of forest nitrogen (N) budgets generally measure inputs to the atmosphere in wet and dry precipitation and outputs via hydrologic export. Although denitrifica-tion has been shown to be important in many wetland ecosystems, emission of nitro-gen oxides from forest soils is an important, and often overlooked, component of an 5
ecosystem nitrogen budget. During one year (2002–2003), emissions of nitric oxide (NO) and nitrous oxide (N2O) were measured from Sessile oak and Norway spruce forest soils in northeast Hungary. Accumulation in small static chambers followed by gas chromatography-mass spectrometry detection was used for the estimation of N2O emission flux. Because there are rapid chemical reactions of NO and ozone, small 10
dynamic chambers were used for in situ NO flux measurements. Average soil emis-sions of NO were 1.2 and 2.1 µg N m−2h−1, and for N2O were 15 and 20 µg N m−2h−1, for spruce and oak soils, respectively. The previously determined nitrogen balance between the atmosphere and the forest ecosystem was re-calculated using these soil emission figures. The total (dry+ wet) atmospheric N-deposition to the soil was 1.42 15
and 1.59 g N m−2yr−1 for spruce and oak, respectively, while the soil emissions are 0.14 and 0.20 g N m−2yr−1. Thus, about 10–13% of N compounds deposited to the soil, mostly as NH3/NH+4 and HNO3/NO−3, are transformed in the soil and emitted back to the atmosphere, mostly as a greenhouse gas (N2O).
1. Introduction
20
Forest ecosystem N budgets have received considerable attention in recent years, in part due to increasing concern over increased N delivery to receiving waters from N sat-urated ecosystems (Aber et al., 1998; Dise et al., 1998; Pregitzer et al., 2004). In order to create predictive models of ecosystem and stream response to elevated N deposi-tion, all pathways of N input and loss must be known (Baron et al., 1994). Nitric oxide 25
(NO) and nitrous oxide (N2O) are known as intermediate products of nitrification and 704
BGD
2, 703–723, 2005
NO and NO2 emission from Hungarian
forest soils
L. Horv ´ath et al.
Title Page Abstract Introduction Conclusions References Tables Figures J I J I Back Close
Full Screen / Esc
Print Version Interactive Discussion
EGU
denitrification processes in soils, and forest soil may be an important source for these compounds. Recent research has shown that the emission of NO and N2O depends, among other things, on forest type, soil characteristics, and on atmospheric deposition of N to the forest ecosystem (Groffman and Tiedje, 1989; Henrich and Haselwandter, 1997; Vermes and Myrold, 1992). In a cross-site study of 15 European forests sites 5
(Pilegaard and NOFRETETE Team, 2004, 20051), the ratio of nitrogen oxide emission to N-deposition ranged from very little up to 50%. Although denitrification has shown to be insignificant in many forest ecosystems (e.g. Gundersen, 1991; Myrold at al., 1989), it is clear that in some forests, soils may contribute to the atmospheric N-budget at both a local and a global scale. As a large part of these N emissions may occur in the form 10
of N2O, such emissions have significant implications for global warming.
Field-based measurements of nitrogen oxide emissions from forested soils are lim-ited. The aim of this work was to extend the forest soil nitrogen oxide emission network to Eastern Europe and provide data for its special climate, N deposition history, and vegetation. This paper summarises the Hungarian contribution to the NOFRETETE 15
objectives based on a one year long field study of nitrogen oxide emission from Sessile oak (Quercus petraea) and Norway spruce (Picea abies (L.) Karst.) forest soils in Hun-gary. A second objective was to compare the emission of nitrogen oxides form soils to the atmospheric N deposition fluxes, thus placing emissions into the context of the ecosystem N budget.
20
2. Measurements
2.1. Field sites
Both sites used in this study lie in the forested area of M ´atra Mountains, NE Hun-gary, and are located in Ecology Research Stations of Forest Research Institute.
Co-1
Pilegaard, K. and the NOFRETETE Team: Nitrogen load and forest type determine soil emission of nitrogen oxides (NO and N2O), Biogeosciences Discuss., submitted, 2005.
BGD
2, 703–723, 2005
NO and NO2 emission from Hungarian
forest soils
L. Horv ´ath et al.
Title Page Abstract Introduction Conclusions References Tables Figures J I J I Back Close
Full Screen / Esc
Print Version Interactive Discussion
EGU
ordinates of the 8 ha Norway spruce stand (Nyirjes) are: λ=19◦5700500, φ=47◦5303800, h=560 m. The age of the stand is 38-40 years, and leaf area index measured in 1993 is 3.3. Co-ordinates of the 20 ha Sessile oak stand (Tetves-r ´et) are: λ=19◦5800100,
φ=47◦5105600, h=660 m. The age of this stand is 71–76 years, and leaf area index was estimated as 4.0. The distance between the two stands is 5 km. Mean annual 5
precipitation at both sites is 780 mm, and mean annual temperature is 5.7◦C. The main characteristics of the stand and soil can be seen in Table 1.
2.2. N2O soil emission flux measurements
Nitrous oxide fluxes were determined by small static (closed) chambers following meth-ods of Christensen et al. (1990). A total of 8-8 parallel chambers were used at both 10
sites. Chambers were permanently placed approximately 3–4 m apart along a tran-sect. The area and volume of the chambers are 80 cm2 and 400 cm3, respectively. After closure, gas samples were taken at t=0, 10, 20 and 30 min with a syringe. A total of 6 ml of sample was injected into a 5.6 ml evacuated tube. Accumulation of N2O was measured by a gas chromatography-mass spectrometry system. Emission fluxes were 15
calculated from the accumulation of nitrous oxide gas in the chamber. The calibration standard gas was 313 ppb N2O in N2, provided by NOAA, Environmental Monitoring and Diagnostics Laboratory. We sampled weekly except when soils were covered by snow. Pilot measurements for the spruce stand were taken June–August, 2002, and regular measurements were taken October 2002–October 2003. We calculated the 20
non-systematic error (coefficient of variation) of sampling and analysis with repeated sampling performed on one day at the two sites. The time difference between repeated samplings was 45 min. Assuming that the emission flux from the soil was stable during this time, our bulk (sampling and analysis) error is approximately 10%. Repeated GC-MS analyses from samples of 3 October 2002 from the oak site resulted in 52.1 and 25
51.4 µg N m−2h−1 mean calculated flux. During a test run by sampling every minute, the coefficient of variation determined from the de-trended line was 11%.
There is evidence for a systematic underestimation of soil gas flux using closed 706
BGD
2, 703–723, 2005
NO and NO2 emission from Hungarian
forest soils
L. Horv ´ath et al.
Title Page Abstract Introduction Conclusions References Tables Figures J I J I Back Close
Full Screen / Esc
Print Version Interactive Discussion
EGU
chambers. For carbon dioxide soil efflux, Rayment (2000) pointed out one bias caused by the fact that the effective volume of a chamber is larger than the physical cham-ber volume since it also includes the volume of air-filled spaces in the soil. This un-derestimation increases with a decrease in the height of the chamber. In our case (h=5 cm), using Rayment’s estimates for an equivalent depth of air in soil, soil fluxes 5
are underestimated by 24%. Conen and Smith (2000) predicted that N2O concentra-tion increases in the soil air immediately after closure of the chamber due to high gas concentrations in the upper part of the soil profile. Christensen et al. (1996) compared 10 different closed, dynamic chambers and micro-meteorological methods and found a good agreement between results. However, they also reported that the magnitude of 10
underestimation is 20% using small chambers.
2.3. NO soil emission flux measurements
For the estimation of soil NO flux, small dynamic chambers were used with the same volume described above. A HORIBA gas monitor was used to detect the concentration of NO leaving the chambers at both the spruce and oak sites. The ozone mixing ra-15
tio was simultaneously monitored. The calibration standard gas was 8 ppm NO/N2. A Thermo Electron gas calibration system was used for multi-point calibration in the mix-ing ratio range of 0–10 ppb. The coefficient of variation determined for a calibration gas of 8 ppb was 0.9%. For soil samples with a mixing ratio of 1 and 10 ppb, the measured coefficients of variation were 5.3% and 1.5%, respectively. Since the average mixing 20
ratio found during the flux measurements lies between these two figures, our estimated coefficient of variation ranges between 1 and 5%.
Ten minute concentration averages were recorded. Flow rate of the air through the dynamic chamber was 0.327 L min−1. The flux was calculated according to Meixner (1997) as follows, taking into account the rapid chemical reaction of nitric oxide and 25
ozone:
BGD
2, 703–723, 2005
NO and NO2 emission from Hungarian
forest soils
L. Horv ´ath et al.
Title Page Abstract Introduction Conclusions References Tables Figures J I J I Back Close
Full Screen / Esc
Print Version Interactive Discussion
EGU
The photolysis rate of NO2 inside the dark chambers was estimated to be zero. Under steady state conditions the mass balance equation for NO can be written as:
Ff + Fm+ Fbl + Fgp= 0, (1) where Ff is the soil flux, Fm is the difference between fluxes entering and leaving the chamber, Fbl is the term for the wall effect, and Fgpis the loss of NO due to the chemical 5
reaction with ozone. According to our measurements Fbl is negligible because of the relatively short residence time (∼80 s) of the gas mixture in the chamber. The soil flux (in units of µg N m−2h−1) can be calculated by the following equation where the two terms on the right represent the input and output fluxes from the chamber and the effect of the chemical reaction, respectively:
10
Ff = {[NO]out−[NO]in}f1f2∗ Q/A+ {k[NO]out[O3]out}f1∗ V/A, (2) where Q is the flow rate (0.327*10−3m3min−1), A is the surface of the soil covered by the chamber [8*10−3m2], [NO]outand [NO]in are the NO mixing ratios leaving and entering the chamber [ppb], f1=14/Vt, Vt is the molar volume at the given temperature
t[◦C] (Vt=0.0795*t+22.41), f2=60 [min h−1] is the conversion term from minutes into 15
hours, V is the volume of the chamber, including tubing (4.44*10−4m3), k is the reaction rate constant calculated as k=1.8*102exp(−1400/T ) [ppb−1h−1] (Seinfeld and Pandis, 1998), where T is the air temperature [K], and [O3]outis the mixing ratio of ozone (ppb) leaving the chamber. Because the latter term was not recorded, soil flux was calculated first using [O3]out assuming that: [O3]in≈[O3]out. This approximation is valid, if ozone 20
is in excess of NO. In our case, the average mixing ratios of NO and ozone were 1.43 and 47.1 ppb, respectively, showing order of magnitude differences in the mixing ratios. However, in some cases the mixing ratio of NO was high and [O3]in>[O3]out. For this reason [O3]outwas estimated from the following equation:
[O3]out=[O3]in−{[NO]out−[NO]in} ∗ Fgp/Fm={k[NO]out[O3]out} ∗ V/Qf2, (3)
25
which takes into account NO loss via reaction with ozone through the ratio of
Fgp/Fm.From this equation the exact calculation of [O3]out is impossible, but through 708
BGD
2, 703–723, 2005
NO and NO2 emission from Hungarian
forest soils
L. Horv ´ath et al.
Title Page Abstract Introduction Conclusions References Tables Figures J I J I Back Close
Full Screen / Esc
Print Version Interactive Discussion
EGU
iteration we are able to estimate the mixing ratio of ozone in the output air. First, [O3]out was calculated assuming [O3]in≈[O3]out for the calculation of Fgp. Then Fgp was
re-calculated with the inferred [O3]out. This process was repeated 5 times until there was no further change in the estimate of [O3]out. The use of the correction for [O3]out gives a lower value for the mean estimated soil fluxes by 10%. The difference is much lower 5
when the mixing ratio of NO is low. The variation in diurnal flux rate was checked by longer (approximately 24 h) measurements. The signal was relatively stable for 20 h, but a small decrease was observed at night.
At the spruce site, NO flux was measured once or twice a month. Flux rates were determined 4 times at the oak site, and the magnitude of yearly mean flux was esti-10
mated using the ratio of fluxes in spruce and oak forest during the same period (in May, June, and September, 2003). The ratio of observed fluxes during these measurements was 1.744. This factor was used to generate monthly values for NO flux in oak. This is a rough estimate, but the magnitude of NO flux (especially for the comparison to N2O) can be estimated this way.
15
Physical and chemical characteristics of the soil were measured in parallel with soil emission flux measurements. Soil temperature and moisture at three depths (5, 10 and 20 cm) has been recorded in the spruce stand since 1999 and since November, 2002 in the oak stand. Soil moisture data are available only at 20 cm at the spruce stand. 2.4. Atmospheric N deposition
20
For the estimation of total atmospheric N-input to the canopy, dry deposition was in-ferred as DD=C v, where C is the daily mean concentration measured in 2001–2003, v is the mean dry deposition velocity in the different seasons, determined during earlier field trials. This estimate considered the net dry flux of ammonia (NH3) and nitrogen dioxide (NO2) gases and nitric acid (HNO3) vapour as well as the dry flux of ammonium 25
(NH+4) and nitrate (NO−3) ions in aerosol particles.
Dry deposition velocity of NO2 gas was measured for three years (1996 and 1998) by the gradient method described in Horv ´ath et al. (1997, 1998). Dry flux was
calcu-BGD
2, 703–723, 2005
NO and NO2 emission from Hungarian
forest soils
L. Horv ´ath et al.
Title Page Abstract Introduction Conclusions References Tables Figures J I J I Back Close
Full Screen / Esc
Print Version Interactive Discussion
EGU
lated as F=−KHd C/d z, where KH is the turbulent diffusion coefficient for the sensible heat flux, dC/dz is the concentration gradient. Concentration gradient was determined by concentration measurements at different heights (28, 23, 18 m) above the 16 m height canopy by a HORIBA APNA-350E NOx gas monitor. Concentration averages of 5 minute were logged at each level. Diffusion coefficients of gases were calculated 5
according to the Monin-Obukhov’s semi-empirical similarity theory (Weidinger et al., 2000) for stable and unstable stratification for the layer between 28 and 18 m.
Concentration of ammonia, nitric acid and ammonium and nitrate particles were determined on the basis of 24-h sampling according to the EMEP (1996) filter pack method. Ammonia gas and ammonium particles were measured as ammonium in 10
the solution of sampling filters by indophenol-blue spectrophotometry. Nitric acid and nitrate particles were analysed by ion-chromatography. Dry deposition velocity was determined during an intensive campaign in 1998 (Horv ´ath et al., 2001), using the gra-dient technique. Concentration gragra-dient was determined by two filter pack samplers settled at the height of 28 and 18 m. Dry flux (DD) was calculated by the Monin-15
Obukhovs’s similarity theory mentioned above. Mean dry deposition velocity was cal-culated as v=DD/C, where C is the concentration at the upper height.
Wet, throughfall and stemflow deposition of nitrate and ammonium were also de-termined during 2001–2003. Wet deposition (WD) of nitrogen was dede-termined as
W D=C∗p, where C is the concentration of ammonium or nitrate measured in
precipi-20
tation, p is the precipitation volume. Daily precipitation samples were taken by a wet-only collector out of the forest canopy. Ammonium and nitrate ions were determined by spectrophotometry and ion-chromatography, respectively.
Rain and snow samples were collected for throughfall by 5 collectors (0.2 m2 cross-section area) randomly placed under the canopy in each stand, and for stemflow by 25
flexible tubes attached to the trunk of 10 select trees in each stand. Details of sampling and measurement are described in Kov ´acs and Horv ´ath (2004) and Horv ´ath (2004). At the spruce site, ozone concentrations are regularly recorded, and daily 24-h con-centrations of N and S compounds are measured. There are various meteorological
BGD
2, 703–723, 2005
NO and NO2 emission from Hungarian
forest soils
L. Horv ´ath et al.
Title Page Abstract Introduction Conclusions References Tables Figures J I J I Back Close
Full Screen / Esc
Print Version Interactive Discussion
EGU
and forestry measurements at the two sites (wind, air temperature, humidity, litter fall, forest growth, etc.).
The relation of wet (WD), dry (DD), throughfall (TF), stemflow (SF) depositions can be expressed by the equation:
W D+ DD = T F + SF + NCE, (4)
5
where NCE denotes net canopy uptake, or the amount of deposited N taken up by the plant though stomata (Lovett and Lindberg 1993, Ferm and Hultberg, 1999).
3. Results
3.1. N2O soil flux
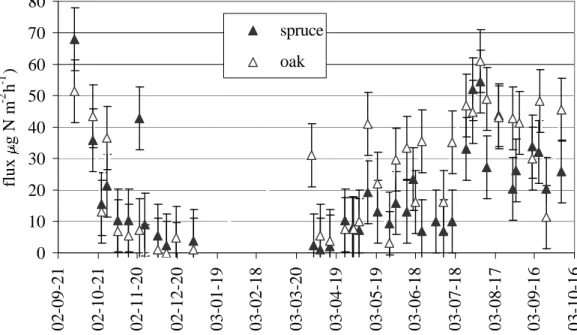
Soil N2O flux measured between October 2002 and October 2003 ranged from 0 to 10
70 µg N m−2h−1, depending on the season, with averages of 15 and 20 µg N m−2h−1 for spruce and oak, respectively (Fig. 1). Flux was not measured from the beginning of January until the end of March, 2003 due to snow. Yearly averages were calculated from the monthly means of 4–5 measurements per month assuming zero flux for the winter period with snow cover (Table 2). During this period soil temperature was close 15
to 0◦C. There were weak positive correlations between N2O flux and soil temperature in both stands for all depths where soil temperature was recorded (Table 3). There were weak negative correlations between N2O flux and soil moisture, most significantly in the oak stand.
3.2. NO soil flux 20
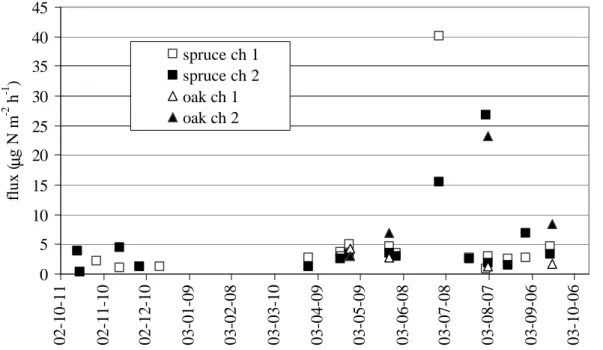
NO flux was small compared to fluxes of N2O (Fig. 2). Significant soil NO flux was observed only during the summer. Average NO fluxes were 5.0 and 6.4 µg N m−2h−1 for spruce and oak, respectively. Correlation between emission rates of the two gases was calculated for the two sites when emission data were available (n=20; Table 3).
BGD
2, 703–723, 2005
NO and NO2 emission from Hungarian
forest soils
L. Horv ´ath et al.
Title Page Abstract Introduction Conclusions References Tables Figures J I J I Back Close
Full Screen / Esc
Print Version Interactive Discussion
EGU
3.3. N-deposition
The total atmospheric N-deposition to the canopy, calculated as the sum of wet+ dry deposition, was estimated as 1.7 g N m−2yr−1 (Horv ´ath, 2004). Deposition to the soil was estimated from throughfall (TF) and stemflow (SF) measurements, and should equal N deposition to the canopy minus net canopy exchange (NCE). NCE was cal-5
culated to be 16% of total N deposition to the spruce forest canopy, and 6.5% for the oak forest. Though litter fall deposition is much higher than other deposition forms, it represents the internal circulation of N-compounds inside the canopy (Table 4). Emis-sion of NO and N2O together returns 10–13% of the atmospheric deposition to the soil
(TF+SF).
10
4. Discussion
Our results can be compared to those collected at 15 European forest sites as part of the EU-funded project NOFRETETE. The NOFRETETE locations represent different forest types (coniferous vs. deciduous) and span the typical nitrogen deposition rates found across Europe. In that survey (Pilegaard et al., 20051), NO emissions were 15
much greater (ca. 8 times) from coniferous forests than from deciduous forests, and N2O emission rates were slightly lower (ca. 2/3) for coniferous forests. While the total (NO+ N2O) emissions are much higher for European coniferous forests, in the current study there were no significant differences between the spruce and oak sites for flux rates of either NO or N2O, although the oak site had slightly higher mean flux rates. At 20
our Hungarian coniferous site the total (NO+N2O) mean soil emission is the half of the European average, and is roughly two times higher at our deciduous site compared to other European sites. This is a consequence of the depressed NO flux from our spruce soil and the enhanced N2O flux observed from the oak forest soil. Because NO is mainly derived from nitrification and N2O is mainly derived from denitrification, well 25
aerated soils should favor the production of NO whereas the presence of anaerobic 712
BGD
2, 703–723, 2005
NO and NO2 emission from Hungarian
forest soils
L. Horv ´ath et al.
Title Page Abstract Introduction Conclusions References Tables Figures J I J I Back Close
Full Screen / Esc
Print Version Interactive Discussion
EGU
microsites, due to thick litter layers or compaction, should favor N2O production. The lack of significant differences in flux rates from our two sites in this study might suggest that our soils are quite similar with respect to moisture regimes. It is also quite possible that the differences between conifer and deciduous sites observed in the larger survey are due to factors other than tree species, i.e. the primary factors that caused forest 5
stand differences in the first place, such as soil depth or temperature regime. Only further studies with paired conifer/deciduous stands can answer this question.
In our study, all gas flux rates were positively correlated with soil temperature and oak emission rates were negatively correlated with soil moisture. The positive correlation with soil temperature is not surprising, as many indices of soil microbial activity, such 10
as respiration, are positively related to temperature (Chen et al., 2000; Curiel Yuste et al., 2004; Franzluebbers et al., 2002; Sulzman et al., 2005). The negative correlation with soil moisture was surprising, as soil microbial processes are usually positively correlated with soil water, or other factors that control the supply of readily mineralizable substrates (Qi and Xu, 2001; Franzluebbers et al., 2002). Only when soil moisture 15
becomes too high does microbial respiration tend to decrease (Chen et al., 2000). This negative correlation suggests that our oak soils were wet enough that N2O production was decreasing, and perhaps N2emissions from denitrification were increasing.
The estimate of canopy uptake by foliage in these two stands was 16% and 6.5% of total inorganic N deposition for the spruce and oak sites, respectively. This is quite 20
low compared to results found for a variety of forests in the United States measured as part of the Integrated Forest Study (Lovett and Lindberg, 1993), where net canopy exchange was estimated to be about 40% of inorganic N deposition. These authors found a good correlation between NCE and total deposition, indicating that as de-position increases, N consumption in the canopy increases. There are many possible 25
explanations for this discrepancy, including variations in methodology for measuring to-tal N inputs. Alternatively, climatic differences and histories of N deposition to the sites may cause real differences in NCE among sites. The Hungarian forests in the cur-rent study have received chronic elevated N deposition for a longer period of time than
BGD
2, 703–723, 2005
NO and NO2 emission from Hungarian
forest soils
L. Horv ´ath et al.
Title Page Abstract Introduction Conclusions References Tables Figures J I J I Back Close
Full Screen / Esc
Print Version Interactive Discussion
EGU
have the US forests, and thus might be experiencing greater N saturation. Similarly, it is quite likely that chemical species of N in deposition, particularly in dry deposition, may be significantly different, and react differently on leaf surfaces. It is also possible that
NCE is variable from year to year. An earlier (1996–1998) study of atmospheric fluxes
in these same forests (Horv ´ath, 2004) measured higher N in wet deposition but lower 5
N in throughfall and produced a higher estimate of NCE, more similar to estimates in the Lovett and Lindberg (1993) survey. Throughfall deposition has been shown to be quite variable both spatially and temporally, and only long-term studies can address the variability of true NCE.
Comparing N deposition numbers and gas efflux values, we found that factoring 10
in NO and N2O emissions reduces the estimate of net N deposition to the canopy from 1.7 g N m−2yr−1 to 1.5–1.6 g N m−2yr−1, and thus does not affect this estimate significantly. We did not measure N2 emission from the soil, which can be significant especially at high moisture levels, and thus our estimates of N flux from the soil is an underestimate. Still, fluxes of NO and N2O were found to be a measurable portion of 15
N deposition to soil, which was estimated as 1.42 and 1.59 g N m−2yr−1for spruce and oak, respectively, and thus these soil gas emissions are around 10–13% of the total atmospheric N deposition to the soil. It is also important to note that while deposition to the soil is mostly as NH3/NH+4 and HNO3/NO−3, these compounds are transformed in the soil and can be emitted as a greenhouse gas (N2O) back into the atmosphere. 20
Thus, forest soils play a role in the transformation of deposited N compounds from regional or continental pollution sources into a greenhouse gas that acts at a global scale.
Acknowledgement. This research was coordinated and supported as part of the NOFRERETE EU5th RTD project (project coordinator K. Butterbach-Bahl) by Forschungszentrum Karlsruhe 25
Atmosph ¨arische Umweltforschung IMK-IFU Garmisch-Partenkirchen, Germany through the contract with the Forest Research Institute Budapest, Hungary, contract reference number: 315/20228934/IMK-IFU.
BGD
2, 703–723, 2005
NO and NO2 emission from Hungarian
forest soils
L. Horv ´ath et al.
Title Page Abstract Introduction Conclusions References Tables Figures J I J I Back Close
Full Screen / Esc
Print Version Interactive Discussion
EGU
References
Aber, J., McDowell, W., Nadelhoffer, K., Magill, A., Berntson, G., Kamakea, M., McNulty, S., Currie, W., Rustad, L., and Fernandez, I.: Nitrogen saturation in temperate forest ecosys-tems, BioScience, 48, 921–934, 1998.
Baron, J. S., Ojima, D. S., Holland, E. A., and Parton, W. J.: Analysis of nitrogen saturation po-5
tential in Rocky Mountain tundra and forest: implications for aquatic systems, Biogeochem., 27, 61–82, 1994.
Chen, H., Harmon, M. E., Griffiths, R. P., and Hicks, W.: Effects of temperature and moisture on carbon respired from decomposing woody roots, Forest Ecology and Management, 138, 51–64, 2000.
10
Christensen, S., Simkins, S., and Tiedje, J.M.: Spatial variation in denitrification: Dependency of activity centers on the soil environment, Soil Sci. So., 54, 1608–1613, 1990.
Christensen, S., Ambus, P., Arah, J. R. M., Clayton, H., Galle, B., Griffith, D. W. T., Hargreaves, K. J., Klemedtsson, L., Lind, A.-M., Maag, M., Scot, A., Skiba, U., Smith, K. A., Welling, M., and Wienhold, F. G.: Nitrous oxide emission from an agricultural field: comparison between 15
measurements by flux chamber and micro-meteorological techniques, Atmos. Envir., 30, 4183–4190, 1996.
Conen, F. and Smith, A.: An explanation of linear increases in gas concentration under closed chambers used to measure gas exchange between soil and the atmosphere, Eur. J. So. Sc., 51, 111–117, 2000.
20
Curiel Yuste, J., Janssens, I. A., Carrara, A., and Ceulemans, R.: Annual Q10of soil respiration
reflects plant phenological patterns as well as temperature sensitivity, Global Change Biol., 10, 161–169, 2004.
Dise, N. B., Matzner, E., and Gundersen, P.: Synthesis of nitrogen pools and fluxes from European forest ecosystems, Water, Air, Soil Pollut., 105, 143–154, 1998.
25
EMEP: EMEP co-operative programme for monitoring and evaluation of the long-range trans-mission of air pollutants in Europe. EMEP Manual for sampling and chemical analysis, EMEP/CCC-Report 1/95, NILU, Kjeller, Norway, 1996.
Ferm, M. and Hultberg, H.: Dry deposition and internal circulation of nitrogen, sulphur and base cations into a coniferous forest, Atmos. Envir., 33, 4421–4430, 1999.
30
Franzluebbers, K., Franzluebbers, A. J., and Jawson, M. D.: Environmental controls on soil and whole-ecosystem respiration from a tallgrass prairie, Soil Sci. Soc. Am. J., 66, 254–262,
BGD
2, 703–723, 2005
NO and NO2 emission from Hungarian
forest soils
L. Horv ´ath et al.
Title Page Abstract Introduction Conclusions References Tables Figures J I J I Back Close
Full Screen / Esc
Print Version Interactive Discussion
EGU
2002.
Groffman, P. M. and Tiedje, J. M.: Denitrification in north temperate forest soils: relationships between denitrification and environmental factors at the landscape scale, Soil Biol. Biochem., 21, 621–626, 1989.
Gundersen, P.: Nitrogen deposition and the forest nitrogen cycle: role of denitrification, Forest 5
Ecology and Management, 44, 15–28, 1991.
Henrich, M. and Haselwandter, K.: Denitrification and gaseous nitrogen losses from an acid spruce forest soil, Soil Biol. Biochem., 29, 1529–1537, 1997.
Horv ´ath, L.: Determination of the nitrogen compound balance between the atmosphere and a Norway spruce forest ecosystem, Nutr. Cycl. A., 70, 143–146, 2004.
10
Horv ´ath, L., Weidinger, T., Nagy, Z., and F ¨uhrer, E.: Measurement of dry deposition velocity of ozone, sulfur dioxide and nitrogen oxides above Pine forest and low vegetation in different seasons by the gradient method, in: Proceedings of EUROTRAC Symposium ‘96 Garmisch-Partenkirchen, edited by: Borrell, P. M., Borrell, P., Cvitas, T., Kelly, K., and Seiler, W., Ger-many, 25–29 March 1996, Computational Mechanics Publications, Southampton, 315–318, 15
1997.
Horv ´ath, L., Nagy, Z., and Weidinger, T.: Determination of the dry flux of ozone and sulfur dioxide during the TRACT campaign, Atmos. Environ., 32, 1317–1322, 1998.
Horv ´ath, L., M ´esz ´aros, R., Pinto, J. P., and Weidinger, T.: Estimate of the dry deposition of at-mospheric nitrogen and sulfur species to spruce forest, in: Proceedings of EUROTRAC Sym-20
posium 2000 Garmisch-Partenkirchen, edited by: Midgley, P. M., Reuther, M., and Williams, M., Germany, 27–31 March 2000, Springer-Verlag Berlin, Heidelberg, 2001.
Kov ´acs, E. A. and Horv ´ath. L.: Determination of sulfur balance between the atmosphere and a Norway spruce forest ecosystem: comparison of gradient dry+ wet and throughfall deposi-tion measurements, J. Atmos. Chem., 48, 235–240, 2004.
25
Lovett, G. M. and Lindberg, S. E.: Atmospheric deposition and canopy interactions of nitrogen in forests, Can. J. For. Res., 23, 1603–1616, 1993.
Meixner, F., Fickinger, Th., Marufu, L., Serca, D., Nathaus, F. J., Makina, E., Mukurumbira, L., and Andreae, M. O.: Preliminary results on nitric oxide emission from a southern African savanna ecosystem, Nutr. Cycl. A., 48, 123–138, 1997.
30
Myrold, D. D., Matson, P. A., and Peterson, D. L.: Relationships between soil microbial prop-erties and aboveground stand characteristics of conifer forests in Oregon, Biogeochem., 8, 265–281, 1989.
BGD
2, 703–723, 2005
NO and NO2 emission from Hungarian
forest soils
L. Horv ´ath et al.
Title Page Abstract Introduction Conclusions References Tables Figures J I J I Back Close
Full Screen / Esc
Print Version Interactive Discussion
EGU
Pilegaard, K. and the NOFRETETE Team: Nitrogen load and forest type determine soil emis-sion of nitrogen oxides (NO and N2O), Geophys. Res. Abstr., 6, No. 05693, 2004.
Pregitzer, K. S., Zak, D. R., Burton, A. J., Ashby, J., and MacDonald, N. W.: Chronic nitrate additions dramatically increase the export of carbon and nitrogen from northern hardwood ecosystems, Biogeochem., 68, 179–197, 2004.
5
Qi, Y. and Xu, M.: Separating the effects of moisture and temperature on soil CO2efflux in a coniferous forest in the Sierra Nevada mountains, Plant Soil, 237, 15–23, 2001.
Rayment, M. B.: Closed chamber systems underestimate soil CO2 efflux, Eur. J. So. Sc., 51, 107–110, 2000.
Seinfeld, J. H. and Pandis, S. N.: Atmospheric chemistry and physics: From air pollution to 10
climatic change, John Wiley and Sons Inc., New York, Chichester, Weinheim, Brisbane, Singapore, Toronto, 1998.
Sulzman, E. W., Brant, J. B., Bowden, R. D., and Lajtha, K.: Contribution of aboveground litter, belowground litter, and rhizosphere respiration to total soil CO2efflux in an old growth coniferous forest, Biogeochem., in press, 2005.
15
Vermes, J.-F. and Myrold, D. D.: Denitrification in forest soils of Oregon, Can. J. For. Res., 22, 504–512, 1992.
Weidinger, T., Pinto, J., and Horv ´ath, L.: Effects of uncertainties in universal functions, rough-ness length, and displacement height on the calculation of surface layer fluxes, Meteorolo-gische Zeitschrift 9, 139–154, 2000.
BGD
2, 703–723, 2005
NO and NO2 emission from Hungarian
forest soils
L. Horv ´ath et al.
Title Page Abstract Introduction Conclusions References Tables Figures J I J I Back Close
Full Screen / Esc
Print Version Interactive Discussion
EGU
Table 1. Stand and soil characteristics of the Norway spruce and Sessile oak stands used in this study (surveyed in 2000).
spruce oak
Stand density trees ha−1 1188 776
Stand height m 20.1 20.5
Mean breast diameter cm 20.1 22
Rooting depth m >1 >1
Soil type Eutric Leptosol Mollic Leptosol
Organic layer type moder/mull mull
Organic layer C stocks humus layer g C kg−1 236 144 Organic layer N stocks humus layer g N kg−1 12 9.3 Organic layer, C:N ratio humus layer 19.7 15.4
Organic layer, pH humus layer 4.5 5.7
Mineral soil, clay:silt:sand 0–10 cm % 15:29:56 17:38:45 Mineral soil, clay:silt:sand 10–20 cm % 18:31:51 20:42:38 Mineral soil, clay:silt:sand 20–40 cm % 21:26:53 25:38:37 Mineral soil, C stocks 0–5, 5–10, 10–20, 20–40 cm g C kg−1 55.2, 29.8, 15.1, 9.6 65.2, 36.5, 27.7, 22.7 Mineral soil, N stocks 0–5, 5–10, 10–20, 20–40 cm g N kg−1 4.3, 2.5, 1.2, 0.8 4.8, 3.1, 2.2, 2.0 Mineral soil, C:N ratio 0–5, 5–10, 10–20, 20–40 cm 12.9, 11.9, 12.2,12.0 13.5, 11.9, 12.4, 11.5 Mineral soil, pH 0–5, 5–10 cm 3.6, 3.9 4.7, 4.3
BGD
2, 703–723, 2005
NO and NO2 emission from Hungarian
forest soils
L. Horv ´ath et al.
Title Page Abstract Introduction Conclusions References Tables Figures J I J I Back Close
Full Screen / Esc
Print Version Interactive Discussion
EGU
Table 2. Monthly and yearly means of NO and N2O fluxes.
flux (µg N m−2h−1)
period spruce oak
NO N2O NO N2O October, 2002 0.94 35.2 n.a. 36.0 November, 2002 1.21 18.1 n.a. 4.7 December, 2002 0.63 2.6 n.a. 2.0 January, 2003 0∗∗ 3.7 n.a. 1.1 February, 2003 0∗∗ 0∗∗ n.a. 0∗∗ March, 2003 0∗∗ 0∗∗ n.a. 30.9 April, 2003 1.04 4.0 n.a. 5.7 May, 2003 1.17 11.3 3.10 16.8 June, 2003 0.99 14.9 2.13 28.6 July, 2003 5.66 22.5 n.a. 35.8 August, 2003 1.23 36.5 n.a. 48.9 September, 2003 1.59 28.2 1.31 32.8 mean 1.20 14.8 2.09∗ 20.3 ∗
Estimated from the ratio of spruce/oak fluxes from 3 months where data were available for both stations (mean of May, June, September for spruce: 1.25, for oak: 2.18, ratio=1.744)
∗∗
BGD
2, 703–723, 2005
NO and NO2 emission from Hungarian
forest soils
L. Horv ´ath et al.
Title Page Abstract Introduction Conclusions References Tables Figures J I J I Back Close
Full Screen / Esc
Print Version Interactive Discussion
EGU
Table 3. Correlation (r) of N2O flux with soil temperature and moisture and with NO flux. All relationships are significant at P=0.05. NS=not significant.
NO emission tsoil5 cm tsoil10 cm tsoil20 cm wsoil5 cm wsoil10 cm wsoil20 cm
spruce 0.40 0.45 0.67 0.67 NS
oak 0.66 0.64 0.72 −0.63 −0.68 −0.67
BGD
2, 703–723, 2005
NO and NO2 emission from Hungarian
forest soils
L. Horv ´ath et al.
Title Page Abstract Introduction Conclusions References Tables Figures J I J I Back Close
Full Screen / Esc
Print Version Interactive Discussion
EGU
Table 4. Atmospheric deposition and emission of nitrogen compounds at the spruce and oak stands.
Site Spruce Oak Spruce Oak Spruce Oak
Deposition (2001–2003) Nitrate (NO−3) Ammonium (NH+4) Total N (g N m−2yr−1)
Atmospheric wet deposition to the canopy (WD) 0.25 0.25 0.29 0.29 0.54 0.54 Atmospheric dry deposition to the canopy (DD)∗ 0.56 0.56 0.60 0.60 1.16 1.16 Throughfall deposition∗∗(TF) 0.49 0.31 0.85 1.01 1.34 1.32 Stemflow deposition∗∗(SF) 0.02 0.08 0.06 0.19 0.08 0.27 Atmospheric deposition to the soil (TF+SF) 0.51 0.39 0.91 1.20 1.42 1.59 Atmospheric dry deposition to the soil (TF+SF-WD=DD-NCE) 0.26 0.14 0.62 0.91 0.88 1.05
Net canopy exchange (NCE=WD+DD-TF-SF) 0.28 0.11
Total atmospheric deposition to the canopy (WD+DD=TF+SF+NCE) 1.70 1.70
NCE as % of total N deposition 16% 6.5%
Litter fall deposition∗∗(LF) 4.77 9.12
Total deposition to the soil (TF+SF+LF) 6.19 10.7
Emission Nitrous oxide (N2O) Nitric oxide (NO) Total N
soil emission (SE) 0.13 0.18 0.011 0.018 0.14 0.20
(g N m−2yr−1)
soil emission/atmospheric deposition to the soil (%) [100*SE/(TF+SF)] 10% 13%
∗
estimated from Horv ´ath (2004) following measurements between 1996–98 in spruce, assum-ing the same dry deposition rate for oak and spruce sites
∗∗
BGD
2, 703–723, 2005
NO and NO2 emission from Hungarian
forest soils
L. Horv ´ath et al.
Title Page Abstract Introduction Conclusions References Tables Figures J I J I Back Close
Full Screen / Esc
Print Version Interactive Discussion
EGU
15
Figure Captions
Fig. 1: N2O soil emission flux (mean of 8-8 chambers) error bars represent the 10% bulk error (CV)
of sampling and measurement
Fig. 2: NO soil emission flux measured by two chambers (ch1 and 2)
0 10 20 30 40 50 60 70 80 02-09-21 02-10-21 02-11-20 02-12-20 03-01-19 03-02-18 03-03-20 03-04-19 03-05-19 03-06-18 03-07-18 03-08-17 03-09-16 03-10-16 flux ( g N m -2 h -1 ) spruce oak
Fig. 1. N2O soil emission flux (mean of 8-8 chambers) error bars represent the 10% bulk error (CV) of sampling and measurement.
BGD
2, 703–723, 2005
NO and NO2 emission from Hungarian
forest soils
L. Horv ´ath et al.
Title Page Abstract Introduction Conclusions References Tables Figures J I J I Back Close
Full Screen / Esc
Print Version Interactive Discussion EGU 16 0 5 10 15 20 25 30 35 40 45 02-10-11 02-11-10 02-12-10 03-01-09 03-02-08 03-03-10 03-04-09 03-05-09 03-06-08 03-07-08 03-08-07 03-09-06 03-10-06 flux ( µ g N m -2 h -1 ) spruce ch 1 spruce ch 2 oak ch 1 oak ch 2
Fig. 2. NO soil emission flux measured by two chambers (ch1 and 2).