HAL Id: hal-01075366
https://hal.archives-ouvertes.fr/hal-01075366
Submitted on 17 Oct 2014
HAL is a multi-disciplinary open access
archive for the deposit and dissemination of
sci-entific research documents, whether they are
pub-lished or not. The documents may come from
teaching and research institutions in France or
abroad, or from public or private research centers.
L’archive ouverte pluridisciplinaire HAL, est
destinée au dépôt et à la diffusion de documents
scientifiques de niveau recherche, publiés ou non,
émanant des établissements d’enseignement et de
recherche français ou étrangers, des laboratoires
publics ou privés.
in 3D Face Gender Classification
Baiqiang Xia, Boulbaba Ben Amor, Mohamed Daoudi
To cite this version:
Baiqiang Xia, Boulbaba Ben Amor, Mohamed Daoudi. Exploring the Magnitude of Human Sexual
Di-morphism in 3D Face Gender Classification. International Workshop on Soft Biometrics, in conjuction
with ECCV’14, Sep 2014, Zurich, Switzerland. �hal-01075366�
Dimorphism in 3D Face Gender Classification
Baiqiang Xia2,3, Boulbaba Ben Amor1, and Mohamed Daoudi1
1: Institut Mines-T´el´ecom/T´el´ecom Lille, France.
2: University of Lille1, France. 3: LIFL (UMR CNRS 8022), France.
Abstract. Human faces demonstrate clear Sexual Dimorphism (SD) for recognizing the gender. Different faces, even of the same gender, convey different magnitude of sexual dimorphism. However, in gender classifica-tion, gender has been interpreted discretely as either male or female. The exact magnitude of the sexual dimorphism in each gender is ignored. In this paper, we propose to evaluate the SD magnitude, using the ratio of votes from the Random Forest algorithm performed on 3D geometric features related to the face morphology. Then, faces are separated into a Low-SD group and a High-SD group. In the Intra-group experiments, when the training is performed with scans of similar SD magnitude than the testing scan, the classification accuracy improves. In Inter-group ex-periments, the scans with low magnitude of SD demonstrate higher gen-der discrimination power than the ones with high SD magnitude. With a decision-level fusion method, our method achieves 97.46% gender clas-sification rate on the 466 earliest 3D scans of FRGCv2 (mainly neutral), and 97.18% on the whole FRGCv2 dataset (with expressions).
Keywords: 3D face, Gender Classification, Sexual Dimorphism, Ran-dom Forest
1
Introduction
Human faces exhibit clear sexual dimorphism (SD), in terms of masculinity and femininity [29], for recognizing their gender. In several anthropometry studies, researchers have concluded that male faces usually possess more prominent fea-tures than female faces [36, 6, 41, 18]. Automated gender classification has gradu-ally developed as an active research area, sine 1990s. Abundant works have been published, concerning (i) different face modalities (2D texture images or 3D scans), (ii) different face descriptions (2D pixels, 3D point cloud, or more com-plex features like LBP, AAM, wavelets, etc.), and (iii) different classifiers (Ran-dom Forest, SVM, Adaboost, etc.). Earlier gender classification works mainly focused on 2D texture of faces. Recently, 3D face-based gender classification has been investigated in several studies [25, 12, 33, 37, 11, 38] and has demonstrated its benefits compared to 2D face-based approaches. Compared to 2D face images, the 3D scans have better robustness to illumination and pose changes. Also, the 3D face scans are able to capture complete information of the facial shape.
The first work of 3D-based gender classification is proposed by Liu and Palmer in [25]. Considering the human faces are approximately symmetric, they extract features from the height and orientation differences on symmetric facial points from 101 full 3D face models. Using LDA outputs, they achieve 91.16% and 96.22% gender recognition rate considering the height and orientation dif-ferences, respectively. In [12], Vignali et al. use the 3D coordinates of 436 face landmark points as features, and achieve 95% classification rate on 120 3D scans with LDA classifier. Considering the statistical differences shown in facial fea-tures between male and female, such as in the hairline, forehead, eyebrows, eyes, cheeks, nose, mouth, chin, jaw, neck, skin, beard regions [10], Han et al. ex-tract geometric features with the volume and area information of faces regions [13]. They achieve 82.56% classification rate on 61 frontal 3D face meshes of GavabDB database, with the RBF-SVM classifier in 5-fold cross validation. In [15], Hu et al. divide each face into four regions in feature extraction, and find that the upper face is the most discriminating for gender. The classification rate reported is 94.3% with SVM classifier, on 945 3D neutral face scans. In [2], Ballihi et al. extract radial and iso-level curves and use a Riemannian shape analysis approach to compute lengths of geodesics between facial curves from a given face to the Male and Female templates computed using the Karcher Mean algorithm. With a selected subset of facial curves, they obtain 86.05% gender classification rate with Adaboost, in 10-fold cross-validation on the 466 earli-est scans of FRGCv2 dataset. In [33], Toderici et al. obtain features with the wavelets and the MDS (Multi Dimensional Scaling). Experiments are carried out on the FRGCv2 dataset in 10-fold subject-independent cross validation. With polynomial kernel SVM, they achieved 93% gender classification rate with the unsupervised MDS approach, and 94% classification rate with the wavelets-based approach. In [11], Gilani et al. automatically detect the biologically significant facial landmarks and calculate the euclidean and geodesic distances between them as facial features. The minimal-Redundancy-Maximal-Relevance (mRMR) algorithm is performed for feature selection. In a 10-fold cross-validation with a LDA classifier, they achieve 96.12% gender classification rate on the FRGCv2 dataset, and 97.05% on the 466 earliest scans. Combining shape and texture, in [26], Lu et al. fuse the posterior probabilities generated from range and in-tensity images using SVM. In [19], Huynh et al. fuse the Gradient-LBP from range image and the Uniform LBP features from the gray image. In [34], Wang et al. fuse the results of gender classification from 8 facial regions, and achieve 93.7% gender classification rate on the FRGCv2 dataset, using both the range and texture data. In [35], Wu et al. combine shape and texture implicitly with needle maps recovered from intensity images. More recently, in [17], Huang et al. propose to use both boosted local texture and shape features for gender and ethnicity classification. The local circular patterns (LCP) are used to compute the facial features. Then a boosting strategy is employed to highlight the most discriminating gender- and race-related features. Their method achieve 95.5% correct gender classification rate on a subset of FRGCv2 dataset using 10-fold cross validation.
In subjective experiments conducted in [16], the authors reported that hu-man observers perform better on gender recognition with 3D scans than with 2D images. The study presented in [14] also confirms that, for gender classifica-tion, the usage of 2D images is limited to frontal views, while the 3D scans are adaptable to non-frontal facial poses. Despite the achievements of 3D face-based gender classification, the majority of related works have interpreted gender dis-cretely as either male or female. To our knowledge, no work gives consideration to the fact that, even faces with the same gender can have different magnitude of sexual dimorphism. Thus, other than viewing faces equally as definitely male or female, we propose to evaluate the magnitude of sexual dimorphism first, and then explore the usage of this magnitude for gender classification. The rest of this paper is organized as following: in section 2, we present the adopted feature extraction procedure for 3D faces and emphasize our contribution; in section 3, we detail our gender classification method, including the Random Forest clas-sifier and the evaluation protocols; experimental results and discussions are in section 4; section 5 makes the conclusions.
2
Methodology and Contributions
In face perception, researchers have revealed that facial sexual dimorphism re-lates closely with the anthropometric cues, such as the facial distinctiveness (the converse to averageness) [3], and the bilateral asymmetry [23]. The average-ness of the face and its symmetry serve as covariants in judging the perceived health of potential mates in sexual selection [30, 28, 24], and also the attractive-ness of face [22, 20]. As stated earlier, the male faces usuallye Statistics on head and face of American and Chinese adults reported in [39, 40, 9] have also con-firmed this point. Concerning the face symmetry, in [23], Little et al. reveal that the symmetry and sexual dimorphism from faces are related in humans, and sug-gest that they are biologically linked during face development. In [32], Steven et al. find that the masculinization of the face significantly covaries with the fluctuating asymmetry in men’s face and body. In addition to facial averageness and symmetry, the global spatiality and local gradient relates closely with sexual dimorphism in the face. As demonstrated in [39, 40], the sexual dimor-phism exhibits inequally in magnitude in different spatial parts of the face. Also, sexual dimprphism demonstrates the developmental stability [24] in faces. It re-lates closely to the shape gradient which represents the local face consistency. Thus, considering sexual dimorphism is closely related to these morphological cues of the face, we explore the use of four descriptions based on the recently-developed Dense Scalar Field (DSF) [8, 4]. Our facial descriptions quantify and reflect the averageness (3D-avg.), the bilateral symmetry (3D-sym.), the local changes (3D-grad.), and the global structural changes (3D-spat.) of the 3D face. Recall that the extraction of the DSFs features is based on a Riemannian shape analysis of elastic radial facial curves. They are designed to capture densely the shape deformation, in a vertex-level. They were first proposed in [4, 8] for
fa-cial expression recognition from dynamic fafa-cial sequences. The extraction of the proposed descriptors is detailed in the following.
2.1 Feature Extraction Methodology
At first, the 3D scans are pre-processed to define the facial surface (remove noise, fill holes, etc.) and limit the facial region (remove hair, etc.). Then, a set of radial curves stemming from the automatically detected nose-tip of each scan are extracted with equal angular interpolation, α ∈ [0, 2π]. The radial curve that makes an clockwise angle of α with the middle-up radial curve which passes through the center of the nose and the forehead is denoted as βα. Given
a facial surface S, it results in S ≈ ∪αβα. Then, with the Square-Root Velocity
Function (SRVF) representation introduced in [31], an elastic shape analysis of these curves is performed.
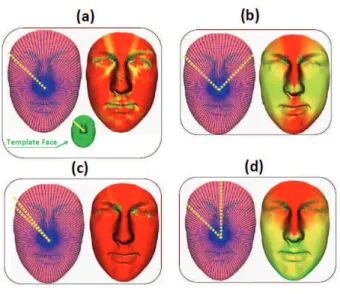
Fig. 1.Illustrations of different features on 3D shape of the preprocessed face. (a) the 3D-avg. description: the DSF from radial curve in a preprocessed face to the radial curve in face template with the same index; (b) the 3D-sym. description: the DSF from symmetrical radial curves. (c) the 3D-grad. description: DSF from a pair of neighboring radial curves. (d) the 3D-spat. description: DSF from each radial curve to the middle-up radial curve which passes through the middle of the nose and the forehead.
More formally, considering a given facial curve as a continuous parametrized function β(t) ∈ R3, t ∈ [0, 1]. β is represented by its Square-Root Velocity Func-tion SRVF, q, according to :
q(t) = ˙β(t)/ q
k ˙β(t)k, t ∈ [0, 1]. (1) Then with its L2-norm kq(t)k scaled to 1, the space of such functions: C =
{q : [0, 1] → R3, kqk = 1} becomes a Riemannian manifold and has a spherical structure in the Hilbert space L2([0, 1], R3). Given two curves β
1 and β2
repre-sented as q1 and q2 on the manifold, the geodesic path between q1, q2 is given
by the minor arc of the great circle connecting them on the Hypersphere [7]. To capture densely the shape deformation between the curves q1 and q2, the
shooting vector Vq17→q2 (tangent vector to C on q1, and also an element of the
tangent space on q1 to the manifold C, Tq1(C)), is used. This vector represent
the shooting direction along the geodesic connecting q1 and q2. Knowing that,
the covariant derivative of the tangent vector field on geodesic path is equal to 0 (i.e. a geodesic corresponds to a constant velocity path on the manifold), this shooting vector characterizes the geodesic path. Here again, due to the spherical structure of C, the shooting vector Vq17→q2 is given by:
Vq17→q2 = θ sin(θ)(q ∗ 2− cos(θ)q1), Vq17→q2 ∈ Tq1(C). (2) where q∗
2 ∈ [q2] (element of the orbit of the shape q2) denote the closest
shape in [q2] to q1 with respect to the metric dC. The shape q2∗ is given by
q∗
2 = p ˙γ∗O∗q2(γ∗), where γ∗ is the optimal reparametrization that achieved
the best matching between q1and q2and O∗gives the optimal rotation to align
them. The angle θ = cos−1 hq
1, q2∗i, denotes the angle between q1 and q2∗ (we
refer the reader to [7] for further details on elastic shape analysis of facial radial curves). Recall that, shapes correspondence is an essential ingredient in shape analysis to find the efficient way to deform one shape into another. The elastic shape analysis framework used here achieves accurate dense correspondence and returns the optimal deformation from one shape into another.
With the magnitude of Vq17→q2 computed at N indexed points of q1 and q2,
the Dense Scalar Field (DSF), DSF = {kVα(k)k, k = 1, 2, 3, .., N }) is built. It
quantifies the shape difference between two curves at each point. Using this geometric deformation between pairwise curves on the face, we derive four dif-ferent facial descriptions which reflect difdif-ferent morphological cues, as described earlier, which are the face averageness, symmetry, local shape changes (termed gradient) and the global spatial changes (termed spatial). The extracted DSF features are illustrated in Fig. 1. In each sub-figure of Fig. 1, the left part illus-trates the extracted radial curves and the curve comparison strategy, the right part shows the DSF features as color-map on the face. On each face point, the warmer the color, the lower the deformation magnitude. The 3D-avg. descrip-tion shown in Fig. 1 (a) compares a pair of curves with the same angle from a preprocessed face and an template face. The average face template (presented in Fig. 1 (a)) is defined as the middle point of geodesic from a representative male
face to a representative female face. The 3D-sym. description shown in Fig. 1 (b) captures densely the deformation between bilateral symmetrical curves. This description allows to study the facial changes in terms of bilateral sym-metry. The 3D-grad. description shown in Fig. 1 (c) captures the deformation between pairwise neighboring curves. The idea behind is to approximate a local derivation or the gradient. The 3D-spat. description shown in Fig. 1 (d) cap-tures the deformation of a curve to the middle-up curve, emanating from the nose tip and passing vertically through the nose and the forehead. As the middle-up curve locates at the most rigid part of the face, this description captures the spatial changes from the most rigid facial part in the face. We emphasize that, although all these descriptions are based on the same mathematical background, they relate to significantly different morphology cues of face shape.
2.2 Contributions
With the designed facial descriptions, we perform gender classification experi-ments with the Random Forest classifier. We propose to first evaluate the mag-nitude of sexual dimorphism of a face, then explore this magmag-nitude in gender classification. In summary, we have made the following contributions:
– First, rather than taking a face as definitely male or female, we propose to evaluate its magnitude of sexual dimorphism using the ratio of votes from effective random forest based gender classification approach. To our knowledge, this is the first time in the literature of gender classification that gives consideration to the sexual dimorphism difference.
– Second, according to the magnitude of sexual dimorphism, we separate the instances into High-SD and Low-SD groups. With the Intra-group gender classification experiments performed within each group, we find out that the gender of instances are more accurately classified with the training instances which have similar sexual dimorphism.
– Third, in the Inter-group experiments, we demonstrate that the gender clas-sification algorithm trained on Low-SD instances has good generalization ability on the High-SD instances, while the inverse is not true. It means that the instances with low magnitude of sexual dimorphism tell more accu-rately the discriminating cues of gender. When training only on the Low-SD instances, the classification results are even better than training on all in-stances.
– Last, with a decision-level fusion method performed on the results from four descriptions, we achieve 97.46% gender classification rate on the 466 earliest 3D scans of FRGCv2, and 97.18% on the whole FRGCv2 dataset.
In the next, we detail the experiments conducted for gender classification.
3
Gender Classification Experiments
We use Random Forest classifier on the DSFs features for Gender classification. The Random Forest is an ensemble learning method that grows many decision
trees t ∈ {t1, .., tT} for an attribute [5]. In growing of each tree, a number of
N instances are sampled randomly with replacement from the data pool. Then a constant number of variables are randomly selected at each node of the tree, with which the node makes further splitting. This process goes on until the new nodes are totally purified in label. To classify a new instance, each tree gives a prediction and the forest makes the overall decision by majority voting. Thus, associated to each forest decision, there is always a score in the range of [50%,100%], which indicates the ratio of trees voting for this decision. This ratio shows the confidence of the decision.
Our experiments are carried out on the Face Recognition Grand Challenge 2.0 (FRGCv2) dataset [27], which contains 4007 3D near-frontal face scans of 466 subjects. There are 1848 scans of 203 female subjects, and 2159 scans of 265 male subjects. Following the literature [37, 11, 38, 2, 34], we conducted two experiments: the Expression-Dependent experiment uses the 466 earliest scans of each subject in FRGCv2, for which the majority have neutral expression. The Expression-Independent experiments use the whole scans of FRGCv2 dataset, for which about 40% are expressive. These settings are designed to test the effectiveness of gender recognition algorithm, and its robustness against facial expressions. Under the Expression-Dependent setting, we use directly our DSFs features. Whereas, under the Expression-Independent setting, we first reduce the original DSF features into a salient subset using the Correlation-based Fea-ture Selection (CFS)algorithm [1], to make feasible the evaluation on the whole dataset. The CFS belongs to the the filters, which select features with heuristics based on general characteristics of features. They are independent of learning algorithm and are generally much faster [21], compared with another school of feature selection methods, the wrappers. After Feature selection, we retain only 200-400 features for each description.
3.1 Leave-One-Person-Out (LOPO) gender classification
First, for both the Expression-Dependent and the Expression-Independent set-tings, we follow the Leave-One-Person-Out (LOPO) cross-validation with 100-tree Random Forest with each type of DSFs descriptions. Under the LOPO protocol, each time one subject is used for testing, with the remaining subjects used for training. No subject appears both in traning and in testing in the same round. The experimental results are reported in Table 1. For each DSF descrip-tion, under the Expression-Dependent setting, the gender classification rate is always > 84%. With the selected DSFs features in the Expression-Independent setting, the gender classification rate is always > 85%. Generally speaking, these results demonstrate the relevance of using the 3D geometry (shape) of the face, in particular the morphological cues, for the gender classification task. The best classification rates is achieved by the 3D-avg. description, which quantifies the shape divergence to a face template.
Despite the effectiveness of the previous descriptions, the gender of the train-ing and testtrain-ing instances had been interpreted discretely as either male or female during the experiments. Labeling a male or female only represents the dominant
Table 1.Expression-Dependent Gender classification Results Experiment/Description 3D-avg. 3D-sym. 3D-grad. 3D-spat. # of Scans
Expression-Dependent 89.06% 87.77% 85.62% 84.12% 466 Expression-Independent 91.21% 90.49% 85.29% 87.79% 4005
tendency of facial sexual dimorphism, which is masculinity or femininity. The varying magnitude of facial sexual dimorphism, especially in the same gender class, is ignored. Different male faces can have different magnitude of masculin-ity. Also, different female faces can have different magnitude of femininmasculin-ity. Thus, in our work, we propose to evaluate the magnitude of facial sexual dimorphism in gender classification, using the ratio of votes from Random Forest in the LOPO experiments. Recall that, in the Random Forest, the overall decision is made by majority voting of its decision trees. The ratio of votes signifies the confidence of the forest decision. In our case, the ratio of votes actually is interpreted as the magnitude of sexual dimorphism, in a statistical way. As in the forest, each tree is acting as an evaluator of the sexual dimorphism in the testing instance. The ratio of votes thus represents the statistical evaluation of the testing instance of the whole forest. Moreover, since the results shown in Table. 1 have demon-strated the effectiveness of the forests in gender classification, which means that the ratio of votes signifies well the sexual dimorphism. This is similar to human based gender evaluation. When a group of people are evaluating the same face, the more people voting for a gender (male or female), the higher the magnitude of sexual dimorphism exhibiting in the evaluated face (masculinity or femininity). The only underlying pre-condition is that, human observers have good accuracy in gender classification. Similarly, the only requirement of using the ratio of votes in random forest as evaluation of sexual dimorphism is that, the trees should be relevant to gender discrimination. This has already been justified by the effective results in Table. 1. Thus, we use the ratio of votes to indicate the magnitude of the dominant sexual dimorphism in a face. For example, if a scan is classified as male (or female) with 70% trees voting for it, we note it as having a magnitude of 0.7 in masculinity (or femininity). In our case, the ratio of votes, which signifies the magnitude of sexual dimorphism, is always in the range of [0.5, 1.0].
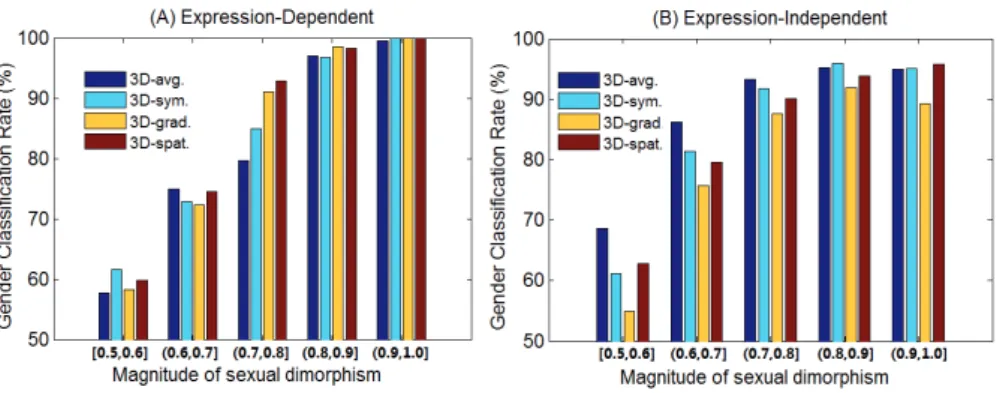
In Fig. 2, we show the relationship between gender classification accuracy and the magnitude of sexual dimorphism in testing scans for both Expression-Dependent and Expression-Independent experiments. The magnitude of sexual dimorphism is divided into five equally spaced groups, and shown in the x-axis of each subplot of Fig. 2. The corresponding recognition rates in each description are shown as color-bars in y-axis. As shown in Fig. 2 (A), under the Expression-Dependent setting, the higher the magnitude of sexual dimorphism in testing scans, the higher the gender classification accuracy in each description. When the SD magnitude is as low as [0.5,0.6], the classification rate is only about 60%. The rate increases to 72%-75% when SD magnitude is within (0.6,0.7]. The classification rate reaches 79%-92% when the SD magnitude is (0.7,0.8]. Finally, when the SD magnitude is > 0.8, the accuracy reaches 97%-100%. The
Fig. 2.Gender classification rates with different magnitude of sexual dimorphism
results under the Expression-Independent setting, shown in Fig. 2 (B), confirms these observations that the higher the SD magnitude in scans, the higher the gender classification accuracy in each description. The gender classification rate is very low when the SD magnitude is < 0.6. When the SD magnitude increases to > 0.8, the classification rate reaches as high as > 90%. The observation from Fig. 2 under both settings matches the simple intuition that the lower the sexual dimorphism in a face, the harder for classifying its gender.
3.2 Intra-group and Inter-group experiments
Results from Fig. 2 also show that the gender classification algorithm trained on general scans performs poorly when the testing scans have very low magnitude of sexual dimorphism. Thus, for both the experimental settings, we propose to sep-arate the scans into a High-SD group and a Low-SD group in each description, according to the magnitude of sexual dimorphism evaluated in the corresponding LOPO experiments with the concerning description. The High-SD group com-prises of instances with the magnitude of sexual dimorphism evaluated higher than 0.8. The Low-SD group is formed by instances with the magnitude of sexual dimorphism evaluated ≤ 0.8. With Fig. 2, it is clear that the accuracy differs in the two groups of each description. After this, we design two types of ex-periments, the Intra-group experiments and the Inter-group experiments. In the Intra-group experiments, we perform LOPO experiments on each group of each description. This type of experiments are designed to reveal that, for a testing scan, whether using scans with similar sexual dimprphism magnitude in training can determine more accurately its gender. In the Inter-group experiments, we train and test with different groups. Each group is used twice, once as training and once as testing. This type of experiments are aiming at testing the cross group ability of the gender classification algorithm trained on a specific group.
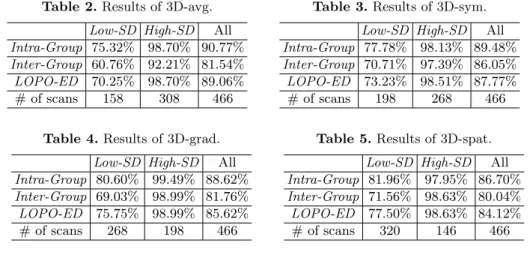
In Table 2 - 5, we show the results under the Intra-group and the Inter-group experiments with the Expression-Dependent settings, for each face description. In each table, the first row shows the testing data, and the first column indicates
the experimental setting. For each group, the number of scans is shown in the last row of the table. Results from the previous LOPO experiments on the 466 scans are also presented in each table, labeled as LOPO-ED. In Table 2 - 5, we observe that, First, the results from the Intra-group experiments always outperform the results from LOPO experiments, further it outperforms the results from the Inter-group experiments. It reveals that faces with similar magnitude of sexual dimorphism can determine more accurately the gender of each other. It is a better gender classification strategy to train and test within scans of similar sexual dimorphism magnitude. Second, when training with the Low-SD group, the testing results on the High-SD group are always effective (> 90%), but the inverse is not true. The algorithm trained on the Low-SD instances has good generalization ability on the High-SD instances. It means that the Low-SD instances contains more discriminating cues of the gender. Taking the first two diagonal elements of each table, we can generate also the results for each description when training with only the Low-SD instances. Following this, our approach achieved 86.48% with the avg. description, 89.06% using the 3D-sym. description, 88.41% based the 3D-grad. description, and 87.18% with the 3D-spat. description. Except the 3D-avg. description, these results outperform significantly the corresponding LOPO experiments and are comparable to the Intra-group experiment results shown in Table 3 - 5. It means that with only the Low-SD instances in training, we can achieve better results than with all the scans in training. The Low-SD instances should have higher priority to be selected for training, than the High-SD ones.
Table 2.Results of 3D-avg. Low-SD High-SD All Intra-Group 75.32% 98.70% 90.77% Inter-Group 60.76% 92.21% 81.54% LOPO-ED 70.25% 98.70% 89.06% # of scans 158 308 466
Table 3.Results of 3D-sym. Low-SD High-SD All Intra-Group 77.78% 98.13% 89.48% Inter-Group 70.71% 97.39% 86.05% LOPO-ED 73.23% 98.51% 87.77% # of scans 198 268 466
Table 4.Results of 3D-grad. Low-SD High-SD All Intra-Group 80.60% 99.49% 88.62% Inter-Group 69.03% 98.99% 81.76% LOPO-ED 75.75% 98.99% 85.62% # of scans 268 198 466
Table 5.Results of 3D-spat. Low-SD High-SD All Intra-Group 81.96% 97.95% 86.70% Inter-Group 71.56% 98.63% 80.04% LOPO-ED 77.50% 98.63% 84.12% # of scans 320 146 466
In parallel, we also performed the Intra-group experiments and the Inter-group experiments under the Expression-Independent setting on the whole FRGCv2 dataset. The results are shown in Tables 6 - 9. Similarly, the results from LOPO experiments on the 4005 scans are also shown in each table, labeled as LOPO-EI. They show, again, that the Intra-group experiments always outperform the results from LOPO experiments on the whole FRGCv2, further outperform the
results from the Inter-group experiments. It confirms that faces with similar magnitude of sexual dimorphism can determine more accurately the gender of each other, and it is better gender classification strategy to train and test within scans of similar sexual dimorphism magnitude. When training with the Low-SD group, the testing results on the High-Low-SD group are again always effective (> 95%) in each description, but the inverse is not. It confirms the previous finding that the algorithm trained on the Low-SD instances has very generaliza-tion ability on the High-SD instances, and the Low-SD instances contain more accurately the discriminating cues of gender. When taking only the Low-SD in-stances in training, we achieve 92.78% in the 3D-avg. description, 90.29% in the 3D-sym. description, 88.07% in the 3D-grad. description, and 87.32% in the 3D-spat. description. These results are very close to the Intra-group experiment results, and most of them outperform the corresponding LOPO experiments, as shown in Table 6 - 9. It confirms that, with the Low-SD instances in training, we can achieve better results than with all the scans in training.
Table 6.Results of 3D-avg. Low-SD High-SD All Intra-Group 79.03% 98.31% 92.96% Inter-Group 68.05% 98.06% 89.74% LOPO-EI 72.55% 98.38% 91.21% # of scans 1111 2894 4005
Table 7.Results of 3D-sym. Low-SD High-SD All Intra-Group 75.89% 97.43% 90.76% Inter-Group 70.16% 96.75% 88.51% LOPO-EI 75.00% 97.43% 90.49% # of scans 1240 2765 4005
Table 8.Results of 3D-grad. Low-SD High-SD All Intra-Group 79.04% 97.38% 86.72% Inter-Group 69.07% 97.20% 80.85% LOPO-EI 76.50% 97.50% 85.29% # of scans 2014 1991 4005
Table 9.Results of 3D-spat. Low-SD High-SD All Intra-Group 79.39% 98.24% 88.76% Inter-Group 73.63% 97.74% 85.62% LOPO-EI 77.46% 98.24% 87.79% # of scans 2328 1687 4005
3.3 Decision-level fusion for gender classification
As noted before, the four face descriptions reflect different perspectives for sex-ual dimorphism. All of them have demonstrated good competence in face gender classification. Thus, we explore in this section their fusion in gender classifica-tion. Following the idea that the higher the magnitude of sexual dimorphism, the higher the accuracy in gender classification, we propose to take the pre-dicted label with the highest magnitude of sexual dimorphism given by the four descriptions in the Intra-Group experiments. In practice, this is equal to take the label which is associated with the highest ratio of votes among the predicted labeled given by each of the four description with the Random Forest classifier. With this fusion strategy, our method achieved 97.42% gender classification rate
on the 466 earliest scans, and 97.18% gender classification rate on the whole FRGCv2 dataset. The details of these fusion results are shown in Fig. 3.
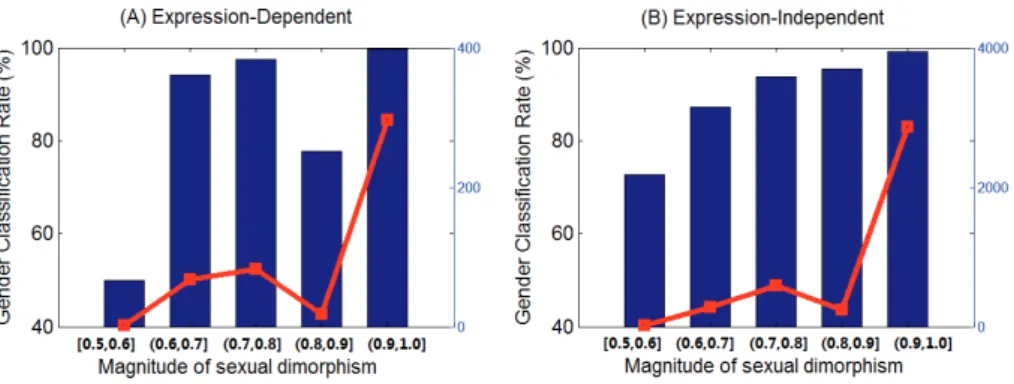
Fig. 3.Fusion details concerning different magnitude of sexual dimorphism
In each subplot of Fig. 3, the x-axis shows magnitude of sexual dimorphism. The blue bars show the gender classification rate (corresponds to the left-side y-axis), and the red line shows the number of instances (corresponds to the right-side y-axis). As shown in Fig. 3 (A), under the Expression-Dependent setting, the magnitude of sexual dimorphism for more than 60% instances (296 in 466) is greater than 0.9 in the fusion. The corresponding gender classification rate reaches 99.67%. Under the Expression-Independent setting, as shown in Fig. 3 (B), the magnitude of sexual dimorphism for more than 70% instances (2861 in 4005) is greater than 0.9 in the fusion. The corresponding gender classification rate reaches 99.2%. These results explain largely for the improvements of results in fusion. Also, the fusion significantly improves the classification accuracy in the instances with low sexual dimorphism magnitude under both experimen-tal settings, especially when the instances are evaluated as (0.6,0.8] in sexual dimorphism magnitude in fusion.
4
Conlusion
In this work, we have proposed to use the ratio of votes from Random Forest to evaluate the sexual dimorphism of face instances. Four facial description designed to capture different perspectives of the facial morphology are built based on an elastic shape analysis of facial curves. We have discovered that instances with similar sexual dimorphism magnitude can determine more accurately the gender of each other in gender classification. Moreover, we reveal that the face instances with low magnitude of sexual dimorphism can tell more accurately the discriminating cues of gender. The gender classification algorithm trained with these instances have good generalization ability for gender classification of instances with high magnitude of sexual dimorphism, while the inverse is not.
When training only on the instances with low magnitude of sexual dimorphism, better results can be achieved than training generally on all the instances. We also propose a decision-level fusion method, with which we achieve 97.46% gender classification rate on the 466 earliest scans of FRGCv2, and 97.18% on the whole FRGCv2 dataset.
References
1. A.H., M.: Correlation-based feature subset selection for machine learning. In: PhD thesis, Department of Computer Science, University of Waikato (1999)
2. Ballihi, L., Ben Amor, B., Daoudi, M., Srivastava, A., Aboutajdine, D.: Boosting 3D-geometric features for efficient face recognition and gender classification. In: IEEE Transactions on Information Forensics and Security. vol. 7, pp. 1766–1779 (2012)
3. Baudouin, J.Y., Gallay, M.: Is face distinctiveness gender based? Journal of Ex-perimental Psychology: Human Perception and Performance 32(4), 789 (2006) 4. Ben Amor, B., Drira, H., Berretti, S., Daoudi, M., Srivastava, A.: 4d facial
ex-pression recognition by learning geometric deformations. In: IEEE Transactions on Cybernetics (Feb 2014)
5. Breiman, L.: Random forests. In: Mach. Learn. vol. 45, pp. 5–32 (oct 2001) 6. Bruce, V., Burton, A.M., Hanna, E., Healey, P., Mason, O., Coombes, A., Fright,
R., Linney, A.: Sex discrimination: How do we tell the difference between male and female faces? In: Perception. vol. 22(2), pp. 131–152 (1993)
7. Drira, H., Ben Amor, B., Srivastava, A., Daoudi, M., Slama, R.: 3d face recogni-tion under expressions, occlusions, and pose variarecogni-tions. In: IEEE Transacrecogni-tions on Pattern Analysis and Machine Intelligence. vol. 35, pp. 2270–2283 (2013)
8. Drira, H., Ben Amor, B., Daoudi, M., Srivastava, A., Berretti, S.: 3d dynamic expression recognition based on a novel deformation vector field and random forest. In: Pattern Recognition (ICPR), 2012 21st International Conference on. pp. 1104– 1107. IEEE (2012)
9. Du, L., Zhuang, Z., Guan, H., Xing, J., Tang, X., Wang, L., Wang, Z., Wang, H., Liu, Y., Su, W., et al.: Head-and-face anthropometric survey of chinese workers. Annals of occupational hygiene 52(8), 773–782 (2008)
10. Geng, X., Zhou, Z.H., Smith-Miles, K.: Automatic age estimation based on facial aging patterns. In: IEEE Transactions on Pattern Analysis and Machine Intelli-gence. vol. 29, pp. 2234–2240 (2007)
11. Gilani, S.Z., Shafait, F., Ajmal, M.: Biologically significant facial landmarks: How significant are they for gender classification? In: DICTA. pp. 1–8 (2013)
12. Guillaume, V., Harold, H., Eric, V.B.: Linking the structure and perception of 3d faces: Gender, ethnicity ,and expressive posture. In: International Conference on Audio-Visual Speech Processing (AVSP) (2003)
13. Han, X., Ugail, H., Palmer, I.: Gender classification based on 3D face geometry features using svm. In: CyberWorlds. pp. 114–118 (2009)
14. Hill, H., Bruce, V., Akamatsu, S.: Perceiving the sex and race of faces: The role of shape and colour. In: Proceedings Of The Royal Society Of London Series B Biological Sciences. vol. 261(1362), pp. 367–373 (1995)
15. Hu, Y., Yan, J., Shi, P.: A fusion-based method for 3D facial gender classification. In: Computer and Automation Engineering (ICCAE). vol. 5, pp. 369–372 (2010)
16. Hu, Y., Fu, Y., Tariq, U., Huang, T.: Subjective experiments on gender and eth-nicity recognition from different face representations. In: Advances in Multimedia Modeling. vol. 5916, pp. 66–75 (2010)
17. Huang, D., Ding, H., Wang, C., Wang, Y., Zhang, G., Chen, L.: Local circular pat-terns for multi-modal facial gender and ethnicity classification. Image and Vision Computing (0), – (2014)
18. Hunter, W.S., Garn, S.M.: Disproportionate sexual dimorphism in the human face. American Journal of Physical Anthropology 36(1), 133–138 (1972)
19. Huynh, T., Min, R., Dugelay, J.: An efficient lbp-based descriptor for facial depth images applied to gender recognition using rgb-d face data. In: ACCV 2012, Work-shop on Computer Vision with Local Binary Pattern Variants (2012)
20. Jones, B.C., DeBruine, L.M., Little, A.C.: The role of symmetry in attraction to average faces. Perception & psychophysics 69(8), 1273–1277 (2007)
21. Kohavi, R.: Wrappers for performance enhancement and oblivious decision graphs. In: PhD thesis, Stanford University (1995)
22. Komori, M., Kawamura, S., Ishihara, S.: Effect of averageness and sexual dimor-phism on the judgment of facial attractiveness. Vision Research 49(8), 862 – 869 (2009)
23. Little, A., Jones, B., Waitt, C., Tiddeman, B., Feinberg, D., Perrett, D., Apicella, C., Marlowe, F.: Symmetry is related to sexual dimorphism in faces: data across culture and species. PLoS One 3(5), e2106 (2008)
24. Little, A.C., Jones, B.C., DeBruine, L.M., Feinberg, D.R.: Symmetry and sexual dimorphism in human faces: interrelated preferences suggest both signal quality. Behavioral Ecology 19(4), 902–908 (2008)
25. Liu, Y., Palmer, J.: A quantified study of facial asymmetry in 3D faces. In: Analysis and Modeling of Faces and Gestures. pp. 222–229 (2003)
26. Lu, X., Chen, H., Jain, A.K.: Multimodal facial gender and ethnicity identification. In: International conference on Advances in Biometrics. pp. 554–561 (2006) 27. Phillips, P., Flynn, P., Scruggs, T., Bowyer, K., Chang, J., Hoffman, K.,
Mar-ques, J., Min, J., Worek, W.: Overview of the face recognition grand challenge. In: Computer Vision and Pattern Recognition. vol. 1, pp. 947–954 (2005)
28. Rhodes, G., Zebrowitz, L.A., Clark, A., Kalick, S.M., Hightower, A., McKay, R.: Do facial averageness and symmetry signal health? Evolution and Human Behavior 22(1), 31–46 (2001)
29. Shuler, J.T.: Facial sexual dimorphism and judgments of personality: A literature review. Issues 6(1) (2012)
30. Smith, F.G., Jones, B.C., DeBruine, L.M., Little, A.C.: Interactions between masculinity–femininity and apparent health in face preferences. Behavioral Ecology 20(2), 441–445 (2009)
31. Srivastava, A., Klassen, E., Joshi, S., Jermyn, I.: Shape analysis of elastic curves in euclidean spaces. In: IEEE Transactions on Pattern Analysis and Machine In-telligence. vol. 33, pp. 1415 –1428 (2011)
32. Steven, W., Randy, T.: Facial masculinity and fluctuating asymmetry. Evolution and Human Behavior 24(4), 231 – 241 (2003)
33. Toderici, G., O’Malley, S., Passalis, G., Theoharis, T., Kakadiaris, I.: Ethnicity-and gender-based subject retrieval using 3-D face-recognition techniques. In: In-ternational Journal of Computer Vision. vol. 89, pp. 382–391 (2010)
34. Wang, X., Kambhamettu, C.: Gender classification of depth images based on shape and texture analysis. In: Global Conference on Signal and Information Processing (GlobalSIP). pp. 1077–1080. IEEE (2013)
35. Wu, J., Smith, W., Hancock, E.: Gender classification using shape from shading. In: International Conference on Image Analysis and Recognition. pp. 499–508 (2007) 36. www.virtualffs.co.uk:
37. Xia, B., Ben Amor, B., Drira, H., Daoudi, M., Ballihi, L.: Gender and 3D facial symmetry: What’s the relationship? In: IEEE Conference on Automatic Face and Gesture Recognition (2013)
38. Xia, B., Ben Amor, B., Huang, D., Daoudi, M., Wang, Y., Drira, H.: Enhancing gender classification by combining 3d and 2d face modalities. In: European Signal Processing Conference (EUSIPCO) (2013)
39. Young, J.: Head and face anthropometry of adult us civilians (1993)
40. Zhuang, Z., Bradtmiller, B.: Head and face anthropometric survey of us respirator users. Journal of occupational and environmental hygiene 2(11), 567–576 (2005) 41. Zhuang, Z., Landsittel, D., Benson, S., Roberge, R., Shaffer, R.: Facial