HAL Id: hal-02496537
https://hal.umontpellier.fr/hal-02496537
Submitted on 3 Mar 2020HAL is a multi-disciplinary open access archive for the deposit and dissemination of sci-entific research documents, whether they are pub-lished or not. The documents may come from teaching and research institutions in France or abroad, or from public or private research centers.
L’archive ouverte pluridisciplinaire HAL, est destinée au dépôt et à la diffusion de documents scientifiques de niveau recherche, publiés ou non, émanant des établissements d’enseignement et de recherche français ou étrangers, des laboratoires publics ou privés.
Upper plate deformation and trench retreat modulated
by subduction-driven shallow asthenospheric flows
Manar Alsaif, Fanny Garel, Frédéric Gueydan, D. Rhodri Davies
To cite this version:
Manar Alsaif, Fanny Garel, Frédéric Gueydan, D. Rhodri Davies. Upper plate deformation and trench retreat modulated by subduction-driven shallow asthenospheric flows. Earth and Planetary Science Letters, Elsevier, 2020, 532, pp.116013. �10.1016/j.epsl.2019.116013�. �hal-02496537�
Earth and Planetary Science Letters Volume 532, 15 February 2020, 116013 https://doi.org/10.1016/j.epsl.2019.116013
Upper plate deformation and trench retreat
modulated by subduction-driven shallow
asthenospheric flows
Manar Alsaif
1, Fanny Garel
1,
Frédéric Gueydan
1and D. Rhodri Davies
2.
1 Géosciences Montpellier, Université Montpellier & CNRS & Université des
Antilles, Montpellier, France
2 Research School of Earth Sciences, The Australian National University,
Canberra, Australia
Corresponding author: Fanny Garel fanny.garel@umontpellier.fr
Highlights
Slab rollback does not always trigger upper plate (UP) extension.
Asthenospheric flows play a key role in modulating trench retreat.
Sub-slab flow can hamper trench retreat while mantle-wedge flow can en-hance it.
Equal slab pull can lead to UP compression in free UPs, or UP extension in fixed Ups.
Abstract
Upper plate deformation within a subduction zone depends on the complex re-lationship between surface plate motions, trench motion, slab pull and as-thenospheric flow. Previous modelling studies suggest that trench motion rates should be related to slab buoyancy, but this relationship is neither clear nor verified by observations of natural subduction systems. Trench motion is also thought to induce upper plate deformation; however, no clear correlation has been identified between the direction of trench motion and the mode of upper plate deformation. In this study, we construct 2-D thermo-mechanical models to explore the relationship between slab pull, trench retreat and upper plate deformation, focusing on subduction systems with retreating trenches. We start with quasi-steady-state subduction and introduce a positive density an-omaly into the slab to transiently increase slab pull. We vary both the value of the density anomaly and the properties of the upper plate to isolate key con-trols on trench retreat and upper plate deformation. Our models indicate that asthenospheric flow responds to changes in slab pull and influences both trench retreat and upper plate deformation. We propose that trench retreat de-pends on the competition between shallow and opposite asthenospheric flows below the subducting and upper plates, and that a fast sub-slab flow can hamper trench retreat even when slab buoyancy is high. After a transient slab pull increase, the mode of upper plate deformation partly depends on the up-per plate's ability to translate horizontally: an upup-per plate with a ridge at its trailing edge deforms by shortening, while a fixed upper plate may deform by extension. Finally, in some cases, upper plate deformation seems to allow trench retreat if the upper plate is weak enough to be deformed by the basal shear from underlying asthenospheric flow. Our results provide insights into re-treating subduction systems with contrasting upper plate deformation modes, such as the compressive Andes and the extensional Aegean.
Keywords:
Subduction, slab rollback, trench retreat, upper plate deformation, asthenospheric mantle flow, numerical modelling
1. Introduction
The “slab pull” force, generated by the negative buoyancy of subducting lithosphere relative to underlying asthenospheric mantle, is a key component of the force-balance governing tectonic plate motions (e.g. Forsyth and Uyeda, 1975). There are tens of subduction zones on Earth, and observations show that most of them have mobile trenches (e.g. Chase, 1978; Heki et al., 1999). While some trenches, such as the Mariana, advance towards the upper plate, most, including Tonga, retreat towards the subducting plate (Heuret and Lallemand, 2005).
In the past, trench migration has been considered to cause upper plate (UP hereafter) deformation, with trench retreat creating extensional stresses in the UP and forming back-arc basins, while trench advance pushes against the UP, leading to UP compression (e.g. Uyeda and Kanamori, 1979). However, Heuret and Lallemand (2005) show that this correlation is not manifest on Earth. Furthermore, Heuret and Lallemand (2005) and Arcay et al. (2008) demonstrate that the bulk upper plate velocity away from the trench (Vup)
plays a role in this deformation. For example, trench retreat coupled with back-arc extension is observed in the Mediterranean, New Hebrides, Ryukyu and Scotia; conversely, trench retreat is coupled with UP compression in Chile, Japan, Costa Rica and Manila (Heuret and Lallemand, 2005). This upper plate deformation is thought to result from a complex force balance involving motions of the sinking plate, the surface plates and their underlying (asthenospheric) mantle flows (Heuret and Lallemand, 2005).
Numerical and analogue modelling has investigated how the dynamical evolution of a subduction system is affected by a variety of physical processes. These include buoyancy variation in the subducting plate (e.g. Royden and Husson, 2009), deformation through piling and folding of the slab at depth (e.g. Capitanio et al., 2010; Holt et al., 2015), shear drag by asthenospheric flow at the base of the upper plate (e.g. Nakakuki and Mura, 2013), variation in UP thermal and mechanical properties (e.g. Rodríguez-González et al., 2012), lateral mantle flow, or “mantle wind” (e.g. Ficini et al., 2017), 3-D effects from side plates (e.g. Yamato et al., 2009) and toroidal mantle flow (e.g. Stegman et al., 2010 ; Schellart and Moresi, 2013). In our study, we have designed an idealized 2-D subduction model to explore the physical processes and sequence of events that control trench retreat and upper plate deformation.
Trench retreat is widely assumed to be primarily driven by slab pull (Forsyth and Uyeda, 1975), although we note that some recent studies have challenged this notion (e.g. Stotz et al., 2018). Slab pull exerts a bending torque at the subduction hinge, contributing to a downward folding of the slab, which
generates spontaneous retreat of the trench – or rollback. The implication is that older (and therefore, colder and denser) slabs should have more rapidly retreating trenches in comparison to younger slabs (e.g. Garfunkel et al., 1986; Conrad and Hager, 1999; Lallemand et al., 2008). However, on Earth, such a relationship is not observed (Heuret and Lallemand, 2005). To better understand why this is the case, we examine the evolution of a subduction system incorporating a slab with varying slab pull through time. Varying slab pull and slab sinking rates can be caused by density anomalies within the sinking slab, for example, positive anomalies from eclogitised crust (Liu et al., 2010; Arrial and Billen, 2013), or negative anomalies caused by ridges, seamounts or continental crust (e.g. Royden and Husson, 2009; Magni et al., 2014).
Our numerical study features a transient increase in slab buoyancy, to explore the effect of an evolving slab pull force on subduction dynamics, including trench motion, asthenospheric flow and upper plate deformation. We also vary UP resistance to underlying mantle flow . Previous modelling studies on UP deformation have often focused on one particular aspect, such as UP motion (Cerpa et al., 2018), large-scale mantle flow (Husson, 2012), or boundary conditions (Capitanio et al., 2010). This paper aims to explore the relationship between some of these aspects, by focusing on 2-D models of retreating subduction zones and observing UP deformation through time with various rates of trench retreat and various UP boundary conditions. This is particularly interesting for systems such as the South American subduction zone, where the trench is retreating, yet the upper plate experiences strong shortening, contributing to the formation of the Andes (e.g. Oncken et al., 2006).
2. Model description
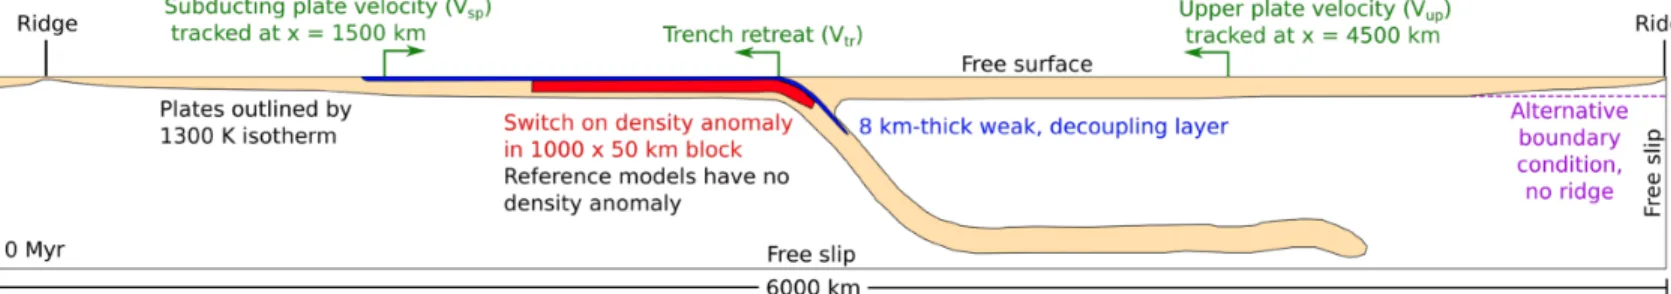
We design 2-D, thermo-mechanical models of upper mantle subduction, with a freely moving trench and upper plate. The initial condition is derived from a time-dependent subduction model that has reached a quasi-steady-state . A positive density anomaly is subsequently inserted into the slab to increase slab pull, allowing us to study the temporal evolution of slab pull, trench retreat, asthenospheric flows, and upper plate deformation without directly forcing surface plate motions. This setup is illustrated in Figure 1.
Figure 1: Model initial conditions where quasi-steady-state subduction is already achieved. All physical boundaries are free-slip (no normal flow) except for the free-surface top. The initial velocity field is set to zero. The beige con-tour follows the 1300 K isotherm and outlines the surface plates, ridges and slab. The weak decoupling layer is shown in blue, and the 1000x50 km2 denser
block in red. The trench is located 2940 km from the left side. Subducting (Vsp)
and upper plate (Vup) surface horizontal velocities are retrieved at 1500 km
and 4500 km from the left side, respectively.
We use the control-volume finite-element computational modelling framework Fluidity, which features an unstructured, adaptive mesh (e.g. Davies et al. 2011; Kramer et al. 2012; Le Voci et al. 2014) and solves the equations describing the conservation of mass, momentum, and energy for an incompressible Stokes fluid, under the Boussinesq approximation:
(1) (2)
(3)
where u and g denote velocity and gravity vectors, respectively, σij the stress
tensor, T the temperature, κ the thermal diffusivity, and Δ⍴=-⍺⍴s(T-Ts) the
expansion and ⍴s the nominal density at the surface temperature Ts
(parameter values are provided in Table 1).
Table 1: Model parameters
We use a box of width 6,000 km. The domain height is 660 km to simulate the upper mantle, with the first-order approximation that the high-viscosity lower mantle is a barrier to slab penetration. The top boundary is a free surface (Kramer et al. 2012), while the bottom and sides are free slip. Plates are defined thermally using the half-space cooling model, and plate ages increase linearly from 0 Myr at the leftmost and rightmost corners (“ridges”) to the limit between the subducting and upper plate (“trench”). The trench is initially located at 3500 km from the left boundary, and retreats to the left as the simulation evolves. Note that the simulated UP is free to move laterally towards the trench due to the rightmost ridge, which mimics a partially oceanic upper plate. These two ridges also enable asthenopheric mantle material to transform into lithospheric plate material by thermal diffusion from the cold surface. Hence, as in nature, the “oceanic” plates renew and do not have a finite length.
Initial plate thermal ages are 40 Ma for the subducting plate (left) and 20 Ma for the upper plate (right). These ages are chosen to generate a slab deflecting horizontally at the bottom of the upper mantle (see Garel et al. (2014) for a regime diagram of slab morphology as a function of initial plate ages). The subducting plate is prescribed a proto-slab shape that is sufficient to initiate subduction under its negative buoyancy. The numerical simulation evolves for 35 Myr, by which time the slab has already subducted through the upper mantle and has partly flattened on the bottom boundary at 660 km depth, with plate and trench velocities exhibiting only small variations through time (Figure 1): we refer to this as quasi-steady-state. We subsequently restart our simulations, with and without (reference case) variations to the buoyancy of the slab.. Hereafter, the time indicated in the simulations is the time passed since this initial mature state.
Most of the domain material is assigned a “mantle” composite rheology, and only an 8 km thick, weak, decoupling layer at the surface of the subducting plate is assigned a weak “crustal” rheology, tracked through a material volume fraction (see Garel et al. 2014 for further details). The weak layer properties revert to those of normal material below 200 km depth. The “mantle” rheology takes into account 4 deformation mechanisms: pseudo-brittle yielding, dislocation creep, diffusion creep, and low-temperature plasticity or “Peierls” creep. Strain-rates for these mechanisms add up, resulting in a composite bulk viscosity:
(4) with creep viscosities μdiff, μdisl, μp calculated as
(5)
with A a prefactor, n the stress exponent, E, V the activation and volume ener-gies respectively, P=⍴sgz the lithostatic pressure, R the gas constant, and II
the second invariant of the strain-rate tensor. Tr is the temperature obtained by adding an adiabatic gradient of 0.5 K/km to the Boussinesq solution (Fowl-er, 2004).
Brittle failure at low lithostatic pressure is approximated through a “yielding” viscosity
(6) where the yield strength τy is given by
(7)
with τ0 the surface yield strength, fc the friction coefficient, and τymax the
maximum yield strength.
The bulk viscosity calculated in equation (4) is limited by lower- and upper-bound values of 1018 and 1025 Pa.s, respectively.
Key model parameters are summarised in Table 1. Our geometrical set-up, boundary conditions, rheology parameterization and numerical solution are similar to Garel et al. (2014).
To vary the slab pull force through time, we increase the density within a 1000x50 km2 denser block in the subducting plate near the trench, below the
weak decoupling crust (Figure 1). This block triggers a change in the overall system dynamics through a transient increase in slab pull, without prescribing forces or velocities at the model surface. We vary the block density anomaly from +10 to +100 kg/m3 in our models to achieve different magnitudes of slab
Table 2: List of simulations and their block density anomalies: additional slab pull (calculated by multiplying density anomaly by 2-D block dimensions and gravity); peak trench retreat (Vtr) and associated time; the peak discrepancy
between upper plate and trench retreat velocities (Vup-Vtr) and associated time;
maximum upper plate deformation width (where strain rate is higher than 10-16
s-1 at 30 km depth), and the time range during which the UP deformation width
is higher than the reference’s.
In some models with a density anomaly of 70 kg/m3 , we also modify the upper
plate (section 3.4) in order to simulate a fixed upper plate of variable strength that cannot translate laterally :
1- Model OFDA70: , we remove the ridge located at the trailing edge of the UP (top-right corner in Figure 1) and impose a constant thickness UP. The thickness used is the average thickness of the ridge-edge models, with an age of ~45 Ma, corresponding to a thickness of ~67 km (calculated via the depth of the 1300 K isotherm derived from the half-space cooling model).
2- Model YFDA70: we remove the ridge and reduce the thickness of the upper plate by setting a constant UP age of 15 Ma, which corresponds to a thickness of ~38 km.
In addition to asthenosphere flow pattern, we analyse the velocity of the subducting plate (Vsp), upper plate (Vup), and trench (Vtr). The trench is defined
as the surface location where the weak, decoupling layer meets the upper plate. Locating the trench using a change in horizontal velocity direction yields similar, albeit noisier, results.Key simulation diagnostics are listed in Table 2.
In the results section below, we first present a description of our reference simulation, followed by results for simulations where we systematically add complexities. These are: (i) introducing a density anomaly in the slab; (ii) vary-ing the value of the density anomaly; (iii) changvary-ing the upper plate boundary condition by fixing its edge; and (iv) changing the thickness and strength of the fixed upper plate. We subsequently discuss the implications of our model results, and their limitations and potential applications to subduction on Earth.
3. Results:
3.1 Steady state reference simulation
In our models, we observe that the subducting plate (hereafter SP) advances towards the right while the upper plate and the trench move towards the left. The slab lies flat near the base of the domain, which effectively isolates two mantle compartments to the left and right of the slab. This leads to twopoloidal flow cells in the asthenosphere: one beneath the subducting slab (clockwise, hereafter referred to as sub-slab), and another in the mantle wedge between the upper plate and the slab (counter-clockwise). These are largely separated by the slab, except for a small, connecting channel beneath the slab (cf. Figure 2).
Figure 2 (following page): Temporal snapshots of the viscosity field, overlain with velocity glyphs, from our reference simulation (no density anomaly, column a) and simulation DA70 (density anomaly +70 kg/m3, column b).
Glyphs show clockwise flow in the sub-slab region, and counter-clockwise flow in the mantle wedge beneath the UP. Glyph lengths indicate the velocity mag-nitude. Plate material is outlined by the black 1300 K isotherm. The denser block is outlined in white for simulation DA70. Both simulations have the same starting trench location and slab tip.
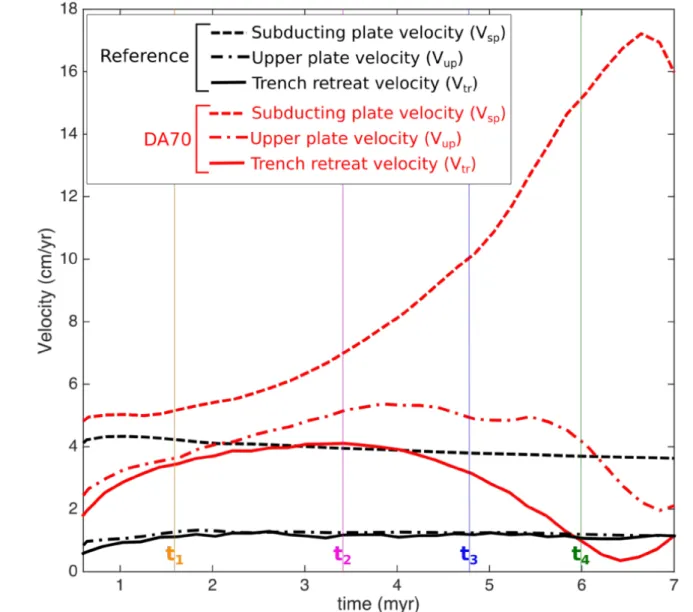
The reference simulation exhibits minimal changes in the asthenosphere flow regime through time (i.e. quasi steady-state subduction: Figure 2a), and is characterised by a slow, steady trench retreat (Figure 3). This is reflected in plate and trench velocities, which are shown in Figure 3: the subducting plate moves right with a velocity (Vsp) of ca. 4 cm/yr, while the upper plate (Vup) and
trench (Vtr) both move left with a velocity of ca. 1 cm/yr throughout the
simulation.
Figure 3: Surface horizontal velocities for the reference simulation (black curves, no density anomaly) and simulation DA70 (red curves, density anom-aly + 70 kg/m3): subducting plate velocity V
sp is positive rightwards, upper plate velocity Vup and trench velocity Vtr are both positive leftwards. The ver-tical lines indicate the times labelled t1 to t4 in Figure 2.
3.2 Effect of a transient slab pull increase
Figure 2b and Figure 3 illustrate the effect of disturbing the initial steady-state subduction by increasing the density within the subducting plate (DA70, density anomaly of +70 kg/m3). Here, the SP moves faster than the reference,
peaking at 17 cm/yr, which is ~4 times faster than the reference case (Figure 3). The slab also sinks faster (see Appendix A), and the slab tip advances faster: the slab tip in simulation DA70 is 150 km further advanced at time t3
than the slab tip in the reference simulation (Figure 2). This faster subduction does not alter the geometry of the asthenospheric flow, but it does increase velocity magnitudes (Figure 2). At time t3, the maximum velocity (in the
shallow asthenosphere below the subducting plate) is 5.7 cm/yr in the reference vs. 14.2 cm/yr in simulation DA70. The UP and the trench also accelerate at first, but unlike the SP, they do not accelerate throughout the simulation. Trench retreat velocity Vtr accelerates during the first 3 Myr, peaks
around 3.4 Myr (t2) at 4.2 cm/yr and subsequently decelerates. Upper plate
velocity Vup accelerates during the first 4 Myr, peaks at 5 cm/yr and then
decelerates.
It is important to emphasize that the trench decelerates before the upper plate (Figure 3 after 3 Myr: Vup > Vtr), resulting in a deformed, high strain-rate region
under compressive stresses in the UP, as illustrated in Figure 4. Deformation is largest when the discrepancy between Vup and Vtr is largest, around 6 Myr (t4
-Figure 3).
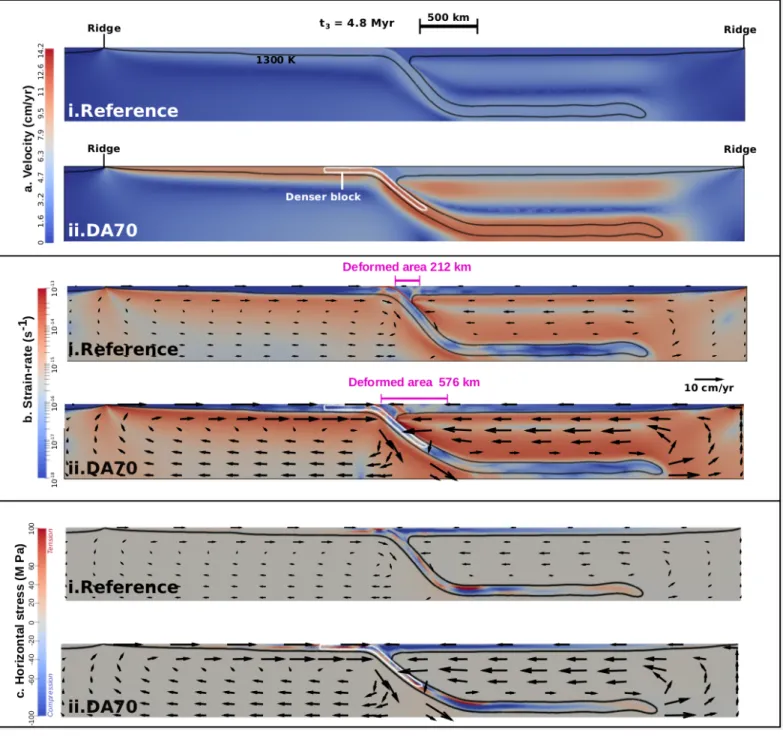
Figure 4 shows the velocity , strain-rate and horizontal normal stress τxx fields
of the reference simulation and of simulation DA70 (block density anomaly of +70 kg/m3) at 4.8 Myr (t
3) during trench and UP deceleration. Figure 4.a.ii
confirms that introducing a density anomaly only changes the velocity field magnitude, not its pattern (also evident in Figure 2).
The two simulations in Figure 4.a exhibit a constant velocity along most of the two plates, i.e. the plates translate rigidly. Figure 4.b shows that in both simulations, strain-rates are highest in the asthenosphere, particularly at the ridge interfaces due to change in flow direction, and between the plates and the asthenosphere due to viscous shear stresses.
We also observe in both simulations a narrow area in the UP immediately next to the trench with large strain-rates, likely resulting from the bending of the sinking slab at depth (Capitanio et al. 2007) transmitted to the UP through the subduction interface.
Figure 4: Comparison at 4.8 Myr (t3) of i) reference simulation with no density anomaly, and ii) simulation DA70 with a block density anomaly of + 70 kg/m3. The plates are outlined with the 1300 K isotherm in black, while the denser block is outlined in white. The panels show plots of a) velocity magnitude, b) second invariant of the strain-rate tensor, and c) horizontal normal stresses τxx. Panels (a) and (b) are overlain with the velocity pattern. Magenta lines de-limit the upper plate deformed region where strain-rate is higher than 10-16 s-1.
In simulation DA70, an intraplate lateral velocity gradient near the trench (Figure 4.a.ii) is associated with additional UP deformation (Figure 4.b.ii). We track the UP region where the strain-rate at 30 km depth is higher than a threshold of 10-16 s-1 to quantify deformation width in the UP. The deformed
region remains smaller than 225 km wide in the reference simulation, while in DA70 it is 576 km at 4.8 Myr (t3).
The mode of deformation associated with these high strain-rates is compressive horizontal normal stresses (τxx ) in both simulations (Figure 4.c).
As with strain-rate, simulation DA70 exhibits more intense and widespread horizontal compression in the UP than the reference simulation.
3.3 Varying the transient increase in slab pull
To better understand the effect of increased slab pull, we varied the block density anomaly in increments of 10 kg/m3 between 0 and +100 kg/m3. A
summary of the results is presented in Table 2, which shows for each density anomaly: (I) the relative increase in slab pull; (ii) peak Vtr and its associated
time; (ii) the peak discrepancy between Vup and Vtr and its associated time; (iv)
max UP deformation width (where strain rate is higher than 10-16 s-1 at 30 km
depth); and (v) the time range during which the UP experiences deformation wider than the reference’s (i.e. where the deformed region defined by strain rate higher than 10-16 s-1 at 30 km depth is wider than 225 km). Appendix B
also shows graphs of each density anomaly against maximum Vtr against
maximum width of upper plate deformation, and the maximum width of upper plate deformation against the maximum discrepancy between Vup and Vtr.
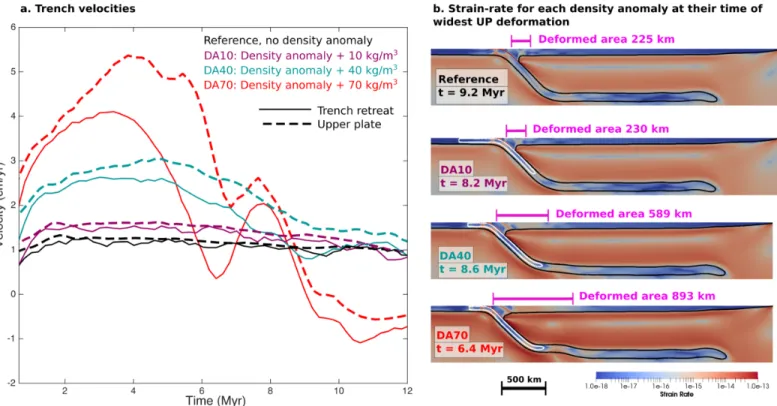
Figure 5 illustrates trench and UP surface velocities for simulations with density anomalies: 0 (reference), +10 kg/m3 (DA10), +40 kg/m3 (DA40), and
+70 kg/m3 (DA70). The same trench retreat pattern observed in simulation
DA70 (acceleration then deceleration) is observed for simulation DA40 (Figure 5), and also for all density anomalies higher than +20 kg/m3. Note that the
velocities for DA70 oscillate after 6 Myr due to slab buckling as the denser block reaches the closed bottom boundary (see Appendix C). We stop our analysis of UP deformation before slab buckling starts.
Simulation DA10 shows equal Vup and Vtr, which are 0.5 cm/yr faster than in
the reference simulation. In DA40, there is a discrepancy between Vup and Vtr,
where Vup becomes progressively faster than Vtr. For all simulations, trench and
UP velocities both increase with increasing density anomaly (Table 2). Peak Vtr
increases almost linearly with increasing slab density anomaly (Appendix B). The discrepancy between Vup and Vtr increases with higher density anomalies,
and is associated with wider UP deformation (see high strain-rate regions in Figure 5.b and Appendix B).
Figure 5: a) Upper plate and trench retreat velocities for reference simulation with no density anomaly and simulations DA10, DA40 and DA70, which have density anomalies +10 kg/m3,+40 kg/m3,+70 kg/m3 respectively.
b) Plots of the second invariant of the strain-rate tensor for each simulation at their times of widest upper plate deformation (where strain rate is higher than 10-16 s-1 at 30 km depth). Magenta lines delimit the deformed region. The
plates are outlined with the 1300 K isotherm in black, while the denser block is outlined in white.
3.4 Fixing the edge of the upper plate
We now design models with a constant thickness and age UP, preventing the rigid translation of the UP by lateral asthenospheric push at a ridge located at the edge of the UP (top right corner, Figure 1). Note that we preserve the thermal structure of the UP adjacent to the trench (up to ca. 300 km away from the trench) to avoid a change in the corner flow regime. A block density anomaly of +70 kg/m3 is inserted into the slab to allow direct comparison with the free-edge simulation DA70. The constant UP age in simulation OFDA70 (Figure 6.b) is initially 45 Ma (away from the trench), similar to the average of the variable ages along the UP in the “ridge-edge” simulations (e.g. DA70).
After the denser block is introduced, the slab sinking and subducting plate velocity accelerates as in DA70 (peak Vsp of 15 cm/yr at 4 Myr in simulation
OFDA70). The fixed upper plate does not move and the trench is stationary throughout simulation OFDA70,. This is associated with an increase in slab dip leading to a quasi-vertical slab (Figure 6b). The rapid subduction of the denser block is later associated to the formation of a small slab kink at the bottom of the lower mantle (Figure 6c), and then to slab folding in a thick pile. Asthenosphere return flows below both plates are significantly reduced in magnitude compared to free-edge simulation DA70 (e.g. < 3.5 cm/yr at t = 8.8 Myr).
Comparison of Figures 6a and 6b shows that the stress pattern in the overriding plate is strongly affected by its trailing-edge boundary condition, for similar depths of the denser block into the subducting slab, and despite a similar counterclockwise pattern of asthenospheric flow below the UP: the ridge-edge plate of simulation DA70 exhibits purely compressional horizontal normal stresses, whereas the fixed-edge simulation OFDA70 features a variable stress pattern along the UP length, with compression near the trench and extension near its fixed edge. The UP stress pattern remained fairly steady during simulation DA70. However in simulation OFDA70, the instantaneous change of boundary condition (fixed-edge compared to previously free-edge UP) leads to time-dependent stress pattern in the UP (Figure 6b-c), that is in close association to deep slab deformation. Figure 6d shows for example that, during the slab kink formation near the bottom boundary, the horizontal normal stresses are almost purely extensional along the UP. We also observe later in the simulation a purely compressive pattern when the slab piles at the bottom.
In simulation YFD70, the constant UP age is set to 15 Ma, approximating a younger and weaker UP (Figure 6.d). Subduction is at first faster than in DA70 and OFDA70 with Vsp peaking at 25 cm/yr at 3 Myr. We observed a minor
trench retreat when the denser lithoblock reaches the bottom boundary (52 km by 6.2 Myr, Figure 6.d). This is associated to faster asthenosphere flows in YFDA70 than in OFDA70 (comparison of Figure 6c and 6d when the dense block reaches the bottom), especially in the shallow asthenosphere below the plates. Trench retreat is associated to slab rollback at shallow depths (<200 km) while the denser block anchors the vertical portion of the slab near the bottom of the domain as in simulation OFDA70. This leads to the formation of a large, transient slab kink in mid-upper mantle (Figure 6d).
For simulations OFDA70 and YFDA70, the UPs exhibit extensional horizontal normal stresses when the denser block reaches the bottom boundary (Figures 6.c and 6.d), which are larger and more widespread in simulation OFDA70. In simulation YFDA70, the UP extensional deformation is large in the area above the slab tip and near the right side (upwelling asthenosphere) as shown in Figure 6d.
Figure 6 (following page):
Plots of horizontal normal stress τxx overlain with velocity glyphs. The plates are outlined by the black 1300 K isotherm. The denser block is outlined in white.
a) Simulation DA70, with block density anomaly of +70 kg/m3, unaltered
upper plate thermal structure, with a ridge at its trailing edge (same as Figure 4). Shown at 4.8 Myr (t3).
b) Simulation OFDA70, with block density anomaly of +70 kg/m3, constant
upper plate age of 45 Ma (no ridge, “fixed edge”). Shown at t=4.1 Myr, when the denser block reaches 400 km depth, similar to its depth in Figure 6a.
c) Same as Figure 6c at t = 8.8 Myr, the time of strongest horizontal stress in the upper plate when the denser block reaches the bottom boundary.
d) Simulation YFDA70, with block density anomaly of +70 kg/m3, constant
upper plate age of 15 Ma (no ridge, “fixed edge”). Shown at t = 6.2 Myr, when the denser blocks reaches the bottom boundary, similarly to Figure 6c.
4. Discussion
4.1 Proposed scenario for the response of plates’ and trench motions to slab pull increase
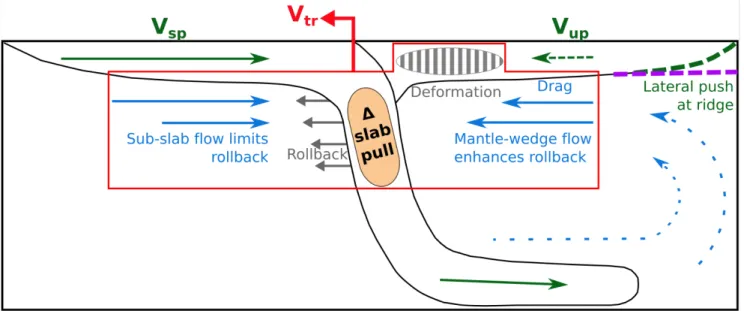
The force balance governing subduction remains an area of active research. It has been examined in numerous studies (e.g. Conrad and Hager, 1999; Capitanio et al., 2007; Husson et al., 2012; Goes et al., 2017), to understand how the potential energy of a slab’s negative buoyancy is transmitted to slab motion, surface plate motion and asthenospheric motion. These studies also question how this energy is dissipated through slab bending at the hinge and through drag of the surrounding mantle. In this `energetics’ perspective, we propose a scenario, illustrated in Figure 7, linking the initial slab pull increase to the observed trench and plate motions, slab rollback and asthenospheric flows.
Figure 7: Cartoon of the main processes influencing trench retreat and upper plate deformation for 2-D subduction (similar to the center of a wide-slab sub-duction). Slab pull variations trigger transient asthenospheric flows. We pro-pose that trench motion is controlled by the competition between the shallow opposing asthenospheric flows on each side of the slab (section 4.1). We fur-ther interpret that the mode of upper plate deformation depends on its ability to translate (far-field boundary condition) and to resist basal shear drag by mantle-wedge flow (section 4.2).
Raising slab pull by introducing a denser block in the slab increases the overall speed of subduction represented by the slab sinking velocity (Appendix A), the surface plate velocities (Figure 3) and the slab tip advance velocity (Appendix D). The larger slab pull induces large sinking velocities and triggers, through viscous drag, acceleration in the adjacent asthenosphere on both sides of the slab (Figure 2) that increases lateral motions of both plates through the ridges at their edges (also seen in Faccenna et al., 2017). The slab pulls the subducting plate, which also accelerates (same pattern as slab sinking on Appendix A), and Vsp remains high at 6 Myr (t4) when the block is half subducted.
Trench retreat velocity also increases at first, but then decelerates after 3.4 Myr (Figure 3). Slab dip decreases (increases) when trench retreat accelerates (decelerates), albeit with a ~2 Myr delay (Appendix E). In simulation ODA70, the slab also progressively steepens as the trench remains stationary, accommodating increased slab pull (Figure 6b). Capitanio et al. (2007) proposed that this slab dip adjustment minimized the energy dissipation associated with bending.
Trench retreat initially matches the velocity of the UP (Figure 3), suggesting that UP translation partially controls trench retreat in our models (consistent with e.g. Cerpa et al., 2018). However, at 4.8 Myr (t3) in simulation DA70,
trench retreat decelerates while the UP velocity remains high (Figure 3). At this time, asthenosphere velocity at a depth of ~125 km in the sub-slab region is 8.4 cm/yr in comparison to only 6 cm/yr in the mantle wedge (Figure 2). Additionally, there is a lag in the deceleration of rollback velocities: at 200 km depth, rollback decelerates after trench retreat deceleration and before those at 400 km depth (Appendix F), which suggests that deceleration starts from the surface (trench velocity) before propagating deeper (slab rollback). We thus propose that mantle-wedge return flow beneath the UP promotes trench retreat and slab rollback, while sub-slab flow dragged by the subducting plate opposes this motion, as shown conceptually in Figure 7. This is in agreement with Husson (2012), who proposed that the difference between mantle drag forces below lower and upper plates control trench migration rates.
4.2 Upper plate deformation during trench retreat and applications to natural examples
Following Sternai et al. (2014) and Dal Zilio et al. (2018), we propose that the accelerated asthenospheric return flow below the upper plate induces shear stresses at the base of the UP, dragging it towards the trench. In our free-edge models (e.g. simulation DA70), the UP is also pushed leftwards from its ridge. An upper plate moving faster than the trench retreat rate (Figure 3)
results in upper plate compression (Figure 4c), with the width of the UP deformed region increasing with increasing slab pull (Table 2, Appendix B). However, the smallest slab pull (simulation DA10) does not result in extra deformation compared to the reference simulation, despite its trench retreating faster than the reference simulation (Figure 5). Thus, for low values of acceleration, the rigid translation of the UP is fully accommodated by trench retreat with no discrepancy between Vup and Vtr (Figure 5, simulation
DA10); and significant deformation only occurs for higher block density anomalies (simulations DA30 – DA100) due to their faster mantle-wedge flows.
Our fixed edge models exhibit extensional stresses when the denser block reaches the bottom boundary and the slab rolls back at shallow depths (Figure 6c-d). However, the older, stronger UP exhibits larger stresses (OFDA70, Figure 6c) and no trench retreat, while the younger, weaker UP releases part of the stress through trench retreat and slab rollback (YFDA70, Figure 6d). We propose two scenarios explaining these features, also observed by, for example, Nakakuki and Mura (2013), Chen et al. (2015) and Capitanio et al. (2010):
Scenario A: a stronger asthenosphere flow in YFDA70 pushes on the slab, causing shallow rollback and, hence, trench retreat.
Scenario B: comparable asthenospheric flow (triggered by the same slab pull increase) is able to shear only the young UP in simulation YFDA70, causing UP extension and, hence, trench retreat and slab rollback. The older, stronger UP in simulation OFDA70 is able to resist shearing, resulting in larger stresses (Figure 6c) with no trench retreat. This was also suggested by, for example, Wdowinski et al., 1989, Sternai et al., 2014 and Gérault et al. (2015).
We note that these two scenarios are fully compatible, and likely feedback into one another: upper plate extension causes trench retreat, which causes slab rollback that increases asthenospheric flows that is likely to deform the upper plate even more.
The influence of the upper plate boundary condition has also been observed in 3-D studies, where trench retreat at the center of wide slabs results in predominantly poloidal flow and UP compression (e.g. Schellart and Moresi, 2013) ; whereas trench retreat of a narrow slab is able to generate toroidal flow, which results (scenario A) in UP extension (e.g. Schellart and Moresi, 2013; Magni et al., 2014). Such 3-D effects are not captured in our 2-D simulations. However, we expect the same physical processes whatever the dimensionality, and, based on our results from 2-D simulations, we
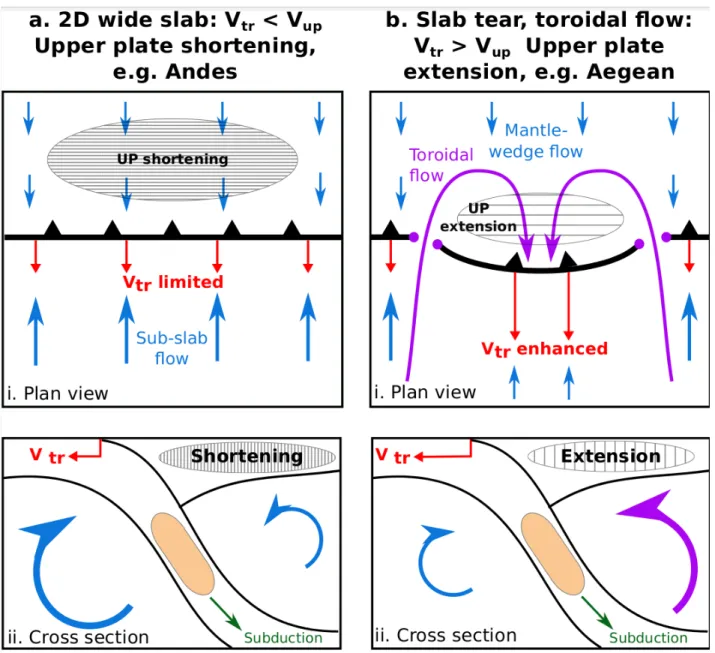
extrapolate hereafter our results to two end-member upper plate stress regimes in retreating subduction zones, as summarized in Figure 8:
Upper plate compression caused by lateral translation of the UP faster than trench retreat, which can be facilitated by a ridge on the UP’s trailing edge (Figure 8a). We suggest as a natural example the retreating South American subduction zone, with the mid-Atlantic ridge in the UP trailing edge. Compression in the Andes is thought to have initiated 50 Ma ago, which is synchronous with a discrepancy between Vup and Vtr, as the trench has been decelerating more than the UP
(Faccenna et al., 2017). Our results suggest that compression in the Andes may result from a stronger asthenospheric flow beneath the UP (e.g. Capitanio et al., 2011), possibly related to changes in the Atlantic spreading rates (Colli et al., 2014). Alternatively, compression could be associated with a larger push from the Mid-Atlantic ridge due to diversion of mantle flow from the African hotspot (e.g. Silver et al., 1998; Husson et al., 2012).
Upper plate extension in which strong asthenosphere flow below the UP induces slab rollback with trench retreat velocity larger than the UP velocity (scenario A, Figure 8b). This could apply to some Mediterranean subduction zones (Aegean, Calabrian) that exhibit UP extension and accelerated trench retreat. The latter was suggested to result from increases in slab pull (e.g. Jolivet et al., 1999) or slab tears (Wortel and Spakman, 2000) triggering toroidal flow (scenario A). Our models also support that this extension could relate to a fixed Eurasia upper plate, which is much larger than the individual subduction zones and is fixed relative to the Mediterranean slabs (scenario B). As in model YFDA70 (Figure 6d), trench retreat acceleration during Miocene (Brun et al., 2016) could have been the consequence of the UP extension that was reconstructed in the Aegean subduction zone (e.g. Brun et al., 2016; Tirel et al., 2004).
There are examples of subduction zones that exhibit changes in upper stress regime through time (e.g. Japan, Banda, Apennines, Scotia, see Clark et al. (2008)). Our models suggest a control on UP stress pattern of deep slab dynamics (Figure6b-c), while other modelling studies propose explanations such as changes in neighboring plate velocity through time (e.g. Japan, according to Jolivet et al. (1999)), or buoyancy variation of incoming subducting material (e.g. Banda and Apennines according to Royden and Husson (2009)). We expect the complex relationship between trench motion and UP deformation style (Figure 8) to also hold for advancing trenches, which do not all deform in compression, such as the extensive Izu-Bonin or Kermadec subduction zones’ UP (Heuret and Lallemand, 2005).
Figure 8: Cartoon of the two end members proposed for upper plate deforma-tion in subducdeforma-tion zones with retreating trenches. a) Upper plate shortening occurs when the sub-slab flow is faster than the mantle wedge flow, hamper-ing trench retreat (Vtr < Vup). This is applicable to some subduction zones with
wide slabs. b) Upper plate extension occurs (scenario A, see text) when the mantle wedge flow is larger than the sub-slab flow, enhancing trench retreat (Vtr > Vup). This is applicable to subduction zones with narrow or torn slabs
where toroidal flow can contribute to the strong mantle wedge flow beneath the upper plate. Note that a fixed, weak upper plate is also expected to de-form in extension, which could trigger trench retreat (scenario B, see text).
4.3 Model limitations
The asthenospheric flow regime in our 2-D models is controlled by the model’s 2-dimensionality and its closed free slip side and bottom boundaries. For instance, the closed right side in our model slows down subduction after 6 Myr, with deceleration of the subducting plate following deceleration in slab tip advance at the bottom (Appendix D). This raises the issue whether the finite-volume in the left mantle compartment is resisting slab rollback, and we thus examine the dynamic pressure field during slab rollback (Appendix G). The dynamic pressure is largely negative in the mantle wedge, which is a consequence of the slab isolating two mantle compartments. This feature was explained by Dvorkin et al., 1993 as resulting from a “slab suction” force associated to the corner flow and driving the UP towards the trench. Such pressure gradient below the UP was also reconstructed from dynamic topography variations along the South America UP (Colli et al., 2014). However this does not rule out a possibly overpressured left compartment in our simulations.
We ran a test to analyse the sensitivity of our results to this issue, allowing communication between the two mantle compartments, with the denser block inserted in a slab for a set-up featuring a high-viscosity (10-fold jump) lower mantle (Appendix H). The asthenosphere here flows from the left to the right of the domain through the lower mantle below the slab, and the sub-slab and mantle-wedge compartments are thus no longer isolated. The subduction velocities are lower in this set-up than in simulation DA70 (e.g. peak Vtr of 2 cm/yr compared to 4 cm/yr in DA70) because slab sinking in the
lower mantle is slower than slab advance at the bottom of the upper mantle. Despite these differences in velocity magnitude and flow pattern, we observe the same temporal trends as in simulation DA70: trench retreat decelerates while subducting plate velocity (hence slab pull) remains high. This suggests that the closed bottom boundary in simulation DA70 is not causing trench retreat deceleration, although a full demonstration of this and a quantification of the influence of closed side-boundaries, requires either 2-D models with periodic or open sides, or models in a global 3D spherical geometry. This is an important area for future research.
We finally quantify how slab rollback is accommodated within our 2-D model geometry. Taking an average rollback velocity of 3 cm/yr (matching mean Vtr in
Figure 3) integrated along an inclined slab length of 1000 km, the associated 2-D volume reduction of the left mantle compartment is around 10-3 m2/s. As
the trench retreats, the slab flattens (decrease of slab dip from 50° to about 35° - Appendix E), which creates a sub-slab volume increase of 1.3 x 10¹¹ m2
over 6 Myr. This corresponds to a 2-D volume increase rate of 0.7 x 10⁻³ m2/s.
lengthening flat segment of the slab (sub-slab channel at the bottom of the model). If we take a conservative sub-slab channel thickness of 50 km, which lengthens 600 km over 6 Myr, this yields a volume increase rate of 0.2x10⁻³
m2/s. Thus, slab flattening and sub-slab channel elongation compensate most
of the sub-slab mantle volume reduction caused by rollback, with the free surface elevation (Appendix I) above the subducting plate accommodating the remainder.
5. Conclusion
Our 2-D subduction models shed light on physical chain of events between slab pull, trench retreat, asthenosphere flows and upper plate deformation. Our results show that depending on the asthenospheric flow regime (magnitude and orientation), the upper plate strength and its boundary conditions, a retreating trench can be associated with an upper plate that is either in compression or in extension. This can partly explain the lack of correlation between trench retreat rates and UP stress regimes observed on Earth (Lallemand et al., 2005). We propose that the ability of the trench to retreat depends on competition between shallow asthenospheric flows below the subducting and upper plates, and show that stresses in the upper plate result from the discrepancy between trench retreat and upper plate velocities and from basal drag by the mantle-wedge flow.. For example, if the upper plate is free to move (e.g. if there is a ridge in its trailing edge), deformation can occur in compression as trench retreat is hampered. On the other hand, if the upper plate is fixed, deformation can occur in extension, with processes analogous to the ones in narrow subduction zones with large toroidal flows. If the velocities of the upper plate and the trench are equal, the trench can retreat without any upper plate deformation. We finally find that trench retreat can be a consequence of deformation in the upper plate. Hence, for the present-day and recent geological past, we emphasize the important role of asthenospheric flows in modulating trench motion and upper plate deformation.
Acknowledgements:
This study has benefited from several discussions with Jeroen van Hunen, Serge Lallemand and the other members of the SUBITOP ITN. The paper was largely improved by constructive feedback from Laurent Husson and an an-onymous reviewer.
Our work has received funding from the European Union's EU Framework Pro-gramme for Research and Innovation Horizon 2020 under Grant Agreement No 674899.
References
1. Arcay, D., S. Lallemand, and M. P. Doin. 2008. “Back-Arc Strain in
Subduction Zones: Statistical Observations versus Numerical Modeling.” Geochemistry, Geophysics, Geosystems 9 (5).
https://doi.org/10.1029/2007GC001875.
2. Arrial, Pierre André, and Magali I. Billen. 2013. “Influence of Geometry and Eclogitization on Oceanic Plateau Subduction.” Earth and Planetary Science Letters 363: 34–43. https://doi.org/10.1016/j.epsl.2012.12.011. 3. Brun, J. P., Claudio Faccenna, F Gueydan, D Sokoutis, M Philippon, K
Kydonakis, and C Gorini. 2016. “Effects of Slab Rollback Acceleration on Aegean Extension” 50: 927–37.
4. Capitanio, F. A., G Morra, and S Goes. 2007. “Dynamic Models of
Downgoing Plate-Buoyancy Driven Subduction: Subduction Motions and Energy Dissipation.” Earth and Planetary Science Letters 262 (1–2): 284– 97. https://doi.org/10.1016/j.epsl.2007.07.039.
5. Capitanio, F. A., D. R. Stegman, L. N. Moresi, and W. Sharples. 2010. “Upper Plate Controls on Deep Subduction, Trench Migrations and
Deformations at Convergent Margins.” Tectonophysics 483 (1–2): 80–92. https://doi.org/10.1016/j.tecto.2009.08.020.
6. Capitanio, F A, C Faccenna, S Zlotnik, and D R Stegman. 2011. “Subduction Dynamics and the Origin of Andean Orogeny and the Bolivian Orocline.” Nature, no. November.
https://doi.org/10.1038/nature10596.
7. Cerpa, N G, B Guillaume, and J Martinod. 2018. “The Interplay between Overriding Plate Kinematics , Slab Dip and Tectonics,” 1–47.
https://doi.org/10.1093/gji/ggy365.
8. Chase, Clement G. 1978. “Plate Kinematics: The Americas, East Africa, and the Rest of the World.” Earth and Planetary Science Letters 37 (3): 355–68. https://doi.org/https://doi.org/10.1016/0012-821X(78)90051-1. 9. Chen, Zhihao, Wouter P Schellart, and João C Duarte. 2015. “Overriding
Plate Deformation and Variability of Fore-Arc Deformation during Subduction: Insight from Geodynamic Models and Application to the Calabria Subduction Zone.” Geochemistry, Geophysics, Geosystems 16 (10): 3697–3715. https://doi.org/10.1002/2015GC005958.
10. Clark, Stuart R., Dave Stegman, and R. Dietmar Müller. 2008. “Episodicity in Back-Arc Tectonic Regimes.” Physics of the Earth and Planetary Interiors 171 (1–4): 265–79.
https://doi.org/10.1016/j.pepi.2008.04.012.
11. Colli, L., Stotz, I., Bunge, H.‐P., Smethurst, M., Clark, S., Iaffaldano, G., Tassara, A., Guillocheau, F., and Bianchi, M.C. 2014. “Rapid South Atlantic spreading changes and coeval vertical motion in surrounding continents: Evidence for temporal changes of pressure‐driven upper
mantle flow.” Tectonics, 33 (7): 1304-1321. https://doi.org/10.1002/2014TC003612
12. Conrad, Clinton P., and Bradford H. Hager. 1999. “Effects of Plate Bending and Fault Strength at Subduction Zones on Plate Dynamics.” Journal of Geophysical Research: Solid Earth 104 (B8): 17551–71. https://doi.org/10.1029/1999JB900149.
13. Dal Zilio, Luca, Manuele Faccenda, and Fabio Capitanio. 2018. “The Role of Deep Subduction in Supercontinent Breakup.” Tectonophysics 746: 312–24. https://doi.org/https://doi.org/10.1016/j.tecto.2017.03.006. 14. Davies, D. Rhodri, Cian R. Wilson, and Stephan C. Kramer. 2011.
“Fluidity: A Fully Unstructured Anisotropic Adaptive Mesh Computational Modeling Framework for Geodynamics.” Geochemistry, Geophysics, Geosystems 12 (6). https://doi.org/10.1029/2011GC003551.
15. Dvorkin, J., Nur, A., Mavko, G. and Ben-Avraham, Z. 1993. Narrow subducting slabs and the origin of backarc basins, Tectonophysics, 1993 https:// doi.org/10.1016/0040-1951(93)90087-Z
16. Faccenna, Claudio, Onno Oncken, Adam F. Holt, and Thorsten W. Becker. 2017. “Initiation of the Andean Orogeny by Lower Mantle Subduction.” Earth and Planetary Science Letters 463: 189–201. https://doi.org/10.1016/j.epsl.2017.01.041.
17. Ficini, E., L. Dal Zilio, C. Doglioni, and T. V. Gerya. 2017. “Horizontal Mantle Flow Controls Subduction Dynamics.” Scientific Reports 7 (1): 1– 7. https://doi.org/10.1038/s41598-017-06551-y.
18. Forsyth, Donald W, and Seiya Uyeda. 1975. “On the Relative Importance of the Driving Forces of Plate Motion.” Geophysical Journal International 43 (1): 163–200.
https://doi.org/10.1111/j.1365-246X.1975.tb00631.x.
19. Fowler, C M R. 2004. The Solid Earth: An Introduction to Global Geophysics. 2nd ed. Cambridge: Cambridge University Press.
https://doi.org/DOI: 10.1017/CBO9780511819643.
20. Garel, Fanny, Saskia. Goes, D. Rhodri Davies, J. Huw Davies,
Stephan C. Kramer, and Cian R. Wilson. 2014. “Interaction of Subducted Slabs with the Mantle Transition-Zone: A Regime Diagram from 2-D Thermo-Mechanical Models with a Mobile Trench and an Overriding Plate.” Geochemistry, Geophysics, Geosystems 15: 4692–4711. https://doi.org/10.1002/2014GC005257.
21. Garfunkel, Z, C A Anderson, and G Schubert. 1986. “Mantle Circulation and the Lateral Migration of Subducted Slabs.” Journal of Geophysical Research 91 (B7): 7205–23.
22. Gérault, Mélanie, Laurent Husson, Meghan S Miller, and Eugene D Humphreys. 2015. “Flat-Slab Subduction, Topography, and Mantle
Dynamics in Southwestern Mexico.” Tectonics 34 (9): 1892–1909. https://doi.org/10.1002/2015TC003908.
23. Goes, Saskia, Roberto Agrusta, Jeroen van Hunen, and Fanny Garel. 2017. “Subduction-Transition Zone Interaction: A Review.” Geosphere 13 (3): 644–64. http://dx.doi.org/10.1130/GES01476.1.
24. Heki, Kosuke, Shin’ichi Miyazaki, Hiroaki Takahashi, Minoru Kasahara, Fumiaki Kimata, Satoshi Miura, Nikolay F. Vasilenko, Alexei Ivashchenko, and Ki-Dok An. 1999. “The Amurian Plate Motion and Current Plate Kinematics in Eastern Asia.” Journal of Geophysical Research 104 (B12): 29147. https://doi.org/10.1029/1999JB900295. 25. Heuret, Arnauld, and Serge Lallemand. 2005. “Plate Motions, Slab
Dynamics and Back-Arc Deformation.” Physics of the Earth and Planetary Interiors 149 (1-2 SPEC. ISS.): 31–51.
https://doi.org/10.1016/j.pepi.2004.08.022.
26. Holt, A. F., T. W. Becker, and B. A. Buffett. 2015. “Trench Migration and Overriding Plate Stress in Dynamic Subduction Models.” Geophysical Journal International 201 (1): 172–92. https://doi.org/10.1093/gji/ggv011. 27. Husson, Laurent. 2012. “Trench Migration and Upper Plate Strain
over a Convecting Mantle.” Physics of the Earth and Planetary Interiors 212–213: 32–43. https://doi.org/10.1016/j.pepi.2012.09.006.
28. Husson, Laurent, Clinton P Conrad, and Claudio Faccenna. 2012. “Plate Motions, Andean Orogeny, and Volcanism above the South
Atlantic Convection Cell.” Earth and Planetary Science Letters 317–318: 126–35. https://doi.org/https://doi.org/10.1016/j.epsl.2011.11.040.
29. Jolivet, Laurent, Claudio Faccenna, Nicola D’Agostino, Marc Fournier, and Dan Worrall. 1999. The Kinematics of Back-Arc Basins, Examples from the Tyrrhenian, Aegean and Japan Seas. Geological Society, London, Special Publications. Vol. 164.
https://doi.org/10.1144/GSL.SP.1999.164.01.04.
30. Kramer, Stephan C., Cian R. Wilson, and D. Rhodri Davies. 2012. “An Implicit Free Surface Algorithm for Geodynamical Simulations.” Physics of the Earth and Planetary Interiors 194–195: 25–37.
https://doi.org/10.1016/j.pepi.2012.01.001.
31. Lallemand, Serge, Arnauld Heuret, and David Boutelier. 2005. “On the Relationships between Slab Dip, Back-Arc Stress, Upper Plate
Absolute Motion, and Crustal Nature in Subduction Zones.” Geochemistry, Geophysics, Geosystems 6 (9).
https://doi.org/10.1029/2005GC000917.
32. Lallemand, Serge, Arnauld Heuret, Claudio Faccenna, and
Francesca Funiciello. 2008. “Subduction Dynamics as Revealed by Trench Migration.” Tectonics 27 (3): 1–15.
https://doi.org/10.1029/2007TC002212.
33. Liu, Lijun, Michael Gurnis, Maria Seton, Jason Saleeby, R. Dietmar Müller, and Jennifer M. Jackson. 2010. “The Role of Oceanic Plateau Subduction in the Laramide Orogeny.” Nature Geoscience 3 (5): 353–57. https://doi.org/10.1038/ngeo829.
34. Magni, Valentina, Claudio Faccenna, Jeroen van Hunen, and Francesca Funiciello. 2014. “How Collision Triggers Backarc Extension: Insight into Mediterranean Style of Extension from 3-d Numerical Models.” Geology 42 (6): 511–14. https://doi.org/10.1130/G35446.1. 35. Nakakuki, Tomoeki, and Erika Mura. 2013. “Dynamics of Slab
Rollback and Induced Back-Arc Basin Formation.” Earth and Planetary Science Letters 361: 287–97. https://doi.org/10.1016/j.epsl.2012.10.031. 36. Oncken, Onno, David Hindle, Jonas Kley, Kirsten Elger, Pia Victor,
and Kerstin Schemmann. 2006. “Deformation of the Central Andean Upper Plate System --- Facts, Fiction, and Constraints for Plateau Models.” In The Andes: Active Subduction Orogeny, edited by Onno Oncken, Guillermo Chong, Gerhard Franz, Peter Giese, Hans-Jürgen Götze, Victor A Ramos, Manfred R Strecker, and Peter Wigger, 3–27. Berlin, Heidelberg: Springer Berlin Heidelberg.
https://doi.org/10.1007/978-3-540-48684-8_1.
37. Rodríguez-González, Juan, Ana M. Negredo, and Magali I. Billen. 2012. “The Role of the Overriding Plate Thermal State on Slab Dip Variability and on the Occurrence of Flat Subduction.” Geochemistry, Geophysics, Geosystems 13 (1): 1–21.
https://doi.org/10.1029/2011GC003859.
38. Royden, Leigh H, and Laurent Husson. 2009. “Subduction Zone Geodynamics,” 35–45. https://doi.org/10.1007/978-3-540-87974-9.
39. Schellart, W. P., and L. Moresi. 2013. “A New Driving Mechanism for Backarc Extension and Backarc Shortening through Slab Sinking Induced Toroidal and Poloidal Mantle Flow: Results from Dynamic Subduction Models with an Overriding Plate.” Journal of Geophysical Research: Solid Earth 118 (6): 3221–48. https://doi.org/10.1002/jgrb.50173.
40. Schellart, W P. 2017. “Andean Mountain Building and Magmatic Arc Migration Driven by Subduction-Induced Whole Mantle Flow.” Nature Communications 8 (1): 2010. https://doi.org/10.1038/s41467-017-01847-z.
41. Silver, Paul G., Raymond M. Russo, and Carolina Lithgow-Bertelloni. 1998. “Coupling of South American and African Plate Motion and Plate Deformation Coupling of South American and African Plate Motion and Plate Deformation.” Science 279 (2): 60–63.
https://doi.org/10.1126/science.279.5347.60.
42.D.R.Stegman, R.Farrington, F.A.Capitanio, W.P.Schellart. 2010. “A regime diagram for subduction styles from 3-D numerical models of free
subduction”, Tectonophysics 483 (1-2): 29-45. https://doi.org/10.1016/j.tecto.2009.08.041
43. Sternai, Pietro, Laurent Jolivet, Armel Menant, and Taras Gerya. 2014. “Driving the Upper Plate Surface Deformation by Slab Rollback and Mantle Flow.” Earth and Planetary Science Letters 405: 110–18. https://doi.org/10.1016/j.epsl.2014.08.023.
44. Stotz, I. L., G. Iaffaldano, and D. R. Davies. 2018. “Pressure-Driven Poiseuille Flow: A Major Component of the Torque-Balance Governing Pacific Plate Motion.” Geophysical Research Letters 45 (1): 117–25. https://doi.org/10.1002/2017GL075697.
45. Tirel, Céline, Frédéric Gueydan, Christel Tiberi, and Jean Pierre Brun. 2004. “Aegean Crustal Thickness Inferred from Gravity Inversion. Geodynamical Implications.” Earth and Planetary Science Letters 228 (3– 4): 267–80. https://doi.org/10.1016/j.epsl.2004.10.023.
46. Uyeda, Seiya, and Hiroo Kanamori. 1979. “Back-Arc Opening and the Mode of Subduction.” Journal of Geophysical Research: Solid Earth 84 (B3): 1049–61. https://doi.org/10.1029/JB084iB03p01049.
47. Voci, G Le, D Rhodri Davies, S Goes, S C. Kramer, and Clark Wilson. 2014. A Systematic 2-D Investigation into the Mantle Wedge’s Transient Flow Regime and Thermal Structure: Complexities Arising from a
Hydrated Rheology and Thermal Buoyancy. Geochemistry, Geophysics, Geosystems. Vol. 15. https://doi.org/10.1002/2013GC005022.
48. Wdowinski, Shimon, Richard J O’Connell, and Philip England. 1989. “A Continuum Model of Continental Deformation above Subduction Zones: Application to the Andes and the Aegean.” Journal of Geophysical Research: Solid Earth 94 (B8): 10331–46.
https://doi.org/10.1029/JB094iB08p10331.
49. Wortel, M. J. R., and W. Spakman. 2000. “Subduction and Slab Detachment in the Mediterranean-Carpathian Region.” Science 290 (5498): 1910–17. https://doi.org/10.1126/science.290.5498.1910.
50. Yamato, P., L. Husson, J. Braun, C. Loiselet, and C. Thieulot. 2009. “Influence of Surrounding Plates on 3D Subduction Dynamics.”
Geophysical Research Letters 36 (7): 1–5. https://doi.org/10.1029/2008GL036942.
Supplementary material
Appendix A: Slab sinking rates
DA70 surface subducting plate velocity (Vsp) together with the slab sinking
velocities at a depth of 250 km: horizontal component (Vx), the vertical
Appendix B: Graphical plots of density anomalies and upper plate deformation from Table 2
i) Trench retreat velocity against density anomaly. ii) Maximum width of upper plate deformation against density anomaly. iii) Maximum discrepancy between Vup and Vtr against maximum width of upper plate deformation.
Appendix C: Slab buckling
DA70 slab buckling at t = 7.8 Myr due to the slab sinking faster than slab tip advance. We stop our analysis before slab buckling starts to avoid misinterpreting artificial upper plate deformation caused by the buckle.
Appendix D: Slab tip advance and velocity
Slab dynamics for DA70 using a threshold temperature 1300 K: a) slab tip location and b) slab tip, subducting plate, and trench retreat horizontal velocity through time.
Appendix E: Slab dip and trench retreat velocity
DA70 and the reference simulation slab dip angle and trench retreat
evolution the time. The average slab dip angle is calculated using the 1200 K isotherm between
Appendix F: Slab rollback velocity
DA70 trench retreat velocity compared with horizontal slab rollback velocities calculated at 200, 300 and 400 km depth.
Appendix G: Relative dynamic pressure
DA70 dynamic pressure calculated relative to the column on the right side of the model (X = 6000 km). Plot shown at 4.8 Myr (t3 ).
Appendix H: Test model with a lower mantle
Test model with a high-viscosity (10-fold) lower mantle extending from 660 km to 2000 km depth. The block density anomaly of + 70 kg/m3, with same
dimensions as in DA70, is inserted in the slab at after 50 Myr of subduction (similar slab length as in DA70 after 35 Myr).
Appendix I: Free surface evolution