COMES et al. Early Warning and Decision Support Systems
Long Paper – Decision Support Systems
Beyond Early: Decision Support for
Improved Typhoon Warning Systems
Tina COMES
Centre for Integrated Emergency
Management (CIEM),
University of Agder,
Norway
[email protected]
Brice MAYAG
LAMSADE,
Paris-Dauphine University,
France
[email protected]
Elsa NEGRE
LAMSADE,
Paris-Dauphine University,
France
[email protected]
ABSTRACTWarnings can help prevent damage and harm if they are issued timely and provide information that help responders and population to adequately prepare for the disaster to come. Today, there are many indicator and sensor systems that are designed to reduce disaster risks, or issue early warnings. In this paper we analyze the different systems in the light of the initial decisions that need to be made in the response to sudden onset disasters. We outline challenges of current practices and methods, and provide an agenda for future research. To illustrate our approach, we present a case study of Typhoon Haiyan. Although meteorological services had issued warnings; relief goods were prepositioned; and responders predeployed, the delivery of aid was delayed in some of the worst hit regions. We argue for an integrated consideration of preparedness and response to provide adequate thresholds for early warning systems that focus on decision-makers needs.
Keywords
Early warning systems, decision support, vulnerability assessment, indicator framework, Typhoon Haiyan, disaster response
INTRODUCTION
Timely information has been described as key to disaster response (IFRC 2014, Kamissoko et al. 2014,b). Understanding and adequately reacting to early warning signs, before these become manifest and turn into acute needs is in many cases more effective and efficient than responding only after a disaster hit (Swithern, 2014). Ideally, early warning signals should trigger appropriate actions to prevent harm from the population, such as evacuation, or to get ready to respond, such as pre-positioning of goods and deployment of responders
Today, the world is suffering from violence and conflict; resource scarcity; epidemics; and natural hazards such as floods, storms, or earthquakes. Depending on the nature of the disaster, signals, and how to interpret them as
COMES et al. Early Warning and Decision Support Systems
Long Paper – Decision Support Systems
well as the time for safe intervention (window of opportunity) will vary. In this paper, we focus exclusively on sudden onset disasters and present a case study analysing the initial response to Typhoon Haiyan that hit the Philippines in 2013. In this case study, we combine findings from field research and almost 40 interviews with responders (Van de Walle & Comes 2014; 2015) with theoretical findings on indicator systems used for preparedness and (early) warnings. Besides drawing from academic literature on vulnerability, Early Warning Systems (EWS), and decision analysis, we refer to publications of UN agencies on Haiyan, the Philippines government, and meteorological services that allow us to trace how the warnings triggered the response. The preparation for and response to disasters requires well aligned information flows; decision processes; and coordination structures (Quarantelli, 1988, Kamissoko et al., 2014b). Yet, the information management and decision-making processes dedicated to preparedness are most often separate from the response (Tomasini & Van Wassenhove, 2009).
“We accept chaos to start operations”, one interviewee from the ICRC told us in Guiuan in December 2013 (Van de Walle & Comes, 2015). In this paper, we analyze how the response to Typhoon Haiyan was initiated, and why the damages were so massive, despite the alerts. We start from a comparison of the systems used in the preparedness and response phase. In a previous conceptual paper (Comes, Mayag, & Negre, 2014), we have suggested to investigate the dependence of the different indicators used for EWS and vulnerability assessments. We will show that, indeed the indicators do not overlap, indicating a disconnect between preparedness and response. Moreover, there is no relation to the decisions that need to be taken – and the implications with respect to time available or information required. From there on, we describe how indicator systems and warnings should to be designed to reduce the chaos that seems so characteristic for the early response.
BACKGROUND
Warnings, and the decisions to evacuate the population; deploy disaster relief teams into a region; or pre-position goods, are the interface between preparedness and response. Figure 1 shows that the earlier a warning is, the more time there is to plan and coordinate preventive activities. However, the information about the hazard becomes more accurate as time passes. A typhoon typically starts as a precipitation over sea. As it evolves and approaches land, its path and magnitude can be better predicted, enabling more precise forecasts of damages and needs. Additionally, the threat becomes more concrete and the willingness to act and comply with preventive measures rise, which disrupt day-to-day life and business. Decision-makers need to carefully balance the timing of early warning decisions by taking into account
Intervention points: what are possible actions? How much time is required to perform each action? How much time until disaster will strike?
COMES et al. Early Warning and Decision Support Systems
Long Paper – Decision Support Systems Figure 1. The Context of Early Warning Decisions
EWS are combine the functions of monitoring, decision-making and communication. To this end, they combine communication hardware that must be reliable and robust, especially during the natural disasters; with a communication platform. Ideally, the latter enables interactions among decision-makers, affected population, experts predicting the magnitude and consequences of the disaster, and responders, turning. Communication technology into a key element in early warning (EWC II 2003, Grasso, 2012). Since in sudden onset disasters time is short, messages are often simplified and reduced to a simple “Red Alert”, instead of providing concrete advice and guidance on the next steps or establishing a platform for deliberation.
Vulnerability Assessments
The impact of a disaster is worst, where it hits vulnerable population and regions, or critical infrastructures and economic sectors. Vulnerability describes the susceptibility of a society or system to damages from a hazard event (Bonapace, Srivastava, & Mohanty, 2012; Cardona, 2004; UN/ISDR, 2008). In supply chain management processes are critical, if they are vital for a supply chain’s success (Craighead et al. 2007; Klibi, Martel, & Guitouni, 2010). Here, we define infrastructures or services as critical if their functioning is essential for the society, for instance in terms of protection of the population; environmental targets; or longer term economic development.
Vulnerability and criticality assessments can help focus early warning decisions. Depending on the nature of aims, different facets can be emphasized: vulnerability can focus on specific socio-demographic aspects, such as age, or health (Adger, 2006; Weichselgartner & Kasperson, 2010); economic development (Cannon & Müller-Mahn, 2010; Ingram, Franco, Rio, & Khazai, 2006; Merz, Hiete, Comes, & Schultmann, 2012); or (critical) infrastructures (Egan, 2007; Wang, Hong, & Chen, 2012). Other branches address the vulnerability of geographical regions against specific hazards, often focusing on protection of coastal regions against floods or storms (Adger, 1999; Grünthal et al., 2006; Judge, Overton, & Fisher, 2003; Torresan et al., 2008).
Although vulnerabilities are typically measured on cardinal scales, the values are used to establish ordinal vulnerability rankings that enables decision-makers to prioritize regions, sectors or communities that require most attention and protection. Yet, to our best knowledge there are currently no systems that explicitly take into account planned interventions and actions in the acute phase of a disaster or emergency when setting up the vulnerability assessments and scales.
Early-Warning Systems (EWS)
Early-warning is the provision of timely and effective information that allows organizations and individuals to take action to avoid or reduce their risk and prepare for effective response (Hyogo, 2005). Although EWS are specific to the context, some general principles have been defined by Glantz (2004): continuity in operations, timely warnings, transparency, integration, human capacity, flexibility, and neutrality – partially matching the humanitarian principles humanity, neutrality, impartiality and independence. According to the UN (2006) and the Public Entity Risk Institute (2010), a complete and effective EWS comprises four elements: risk knowledge; monitoring and warning service; dissemination and communication; and response capability. Failure of any part of the system will imply failure of the whole system. Since we are interested in the design of EWS, we focus on risk knowledge, which takes into account prior knowledge of the risks and planning of the control system in terms of sensors, measures, scales, and thresholds.
To issue precise and adequate warnings, EWS need to combine current and local information with knowledge from past events, static structures, and trends (Schrodt and Gerber, 1998; MEA, 2003). In order to provide relevant and actionable information EWS need to be user-centred, interoperable and facilitate interactions between decision-makers, and stakeholders (Hall, 2007; Hyogo, 2005). In an era that is characterised by international collaborations (Engel et al., 2010) respecting the different requirements and information sharing protocols of the involved organizations and actors has become more challenging than ever before (Swithern, 2014). Hence, there is a need for transparent and structured processes that support the design of EWS and take into account
- Societal and organizational preferences, requirements, and protocols; - Vulnerabilities and criticalities of potentially affected regions;
COMES et al. Early Warning and Decision Support Systems
Long Paper – Decision Support Systems MEASURINGTHEFUTURE-TYPHOONINDICATORSYSTEMS
Indicators help decision-makers turn abstract concepts such as vulnerability into concrete guidance on where to focus attention and resources. Yet, there is no consensus on which indicators should be used for which purpose, and how the values of indicators as diverse as Atmospheric Moisture and Corruption Level should be combined to provide support disaster responders.
Indicators and Thresholds
An indicator is a decision support tool that helps decision-makers breaking complex problems down into small and measurable portions, focusing on the most important aspects of a situation. Indicators can be qualitative or quantitative; some indicators are themselves aggregate indices. The usefulness of an indicator depends primarily on its ability to reflect the intended aspect of reality, but also its ease of acquisition and understanding. An effective indicator must satisfy several criteria:
Robust, reliable, accurate and specific: interpretation is stable and consistent over time Sensitive: reflects changes in what is measured or synthesized
Understandable, simple and usable by all stakeholders Relevant relative to the objective
Acceptable cost compared to the service rendered Useful: adding information to the decision-making
To be operational, an indicator is delivered with a simple rule to interpret its meaning. One of the most well known indicators is certainly climate change, where there are fierce debates about to which threshold global warming needs to be limited, to avoid uncontrollable damage. For a guideline on how to derive such threshold for meteorological phenomena, see (Guzetti et al. 2007). Knowledge and experience about the meaning and significance of the indicator, and its values or its interplay with other indicators need to be available to determine a threshold, corresponding to the limit between satisfactory and unsatisfactory or acceptable and unacceptable conditions.
Vulnerability Indicator Systems
Owing to the abstract nature and ambiguity of the concept, indicators in many cases have defining character, and determine our understanding of what vulnerability is, rather than providing a scale to measure it. Typically, hierarchical composite indicator frameworks are used, which combine qualitative and quantitative aspects (Birkmann, 2007; Cutter, 2003), for instance breaking down the vulnerability of a region against a hazard into the dimensions
1. Geography and environmental conditions; 2. Socio-Economic capacity, infrastructure systems; 3. Response capacity.
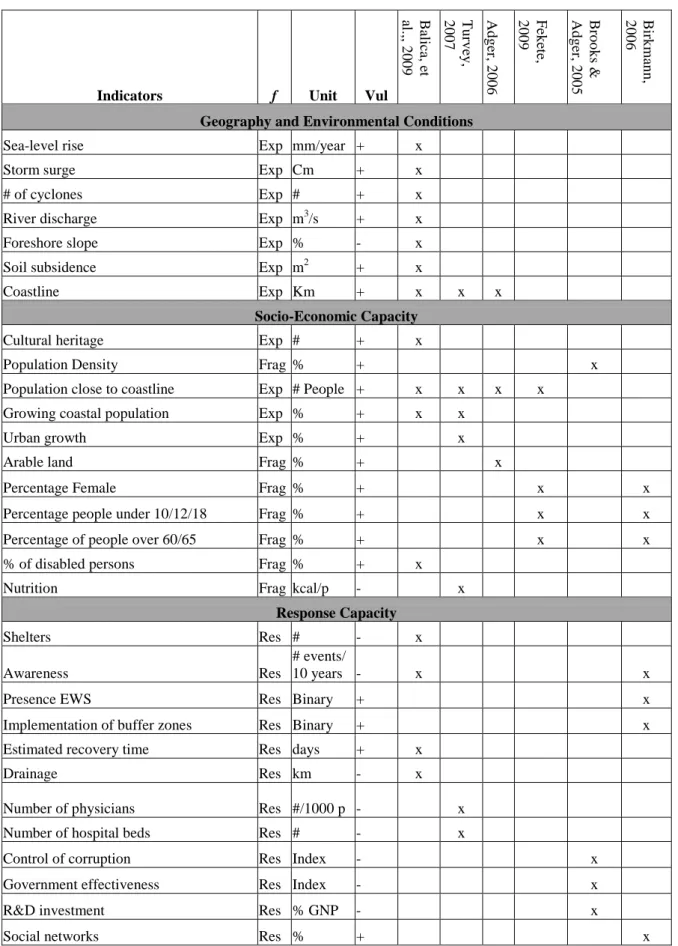
Procedures for indicator selection balance theoretical views on vulnerability with pragmatic considerations of data collection and availability of information (Birkmann, 2007). In Table 1, we provide an overview indicators relevant for Typhoon Haiyan. The table is based on a survey of papers focusing on vulnerability of coastal regions or islands against storms and floods. From an initial set of more than 47 papers that we found via a google scholar search, we than extracted those that provided an indicator system: (Adger, 2006; Balica, Douben, & Wright, 2009; Birkmann, 2006; Brooks, Neil Adger, & Mick Kelly, 2005; Fekete, 2009; Turvey, 2007). Per indicator we provide also the functional relation to vulnerability (increasing (+) or decreasing (-)) and its category: exposure (Exp), fragility (Frag) or resilience (Res).
Interestingly, most authors focus on the socio-economic capacity: indicators characterizing the vulnerability of the population, and its proximity to the area at risk are among the most frequent indicators. For the geographical and environmental conditions, the coastline is the only indicator used by several authors. This may be related to the fact that the indicators in this category relate to the exposure, which is not always understood as component of vulnerability. The indicators for response capacity are unique for each paper, indicating the fragmented understanding of how the ability to manage and respond to a disaster can be predicted. Interestingly, international interventions and the ability to coordinate with the UN system or international volunteer
communities, for instance, are completely missing, highlighting that preparedness is still understood as a local or national endeavour.
COMES et al. Early Warning and Decision Support Systems
Long Paper – Decision Support Systems
Table 1: Selection of Typhoon Relevant Vulnerability Indicators
Indicators f Unit Vul
B alica , et al. ,, 2 0 0 9 T u rv ey , 2007 Ad g er , 2 0 0 6 Fek ete, 2009 B ro o k s & Ad g er , 2 0 0 5 B ir k m an n , 2006
Geography and Environmental Conditions
Sea-level rise Exp mm/year + x
Storm surge Exp Cm + x
# of cyclones Exp # + x
River discharge Exp m3/s + x
Foreshore slope Exp % - x
Soil subsidence Exp m2 + x
Coastline Exp Km + x x x
Socio-Economic Capacity
Cultural heritage Exp # + x
Population Density Frag % + x
Population close to coastline Exp # People + x x x x
Growing coastal population Exp % + x x
Urban growth Exp % + x
Arable land Frag % + x
Percentage Female Frag % + x x
Percentage people under 10/12/18 Frag % + x x
Percentage of people over 60/65 Frag % + x x
% of disabled persons Frag % + x
Nutrition Frag kcal/p - x
Response Capacity
Shelters Res # - x
Awareness Res
# events/
10 years - x x
Presence EWS Res Binary + x
Implementation of buffer zones Res Binary + x
Estimated recovery time Res days + x
Drainage Res km - x
Number of physicians Res #/1000 p - x
Number of hospital beds Res # - x
Control of corruption Res Index - x
Government effectiveness Res Index - x
R&D investment Res % GNP - x
COMES et al. Early Warning and Decision Support Systems
Long Paper – Decision Support Systems
Access to information Res #Radios + x
Table 1 also shows that typically, indicators provide a static snapshot of the situation. Mostly, indicators are based on statistical data on a national or broader regional scale, or indices (such as Government effectiveness). Trends and patterns, such as steep decline of the health care system, or deterioration of living conditions cannot be detected with such systems.
Due to the variety of indicators, measured on different scales, a normalization process turning the data into comparable information is required. Most commonly, an indicator si is be normalised using a fragility function fid indicating to which extent value v(si) of indicator i will increase or reduce the vulnerability in one of the above dimensions d. Typically, [ ] , where 1 represents total vulnerability, whereas 0 indicates that there is no contribution to the vulnerability within this dimension. Resilience and exposure functions are designed similarly (Merz et al., 2012). To model how indicators for different dimensions contribute to the overall vulnerability, they are aggregated first intra-, then inter-dimensional. The most common approach is using a linear aggregation function. Nanduri et al. (2002) provide an overview of alternative models.
Early-Warning Indicator Systems
In general, the indicators of typhoon EWS are only used during the monitoring phase before the disaster. Warnings in this context are based on meteorological forecasting models. Often, meteorologists refer to these as the “spaghetti models” because when laid out on a map, the storm paths resemble strings of spaghetti. To monitor a typhoon, the EWS usually take into account some key indicators, identified by Gray (1975), such as sea surface temperatures above 26°C; moist tropical atmosphere; broad-scale convection; low-level inflow with upper outflow and weak vertical wind shear.
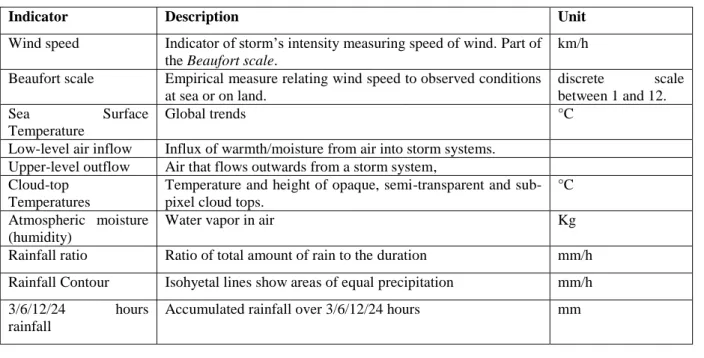
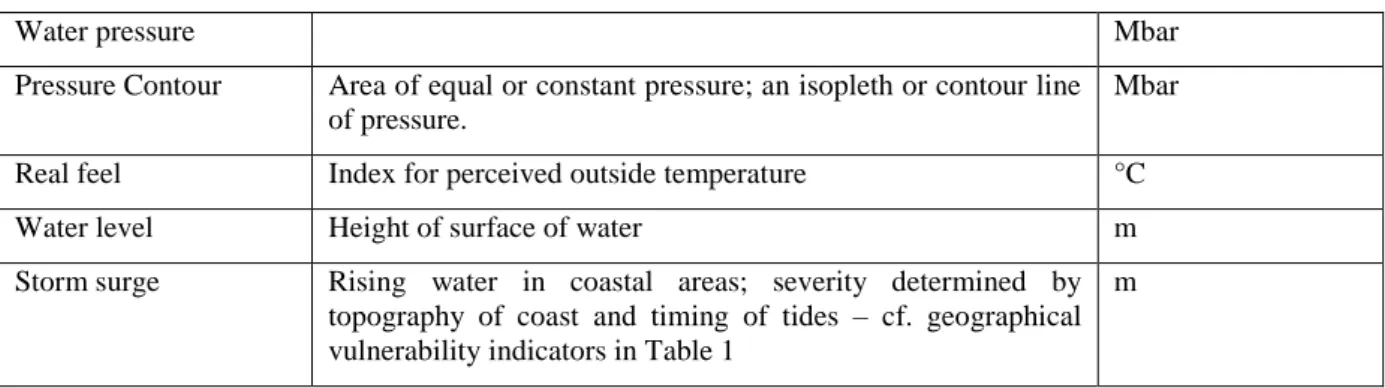
After a desk review and literature research (NOAH Project, 2014; Ng, 2014; Neussner, 2009; Briones, 2014; Neussner, 2014), we selected in Table 2 a list of indicators that were used in the response to Typhoon Haiyan. This list reflects our understanding, resulting from academic literature, project reports, evaluations, satellite imagery (PAGASA cyclone map, meteo Doppler1 for precipitations), and news reports. Other signals, such as changing tides, anxious animals, rumours, and word of mouth, rely on sensual and first hand impressions, that were not accessible to us. We are aware that the list is not complete in this respect. Some satellite pictures were useful ut also some indicators such as the ones presented in the next table.
Table 2: Typhoon Early Warning Indicators
Indicator Description Unit
Wind speed Indicator of storm’s intensity measuring speed of wind. Part of the Beaufort scale.
km/h Beaufort scale Empirical measure relating wind speed to observed conditions
at sea or on land. discrete scale between 1 and 12. Sea Surface Temperature Global trends °C
Low-level air inflow Influx of warmth/moisture from air into storm systems. Upper-level outflow Air that flows outwards from a storm system,
Cloud-top Temperatures
Temperature and height of opaque, semi-transparent and sub-pixel cloud tops.
°C Atmospheric moisture
(humidity)
Water vapor in air Kg
Rainfall ratio Ratio of total amount of rain to the duration mm/h Rainfall Contour Isohyetal lines show areas of equal precipitation mm/h 3/6/12/24 hours
rainfall
Accumulated rainfall over 3/6/12/24 hours mm
1
A weather radar is a type of radar used in meteorology to locate precipitation, calculate their movement and determine their type (rain, snow, hail, etc.). The three-dimensional structure of the data obtained allows inferring the movements of clouds and precipitation in and identifying those that may cause damage. Finally, using rainfall as tracers, we can deduce the radial direction and speed of winds in the lower atmosphere.
COMES et al. Early Warning and Decision Support Systems
Long Paper – Decision Support Systems
Water pressure Mbar
Pressure Contour Area of equal or constant pressure; an isopleth or contour line of pressure.
Mbar
Real feel Index for perceived outside temperature °C
Water level Height of surface of water m
Storm surge Rising water in coastal areas; severity determined by topography of coast and timing of tides – cf. geographical vulnerability indicators in Table 1
m
Comparing Tables 1 and 2, there is no overlap between the indicators, although the problems are interrelated: EWSs should provide timely estimates of potential risks to protect the most vulnerable people and to prepare for replacing the most vulnerable infrastructures (cf. Figure 1). Moreover, the vulnerability indicators hide the time dimension; important trends or relations between the indicators are neglected, whereas most EWS indicators capture a development in a given amount of time.
Some steps towards integrating real-time forecasting into EWS have ben made. For instance, the Hurricane component of FEMA’s HAZUS Model provides prediction models based on wind-induced loads, building response, damage, and then loss, rather than simply using historical loss data to model loss as a function of wind speed, (Chung et al., 2011). Such a model, however, require complete and reliable data sets on building
infrastructure, economy, and population. More importantly even, there is no clear indication which actions the population, or a humanitarian organization should take, and there is no structure component to reconcile the conflicting preferences and orchestrate the response.
THERESPONSETOTYPHOONHAIYAN
The Philippines are confronted with some of the highest disaster risks worldwide: with respect to earthquakes, storms, and flooding it is ranked among the 10 countries with highest mortality (Mosquera-Machado & Dilley, 2008). Therefore, levels of preparedness are relatively high (Brower, Magno, & Dilling, 2014). The Philippines Disaster Risk Reduction and Management Act of 20102 shapes the preparedness and response operations in the Philippines, assigning the role of coordination to the National Disaster Risk Reduction and Management Council (NDRRMC).
Early Warnings
Table 3 summarizes relevant EWS indicators, the categories and respective thresholds used for Typhoon Haiyan (CEDIM, 2013; Weather Unisys, 2013; NOAA, 2013; AGORA, 2013a,b,c).
Table 3: Early Warning Indicators and Thresholds for Haiyan
2 See http://www.ifrc.org/docs/idrl/878EN.pdf
Warnings Indicators Levels Thresholds
Storm surge warnings Storm surge
1 . < 2m
2 2m < . < 5m
3 . > 5m
Flood warnings 24-hours rainfall
1 < 129mm
2 129mm < . < 240mm
3 . > 240mm
COMES et al. Early Warning and Decision Support Systems
Long Paper – Decision Support Systems
Haiyan was first noticed as a weather disturbance with the potential of developing into a tropical storm on 3 November 2013 (Neussner, 2014), Indeed, by exceeding all relevant thresholds, EWS in South Eastern Asia, predicted that Haiyan would severely harm the provinces of Leyte and Eastern Samar. Early warnings were issued two days before Haiyan’s landfall by PAGASA (Philippines Atmospheric Geophysical and Astronomical Services Administration) and JTWC (Joint Typhoon Warning Centre). On November 7th, 2013, the Japan Meteorological Agency top windspeeds of 315 km/h (Neussner, 2014). Few hours later, Haiyan made its first landfall in the Philippines at Guiuan, Eastern Samar, without losing intensity. Haiyan reached level 3 of storm surge (5.2 m in Tacloban Airport (PAGASA, 2014)), level 3 for flood warning, level 5 for wind speed (230 km/h and 315 km/h, (PAGASA, 2014)), the level "Red" for heavy rain warning and all 4 levels of Public Storm Warning Signal were triggered by region (NASA, 2014)).
Despite these warnings, initial reports estimated 4.3 million people to be affected by Typhoon Haiyan. Later, the number rose later over 14 million people, of which more than 4 million lost their homes and livelihoods3. From Early Warning to Response – A role for Vulnerability Assessment and Decision Analysis Although the impact could not be precisely predicted, massive damage was expected. In the transition phase from warning to response, the Department of Social Welfare and Development (DSWD) engaged with local municipalities to evacuate families in particularly exposed areas, identified adequate evacuation centers or reinforced the roofs of buildings4. The military was activated, volunteers were deployed; transportation systems and trucks pre-positioned and food packages and medical aid kits were packed (NDRRMC Sit Rep No. 4). The ASEAN states sent an AHA team to Manila to prepare for the response, and several NGOs that were already active in the country such as ICRC prepared to respond onsite. The Digital Humanitarian Network (DHN) was activated by UN-OCHA on November 7, 2013. Members of the DHN network and the larger Virtual and Technology community mobilized. MapAction, Humanitarian Open Street Map, GIS Corps, ESRI Disaster response Program, Translators and Statistics without Borders, Info4Disaster and many others activated their networks, working remotely or sending volunteers into the disaster struck area.
Dispatching and deploying decisions need to be made quickly, using forecasts and preliminary assessments as well as professional experience and context-based knowledge. Decisions in this phase are therefore are necessarily based on uncertain and incomplete information that cannot be verified until after the disaster. National authorities appeared to be highly aware of needs and had accurate baseline information. Many interviewees during the field visit of the DRL team (Chan & Comes, 2014; Van de Walle & Comes, 2014), described these strengths, which were considered as “of extraordinary quality as compared to other disasters”. However, Common Operational Datasets (CODs) needed to be improved and completed during the response. Because of the high pressure, this happened often in parallel in government agencies and by NGOs (Ebener,
3 UN OCHA situation report number 34, as of January 28 2014
http://reliefweb.int/report/philippines/philippines-typhoon-haiyan-situation-report-no-34-28-january-2014 4http://www.gov.ph/2013/11/06/dswd-preps-for-possible-impact-of-storm/ Signals (PAGASA, 2014) expected within period of time 2 60-100 km/h within 24 hours 3 100-185 km/h within 18 hours
4 Greater than 185 km/h within 12 hours
Saffir-Simpson
hurricane wind scale Top wind speed
1 33-42m/s, 119-153 km/h
2 43-49 m/s, 154-177 km/h
3 50-58 m/s, 178-208 km/h
4 58-70 m/s, 209-251 km/h
5 >70 m/s, > 252 km/h
Heavy Rain warning (PAGASA, 2014; Palafox, 2014) Observed rainfall and rainfall amount from Doppler radars
1 - Yellow 7.5-15 mm within 1 hour ; most likely to continue for next 3 hours.
2 - Orange
15 - 30 mm within 1 hour ; most likely to continue; or continuous rainfall for past 3 hours is more than 45 mm to 65 mm.
3 - Red More than 30mm within 1 hour or continuous rainfall for past 3 hours with more than 65mm.
COMES et al. Early Warning and Decision Support Systems
Long Paper – Decision Support Systems Castro, & Dimailig, 2014).
The fact that most pre-deployed staff and goods were routed to the hubs of Manila and Cebu instead of to the most vulnerable areas such as the rural areas of Leyte and Eastern Samar, implied that goods arrived particularly late in the hardest hit regions. Additionally, efforts to reinforce buildings came too late to have a considerable impact, highlighting the importance of taking into account the temporal aspects and intervention windows. Therefore, we propose a decision analytical approach that takes into account EWS and vulnerability information to initiate the response.
DISCUSSION,CONCLUSIONANDOUTLOOK
Typhoon Haiyan highlighted the lack of effectiveness of current EWS: it had been clearly understood that the damages would be massive some days before the Typhoon made landfall5. However, the problems with communications of the storm surge and the lack of shelters prevented many people from seeking, or if they sought, in finding safe shelters –resulting in the death of hundreds (Heydarian, 2013). The vulnerability of population and critical infrastructures such as healthcare, communication, or food and water supply has not been integrated into, making it difficult to predict where help will be needed most urgently. To this date, the early response decisions are largely based on experience instead of structured decision support (Van de Walle & Comes, 2014)..
EWS are designed to initiate the response. Yet, simple warnings about the nature of an event are not sufficient. Rather, the warning should reflect the context and possible mitigation measures that the decision-makers can choose, such as reinforcing shelters and setting up emergency telecommunication systems; pre-positioning fleet of trucks, food and water supplies; evacuation; and activation of the local or international response. Since these strategies determine when a warning should be issued, and which information it needs to convey, EWS can no longer be understood as a binary problems, where the decision consists in issuing an alert (or not).
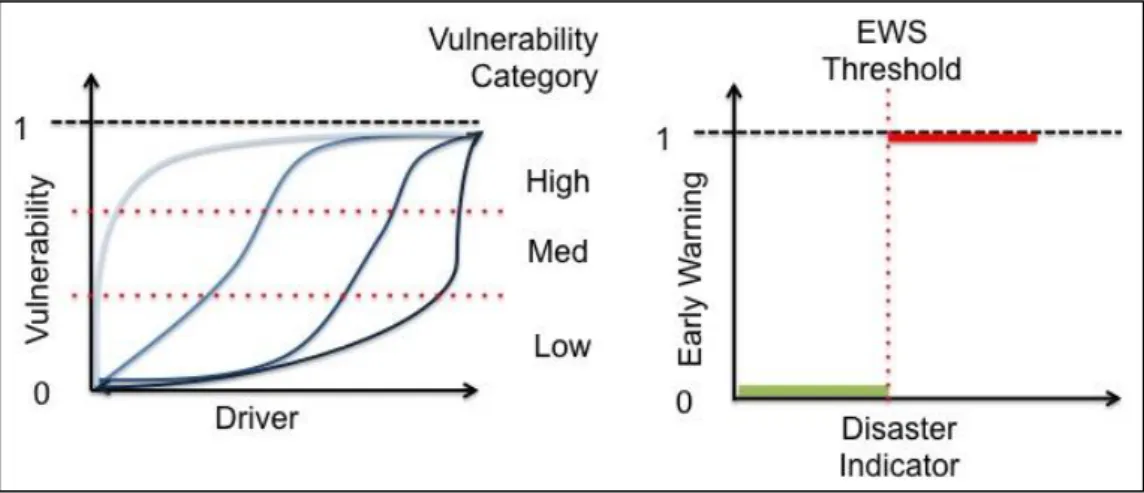
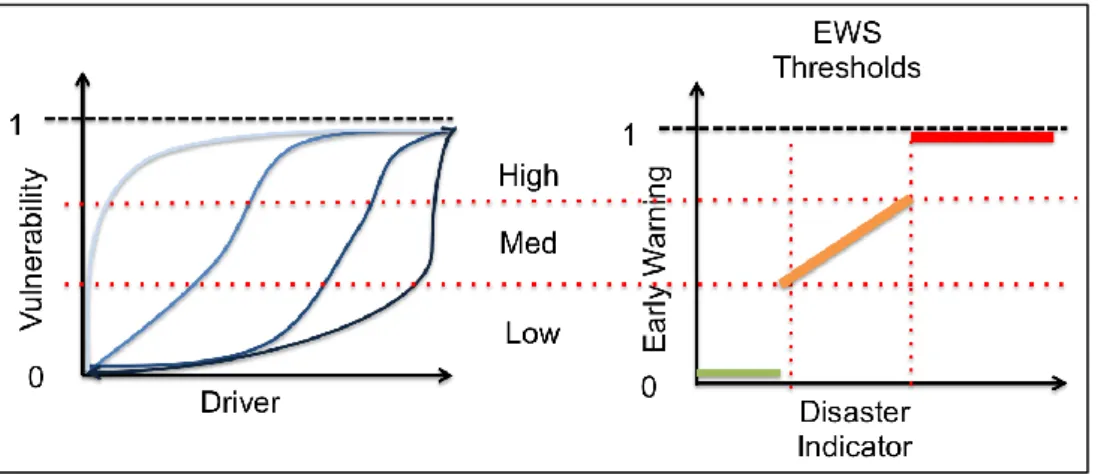
Figure 3: Isolated Vulnerability Assessments (left) and EWS (right)
Figure 3 shows the situation as it is today. On the basis of continuous vulnerability functions, categories are formed that are used to prioritise disaster risk reduction efforts and allocate resources, focusing mostly on longer-term development aims. Contrarily, EWS thresholds are often defined in terms of a simple binary scale, reflecting tipping points above which an intervention (of unclear nature) is necessary. There is currently no systematic or explicit integration between both.
To ensure that warnings respect the preparation times (from an alert to completed preventive action), we propose to elaborate a decision model that uses vulnerability and EWS indicators as well as potential
interventions to determine appropriate thresholds that take into account the local context. The concept is shown in Figure 4, which outlines that the different vulnerability levels should be aligned with the EWS thresholds. Warnings are not issued any more on basis of a simple step function; rather we envision various levels with intrinsic continuous escalations (see Figure 4).
COMES et al. Early Warning and Decision Support Systems
Long Paper – Decision Support Systems
Figure 4: Our Vision: Interplay of Vulnerability (left) and EWS (right)
For both systems, we would like to emphasize the importance to define warnings as an interpretation of the values given by an aggregation function combining both indicators of EWS and vulnerability. While Figures 3 and 4 only show individual indicators, the overall vulnerability or warning decision should take into account the interplay of indicators. For instance, one can elaborate an overall score of vulnerability; derive thresholds; and then combine these with respective overall scores of EWS indicators. The simple aggregation function usually used is the weighted sum where weights associated to indicators can be determined according to the preferences of government authorities and experts in EWS and vulnerabilities. In this way, preferential information about the most critical aspects for the society can be combined with the information about expected impact and damage of a hazard.
REFERENCES
Adger, W. N. (2006) Vulnerability. Global Environmental Change, 16, 3, 268–281.
AGORAa (2013a) http://agora.ex.nii.ac.jp/digital-typhoon/summary/wnp/l/201330.html.en, accessed 14.12.13 AGORAb (2013b) http://agora.ex.nii.ac.jp/digital-typhoon/summary/wnp/k/201330.html.en, accessed 14.12.13 AGORAc (2013c) http://agora.ex.nii.ac.jp/digital-typhoon/summary/wnp/s/201330.html.en, accessed on
27.12.2013
Balica, S., Douben, N., & Wright, N. (2009) Flood vulnerability indices at varying spatial scales. Water Science and Technology : A Journal of the International Association on Water Pollution Research, 60, 10, 2571– 80.
Birkmann, J. (2006) Measuring Vulnerability To Natural Hazards. TERI, New Delhi, 9-53.
Birkmann, J. (2007) Risk and vulnerability indicators at different scales: Applicability, usefulness and policy implications. Environmental Hazards, 7, 1, 20–31.
Bonapace, T., Srivastava, S., & Mohanty, S. (2012) Reducing vulnerability and exposure to disasters: Asia-Pacific disaster report 2012. ESCAP and UNISDR, Bangkok.
Briones, J. (2014) Case Study : Typhoon Haiyan in the Philippines. Lower Mekong Initiative Workshop, Hanoi. Brooks, N., Adger, N., & Kelly, M. (2005) The determinants of vulnerability and adaptive capacity at the
national level and the implications for adaptation. Global Environmental Change, 15, 2, 151-163. Brower, R. S., Magno, F. A., & Dilling, J. (2014) Evolving and Implementing a New Disaster Management
Paradigm: The Case of the Philippines. Kapucu & Liou (Eds.), Disaster and Development,. Springer, Berlin , 289–313.
Cannon, T., & Müller-Mahn, D. (2010) Vulnerability, resilience and development discourses in context of climate change. Natural Hazards, 55, 3, 621–635.
Cardona, O. (2004) The Need for Rethinking the Concepts of Vulnerability and Risk from a Holistic Perspective: A Necessary Review and Criticism for Effective Risk Management. Bankoff, Frerk, & Hillhorst (Eds.), Mapping Vulnerability: Disasters, Development and People, Earthscan Publications, London, 289–313.
COMES et al. Early Warning and Decision Support Systems
Long Paper – Decision Support Systems
Cedim (2013) Super Typhoon Haiyan / Yolanda. Forensic Disaster Analysis Group, Report No. 2, as of 13.11.2013
Chan, J., & Comes, T. (2014) Innovative Research Design – A Journey into the Information Typhoon. Procedia Engineering, 78, 52–58.
Chung Yau, S., Lin, N., and Vanmarcke, E. (2011). Hurricane Damage and Loss Estimation Using an Integrated Vulnerability Model. Natural Hazards Review 12, SPECIAL ISSUE: Hurricanes and Insurance, 184–189. Comes, T., Mayag, B., & Negre, E. (2014). Decision Support for Disaster Risk Management: Integrating
Vulnerabilities into Early-Warning Systems. Information Systems for Crisis Response and Management in Mediterranean Countries, Springer International Publishing, 178-191.
Craighead, C.,, Blackhurst, J., Rungtusanatham, M., & Handfield, R. (2007) The Severity of Supply Chain Disruptions: Design Characteristics and Mitigation Capabilities. Decision Sciences, 38, 1, 131–156.
Cutter, S. L. (2003) GI Science, Disasters, and Emergency Management. Transactions in GIS, 7, 4, 439–446. Ebener, S., Castro, F., & Dimailig, L. (2014) Increasing Availability, Quality, and Accessibility of Common and
Fundamental Operational Datasets to Support Disaster Risk Reduction and Emergency Management in the Philippines. Manila.
Egan, M. (2007). Anticipating Future Vulnerability: Defining Characteristics of Increasingly Critical Infrastructure-like Systems. Journal of Contingencies and Crisis Management, 15, 1, 4–17. Engel, B. Quansah, J., & Rochon, G. (2010) Early warning systems: A review. Journal of Terrestrial
Observation, 2, 5, 24-44.
EWC II (2003), Report on Integrating Early Warning into Relevant Policies, Second International Conference on Early Warning, EWC II, 16-18 October, Bonn, 2003.
Fekete, A. (2009). Validation of a social vulnerability index in context to river-floods in Germany. Natural Hazards and Earth System Science, 9, 2, 393–403.
Glantz, M. (2004) Early Warning Systems: Do's and Don'ts. Usable science. The Center Workshop Report, Shanghai, 20-23.
Grasso, V. (2012), Early Warning Systems: State-of-Art Analysis and Future Directions. Draft report. United Nations Environment Programme (UNEP)
Grünthal, G., Thieken, A., Schwarz, J., Radtke, K., Smolka, A., & Merz, B. (2006) Comparative Risk Assessments for the City of Cologne -- Storms, Floods, Earthquakes. Natural Hazards, 38, 1, 21–44. Hall, P. (2007). Early warning systems: Reframing the discussion. Australian Journal of Emergency
Management, 22, 2, 32-36.
Heydarian, R. (2013). Little preparation for a great disasters. Inter Press ServiceReport, Manila. Hyogo Framework for Action (2005) 2005-2015: Building the resilience of nations and communities to
disasters. Extract from the International report of the World Conference on Disaster Reduction, UN ISDR, 2005.
IFRC (2014) Early Warning - Early Action. Mechanisms for Rapid Decision Making. Nairobi, Kenya. Gray, W.M. (1975) Tropical Cyclone Genesis, Fort Collins: Colorado State university, Atmospheric science
paper No. 234
Ingram, J. C., Franco, G., Rio, C. R., & Khazai, B. (2006) Post-disaster recovery dilemmas: challenges in balancing short-term and long-term needs for vulnerability reduction. Environmental Science & Policy, 9, 7-8, 607–613.
Judge, E. K., Overton, M. F., & Fisher, J. S. (2003) Vulnerability Indicators for Coastal Dunes. Journal of Waterway, Port, Coastal, and Ocean Engineering, 129, 6, 270–278.
Kamissoko, D., Zaraté, P., Pérès, F. (2014) Decision process in large-scale crisis management. Environment Systems & Decisions, 34, 2, 277-287.
Kamissoko, D., Zaraté, P., Pérès, F. (2014b) A Decision Support Framework for Crisis Management. In : Impact of New Technologies in Decision-Making for Global Environments. Fatima Dargam, Jorge Hernandez, Pascale Zaraté, Shaofeng Liu, Rita Ribeiro (Eds.), 1-10, Springer LNBIP. .
Klibi, W., Martel, A., & Guitouni, A. (2010) The design of robust value-creating supply chain networks: A critical review. European Journal of Operational Research, 203, 2, 283–293.
MEA (2003) Ecosystems and human well-being: A framework for assessment. Washington DC: Island Press. Merz, M., Hiete, M., Comes, T., & Schultmann, F. (2013) A composite indicator model to assess natural
COMES et al. Early Warning and Decision Support Systems
Long Paper – Decision Support Systems
Mosquera-Machado, S., & Dilley, M. (2008) A comparison of selected global disaster risk assessment results. Natural Hazards, 48, 3, 439–456.
Nanduri, M., Nyboer, J., & Jaccard, M. (2002) Aggregating physical intensity indicators: results of applying the composite indicator approach to the Canadian industrial sector. Energy Policy, 30, 2, 151-163.
Neussner, O. (2009) Manual - Local early warning systems - Experiences from the Philippines. Deutsche Gesellschaft für Technische Zusammenarbeit, Berlin.
Neussner, O. (2014). Manual – Assessment of Early Warning Efforts in Leyte for Typhoon Haiyan/Yolanda. Deutsche Gesellschaft für Internationale Zusammenarbeit (GIZ), Berlin.
Ng, K. (2014). The Philippines government develops disaster early warning system. http://www.un-spider.org/news-and-events/news/philippines-government-develops-disaster-early-warning-system NASA (2014). Evidence of Haiyan’s Damage. National Aeronautics and Space Administration,
http://www.nasa.gov/content/goddard/haiyan-northwestern-pacific-ocean/#.VMkSZC409Xs NOAA (2013), http://sos.noaa.gov/Datasets/dataset.php?id=431 , accessed 14.12.2013
NOAH Project (2014) http://noah.dost.gov.ph/, accessed 02.02.2015
PAGASA, Philippine Atmospheric, Geophysical and Astronomical Services Administration (2014) http://pagasa.dost.gov.ph/
Palafox, M. (2014) Country Report Philippines. In JMA/WMO workshop on effective tropical cyclone warning in Southeast Asia, Tokyo.
PERI (2010) Early warning systems – interdisciplinary observations and policies from a local government perspective - four elements of people centered early warning systems. Public Entity Risk Institute Symposium, Fairfax.
Quarantelli, E. L. (1988) Disaster Crisis Management: A Summary of Resarch Findings. Journal of Management Studies, 25, 4, 373–385.
Schrodt, P., & Gerber , D. (1998) The impact of early warning on institutional responses to complex humanitarian crises. 3rd Pan-European International Relations Conference, Vienna.
Swithern, S. (2014) Global Humanitarian Assitance Report. New York.
Tomasini, R., & Van Wassenhove,L. N., (2009) Humanitarian Logistics. Palgrave MacMillan, Basingstoke Torresan, S., Critto, A., Dalla Valle, M., Harvey, N., & Marcomini, A. (2008). Assessing coastal vulnerability to
climate change: comparing segmentation at global and regional scales. Sustainability Science, 3, 1, 45–65. Turvey, R. (2007) Vulnerability Assessment of Developing Countries: The Case of Small-island Developing
States. Development Policy Review, 25, 2, 243–264.
UN (2006) Global Survey of Early Warning Systems: an Assessment of Capacities, Gaps and Opportunities Toward Building a Comprehensive Global Early Warning System for All Natural Hazards: a Report Prepared at the Request of the Secretary-General of the United Nations, New York.
UN/ISDR (2008) Indicators of progress: guidance on measuring the reduction of disaster risks and the implementation of the Hyogo Framework for Action. Geneva, United Nations secretariat of the International Strategy for Disaster Reduction
Van de Walle, B., & Comes, T. (2014) Risk Accelerators in Disasters. Insights from the Typhoon Haiyan Response on Humanitarian Information Management and Decision Support. In M. Jarke, J. Mylopoulos, & C. Quix (Eds.), CAiSE2014 (pp. 12–23). Thessaloniki: Springer Berlin/Heidelberg.
Van de Walle, B & Comes. T. (2015) On the Nature of Information Management in Complex and Natural Disasters, HumTech2015, Boston.
Wang, S., Hong, L., & Chen, X. (2012) Vulnerability analysis of interdependent infrastructure systems: A methodological framework. Physica A: Statistical Mechanics and Its Applications, 391, 11, 3323–3335 Weather Unisys, http://weather.unisys.com/hurricane/w_pacific/2013/HAIYAN/track.dat, accessed 14.12.2013 Weichselgartner, J., & Kasperson, R. (2010) Barriers in the science-policy-practice interface: Toward a
knowledge-action-system in global environmental change research. Global Environmental Change, 20, 2, 266–277.