Registration Code: S-XXXXXXXX
QUANTITATIVE RISK ASSESSMENT METHODOLOGY FOR BUILDING
SELECTION IN RETROFITTING PROCESS
F. Dunand(1), P. Mouroux(2), E. Toussaint(3), E. Fournely(3), S. Bremond(4)
(1)
Fugro-Geoter, f.dunand@fugro.com (2)
AFPS, pierremouroux@aol.com
(3)
Polytech Clermont-Ferrand, Evelyne.TOUSSAINT@univ-bpclermont.fr , (4)
Polytech Clermont-Ferrand, Eric.FOURNELY@univ-bpclermont.fr (4)
Fugro-Geoter, s.bremond@fugro.com
Abstract
Since 2011 French territory has a new seismic zoning including five seismicity areas (very low to high), from which acceleration (PGA) is referring to the design of new buildings with standards Eurocode 8. However seismic regulations apply to existing buildings, often built before its application, only for specific work conditions. With an annual turnover about 2%, the knowledge of existing buildings compliance with seismic design is capital for seismic risk management policy.
In this context, the working group of French Association for Earthquake Engineering (AFPS) was interested in defining a quantitative evaluation method of seismic risk and compliance of existing buildings. The proposed methodology considered a large building number application with only basic vulnerability information. The main goal is obtain a large picture for decision making based on risk criteria with identification in a first step high risk buildings and in a second step compliance to seismic standards.
This communication presents the general procedure of methodology for risk evaluation steps and compliance standards of existing buildings. Application of methodology to French seismic context is shown through different examples.
1. Introduction
Since 2011 French territory has a new seismic zoning including five seismicity areas (very low to high), from which acceleration (PGA) is referring to the design of new buildings with standards Eurocode 8.
However seismic regulations apply to existing buildings, often built before its application, only for specific work conditions. With an annual turnover 2%, the knowledge of existing buildings compliance with seismic design is capital for seismic risk management policy.
In France, reinforcement of the whole buildings designed without taking into account the seismic actions cannot be planned for obvious economic reasons. In this way, the AFPS (French Association of Seismic Engineering) studies and formalises methods for the optimisation of technical and economic performance of reinforcement. In these terms, a method of classification of buildings for priorities of reinforcement is proposed.
This communication introduces the global method for risk evaluation steps and compliance of existing buildings. The assumptions used for each stage and their justification are detailed in a technical report.
2. Seismic risk quantification
The objective of this study is to provide a large-scale risk quantification method adapted to the French situation, which ultimately leads to a classification of buildings according to their risk level (step 1) and an evaluation of their conformity to resistance expected by the standards (step 2). The approach is based on the Swiss methodology technical specifications SIA-2018 (Duvernay, 2005, 2006), on vulnerability/risk assessment tools of the Risk-UE method (Milutinovic et al 2004. Lagomarsino et al . 2006) and on the acceptability limits of risk given by Leroi (2005). The method is proposed with 3 steps:
• Step 1: Risk level analysis of buildings on the basis of the area of seismic hazard implementation, vulnerability and human issue;
• Step 2: For buildings showing significant risk, an analysis of compliance of building over the level of seismic French standard;
• Step 3: For the non-conform buildings, the proposal of a detailed engineering analysis to identify risk reduction measures.
Step 3 is for buildings whose compliance is too low and / or the lack of information on the vulnerability / compliance does not enable to establish a diagnosis with this method. A cost / benefit study is necessary to assess the need for risk reduction measures and guide the decision of the contracting authority as a strengthening or a possible reconstruction. For non-conform buildings, the study must lead to a proposal measuring risk reduction after a feasibility study. This "detailed" analysis step is not developed in this method and communication because it follows specific engineering methods adapted to each case study which are beyond the scope of the proposed method.
There are several analysis levels based on the type of methodology and resources used:
The level N0 is an overall assessment of the behavior of buildings under seismic action, through empirical methods based on large-scale existing data (statistical data, aerial photography, land use maps ...). No direct field reconnaissance is made for this type of analysis;
The level N1 remains similar at N0 since the method of calculating of the vulnerability is also based on empirical methods. The difference lies mainly in the quality of information that requires visual inspections on site, and the use of a classification of detailed buildings (taking into account the structural system);
The last level N2 uses an engineering mechanical analysis via modeling, and seismic hazard represented as a response spectrum. This type of analysis is applicable to individual cases and not on a large scale. The method of risk analysis (step 1) and compliance to standards (step 2) is of N1 level. The detailed engineering analysis (step 3) is the level N2.
2.1 Step 1: Quantification of seismic risk
The step 1 of the method enables a quick classification of buildings according to the risk of human issue. It leads to the identification of buildings that have a high risk potential. This step is applicable in the context of moderate seismicity, characteristic of French territory and is based on a human risk criterion expressed as an annual probability of death regarding to the occupants in zones with different seismic hazard.
Its implementation requires prior information:
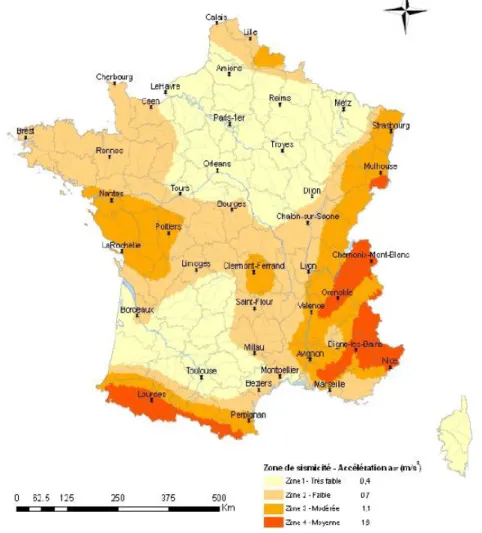
• Building location in regards of continental France seismic zones 1 to 4 , with Pga from 0.04g to 0.16g, to define the seismic hazard;
• Buildings vulnerability expressed as a vulnerability index (Iv) following the Risk-UE methodology (Milutinovic et al 2004. Lagomarsino et al. 2006);
• Building number of occupants.
Risk classification of buildings is ultimately shown on risk abacus regarding the 3 above input parameters. The step 1 provides a summary estimate of human risk, but it can be refined according to the context of the study, the occupancy rate and the available data on vulnerability.
The seismic hazard is considered with hazard curves computed for 40 cities located in the 4 seismic zones of
continental France (Figure 1). The 40 cities are then grouped in seismic zones to take into account hazard variabilities in the different zones.
The vulnerability is considered with the Risk-UE method (Milutinovic et al 2004; Lagomarsino et al, 2006.)
with four vulnerability index (Iv) values: Iv = 0.3: low vulnerability, 0.5: medium vulnerability, 0.7: high vulnerability, and 0.9: very high vulnerability. Risk-UE method proposes vulnerability curves showing damage state probability depending on vulnerability index. Damage state scale is the EMS-98 (Grunthal G. et al. 2001) with 4 damage states from D1 (slight damages) to D5 (full collapse).
The human issues are considered with different building number of occupants, characteristic of individual
houses to large public access buildings: N ∈ {} 5,50,100,300,700,1500. The mortality rate in the case of building collapse (D5 from EMS-98 damage state scale) is set at a value of 0.2 according to Coburn et al (1992, 2002).
The risk is quantified by an annual occurrence probability of a number of casualties among the occupants of a
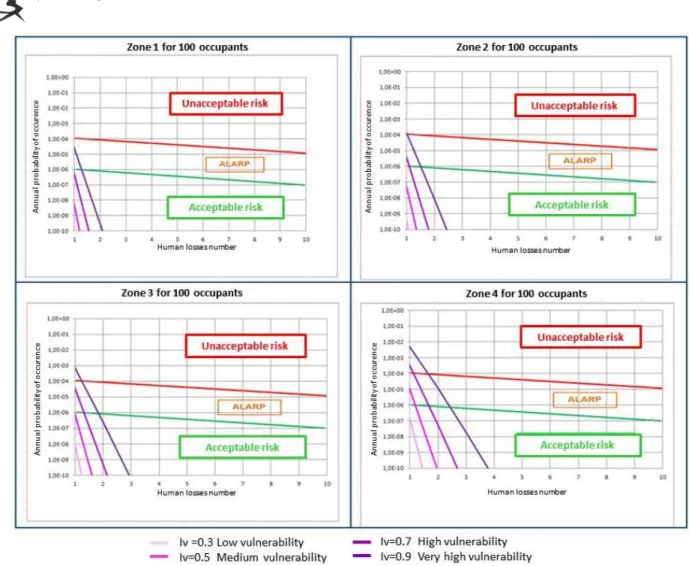
building with a specific vulnerability and located in a specific seismic zone. This quantification is the result of the convolution of seismic hazard curves, vulnerability curves and mortality curves. The risk is finally represented by curves "F / N" (for Frequency or annual probability / number of victims) (Figure 3).
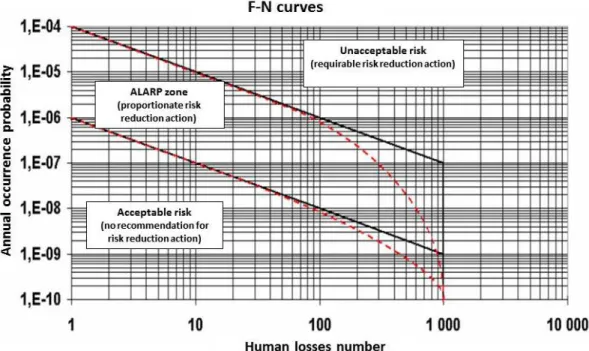
The limits of risk acceptability considered for the step 1 are those defined by Leroi (2005) dividing the risk area in 3 areas (Figure 2):
Unacceptable risk area: it is limited by a lower curve slope of -1 whose the value to the individual risk of 10-4 (annual probability). Any building showing risk above this limit have unacceptable risk and requires risk reduction measures;
Acceptable risk area: the line slope of -1 is clamped to the value of the acceptable individual risk of 10-6 (annual probability). The buildings showing risk below this limit require no action;
Intermediate area named tolerable risk or ALARP area "As Low As Reasonably Practicable". The buildings within the tolerable risk area should be the subject to “proportionate” risk measures.
Abacuses are calculated for each seismic hazard zones (1 to 4), vulnerability classes (low to very high) and building number of occupants (5 to 1500).
As an example, abacus of seismic zone 3 (Figure 3) for a medium vulnerability shows an acceptable risk for 5 and 50 occupants, and ALARP risk for 100 and 300 occupants. Abacus of 100 occupants (Figure 3) for a medium vulnerability shows an acceptable in zone 1 and 2, and ALARP risk in zones 3 and 4.
Figure 4 - Risk abacus for buildings with 100 occupants in seismic zone 1 (PGA=0.04g), 2 (PGA=0.07g), 3 (PGA=1.1g) and 4 (PGA=0.16g).
2.2 Step 2: Conformity assessment
Step 2 aims to highlight buildings with significant seismic risk identified in step 1 (unacceptable or ALARP) according to their conformity to target resistance by regulation. Conformity is set by a dimensionless conformity factor (α) defined as the ratio of acceleration that can generate damages (resistance acceleration) to the reference acceleration (from regulation) at building location.
2.1.1 Resistance acceleration
Buildings’ resistance acceleration is defined as the peak ground acceleration for which there is a probability of a specific damage level. The considered damage level D4 & D5 - respectively partial collapse and full collapse according EMS98’s damage scale (Grunthal and Levret, 2001) - of which the probability P(D4 + D5) is below 10-3 (set low enough). Damage probabilities D4 & D5 are obtained using Risk-UE method (Milutinovic et al 2004. Lagomarsino et al. 2006) with a given vulnerability and a given macroseismic intensity for each building. Risk-UE method providing intensity vulnerability curves, it is considered a conversion law from acceleration to macroseismic intensities (Faenza and Michelini, 2010).
• Risk-UE Vulnerability Index: uncertainty associated with the method is considered with variability in the vulnerability index of ± 0.01;
• Choice of acceptable probability of damage limitation D4 + D5: This value, set at 10-3
is associated with an uncertainty of ± 20%;
• Intensity / acceleration conversion law: uncertainties proposed by Faenza and Michelini (2010) are
considered.
2.1.2 Conformity curves
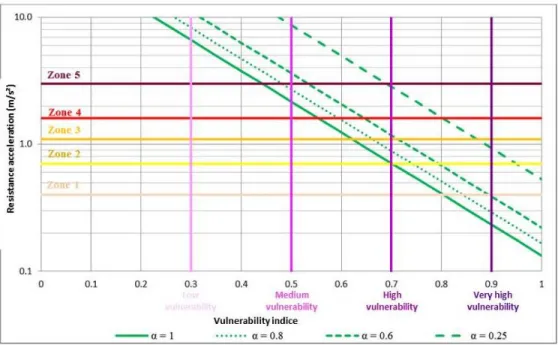
Conformity factor (α) is considered as ratio of resistance acceleration to reference acceleration according to building’s seismic zone. However, it is more appropriate to represent for a given value of α, the resistance acceleration function of the vulnerability index. This representation enables to include both the vulnerability on the x-axis and different reference acceleration on the y-axis (Figure 4).
Representation of uncertainty areas for different conformity factors (1.0, 0.8, 0.6 and 0.25) shows uncertainties are significant and overlapped. This comment leads to consider a maximum of two conformity factors to define acceptable conformity zones.
The Swiss approach (SIA 2018 - Duvernay 2005, 2006) provides two conformity limits:
• 0.25 - limit below which the building is deemed non-conform and requires risk reduction actions; • 0.8 - limit beyond which the building is deemed conform and does not require risk reduction actions;
• Range between 0.25 and 0.8 correspond to buildings for which the risk reduction actions have to be proportionate (cost/benefice analysis).
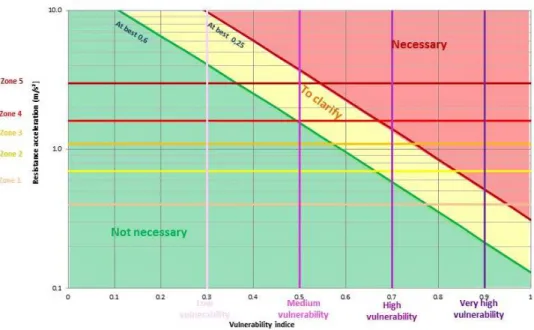
In the French context, regulation considers for existing buildings lower reference acceleration: 0.6 factor - which is equivalent to consider a conformity factor of 0.6. Present method considers limits of 0.25 (as Swiss approach) and 0.6 (for French context) (Figure 6).
The abacus shows the conformity level of a building knowing its vulnerability and its seismic zone (Figure 6). For example, a building with a low vulnerability is conform even in seismic zone 5 and it will not require the implementation of risk reduction actions (Figure 7). A building with a high vulnerability is conform in seismic zone 1, but will require further studies for seismic zone 2 and 3, and will require risk reduction measure in seismic zone 4 and 5. A very high vulnerability building will require risk reduction measures if located in seismic zone 2 to 5 and it will be necessary to conduct further studies to assess its vulnerability if located in seismic zone 1.
Figure 5 - Conformity curve for several values of α.
Figure 7 – Conformity abacus with compliant areas
2. Conclusion
The proposed method is a 3 steps procedure: step 1, is an estimation of human risk according to location, vulnerability and building number of occupants – to guide ones with unacceptable risk in step 2 for an estimation of compliance to standards – to identify ones with low compliance in step 3 for a detailed engineering retrofitting analysis.
The method results in abacus proposal of risk (step 1) and compliance (step 2) based simple information such as the seismic zone location, vulnerability category and number of occupants of buildings.
The proposed method is based on existing tools proposing a complete risk analysis workflow and adapted to the French context (seismic and regulatory protection goals).
Uncertainties related to methods were analyzed and lead to significant variability which should be kept in mind. Despite of these uncertainties, which reflect a large scale tool, this method can be used for a first classification of large number of buildings as a decision making tool.
The method relied heavily on human risk criteria and should be extended to economical risk. Moreover, the working group plans to compare this simplified method with detailed engineering calculations conducted on different types of buildings to assess the validity of the approach.
5. References
[1] Arrêté du 22 octobre 2010 relatif à la classification et aux règles de construction parasismique applicables aux bâtiments de la classe dite « à risque normal » NOR: DEVP1015475A, JORF n°0248 du 24 octobre 2010 page 19097 texte n° 5
[2] Coburn A., Spence R. and Pomonis A. (1992). Factors determining human casualty levels in earthquakes: Mortality prediction in building collapse. Earthquake Engineering Tenth World Conference, Balkema, Rotterdam, p. 5989-5994
[4] Duvernay B. (2005). Vérification de la sécurité parasismique des bâtiments existants : Concept et directive pour l'étape 1. 2ième édition : Office Fédéral des Eaux et de la Géologie, Directives de l'OFEG, 13 p., annexes
[5] Duvernay B. (2006). Vérification de la sécurité parasismique des bâtiments existants : Concept et directive pour l'étape 2. 2ième édition, Office Fédéral de l'Environnement, Directives de l'OFEG, 8 p., annexes
[6] Duvernay B. (2005). Vérification de la sécurité parasismique des bâtiments existants : Concept et directive pour l'étape 3. 1ère édition : Office Fédéral des Eaux et de la Géologie, 15 p., annexes.
[7] EC8 (2005). Eurocode 8 : Calcul des structures pour leur résistance aux séismes - Partie 3 : Evaluation et renforcement des bâtiments. Comité Européen de Normalisation, Norme Européenne, Projet définitif, n° pr EN 1998-3:2005 F, 67 p. [8] Faenza L. and Michelini A. (2010). Regression analysis of MCS intensity and ground motion parameters in Italy and its
application in shakemap. Geophysical Journal International , Vol. 1870, n° 3, p. 1138-1152
[9] Grunthal G. et Levret A. (2001). L'échelle macrosismique européenne 1998 (EMS-98). Ministère de la Culture, de l'Enseignement Supérieur et de la Recherche, Conseil de l'Europe, Cahiers du Centre Européen de Géodynamique et de Séismologie, Vol. 19, 103 p.
[10] Lagomarsino S. and Giovinazzi S. (2006). Macroseismic and mechanical models for the vulnerability and damage assessment of current buildings. Bulletin of Earthquake Engineering, Vol. 4, n° 4, p. 415-443
[11] Leroi E. (2005). Réalisation d’une étude sur les critères pour la définition de mesures de réduction du risque sismique du bâti existant en France. URBATER, rapport final pour le MEDD ref R-URB/MEDD-Vuln/051220-01, 97 p (www.planseisme.fr/IMG/pdf/Rapport_final_URBATER.pdf).
[12] Milutinovic Z. and Trendafiloski G (2003). An advanced approach to earthquake risk scenarios, with applications to different European towns : WP4 – Vulnerability of current buildings. European Commission, Risk-UE, RISK-UE – EVK4-CT-2000-00014, 110 p.
