HAL Id: hal-00301187
https://hal.archives-ouvertes.fr/hal-00301187
Submitted on 5 May 2004HAL is a multi-disciplinary open access
archive for the deposit and dissemination of sci-entific research documents, whether they are pub-lished or not. The documents may come from teaching and research institutions in France or abroad, or from public or private research centers.
L’archive ouverte pluridisciplinaire HAL, est destinée au dépôt et à la diffusion de documents scientifiques de niveau recherche, publiés ou non, émanant des établissements d’enseignement et de recherche français ou étrangers, des laboratoires publics ou privés.
Ultra-violet absorption cross sections of isotopically
substituted nitrous oxide species: 14N14NO, 15N14NO,
14N15NO and 15N15NO
P. von Hessberg, J. Kaiser, M. B. Enghoff, C. A. Mclinden, S. L. Sorensen, T.
Röckmann, M. S. Johnson
To cite this version:
P. von Hessberg, J. Kaiser, M. B. Enghoff, C. A. Mclinden, S. L. Sorensen, et al.. Ultra-violet absorp-tion cross secabsorp-tions of isotopically substituted nitrous oxide species: 14N14NO, 15N14NO, 14N15NO and 15N15NO. Atmospheric Chemistry and Physics Discussions, European Geosciences Union, 2004, 4 (3), pp.2333-2378. �hal-00301187�
ACPD
4, 2333–2378, 2004
Ultra-violet absorption cross
sections
P. von Hessberg et al.
Title Page Abstract Introduction Conclusions References Tables Figures J I J I Back Close
Full Screen / Esc
Print Version
Interactive Discussion
© EGU 2004 Atmos. Chem. Phys. Discuss., 4, 2333–2378, 2004
www.atmos-chem-phys.org/acpd/4/2333/ SRef-ID: 1680-7375/acpd/2004-4-2333 © European Geosciences Union 2004
Atmospheric Chemistry and Physics Discussions
Ultra-violet absorption cross sections of
isotopically substituted nitrous oxide
species:
14
N
14
NO,
15
N
14
NO,
14
N
15
NO and
15
N
15
NO
P. von Hessberg1, J. Kaiser2, *, M. B. Enghoff1, C. A. McLinden3, S. L. Sorensen4, T. R ¨ockmann2, and M. S. Johnson1
1
Department of Chemistry, University of Copenhagen, Copenhagen, Denmark 2
Max-Planck Institute for Nuclear Physics, Atmospheric Physics Division, Heidelberg, Germany
*
now at: Department of Geosciences, Princeton University, Princeton, New Jersey, USA 3
Air Quality Research Branch, Meteorological Service of Canada, Toronto, Ontario, Canada 4
Synchrotron Radiation Research, Lund University, Lund, Sweden
Received: 23 January 2004 – Accepted: 26 March 2004 – Published: 5 May 2004 Correspondence to: M. S. Johnson ([email protected])
ACPD
4, 2333–2378, 2004
Ultra-violet absorption cross
sections
P. von Hessberg et al.
Title Page Abstract Introduction Conclusions References Tables Figures J I J I Back Close
Full Screen / Esc
Print Version
Interactive Discussion
© EGU 2004
Abstract
The isotopically substituted nitrous oxide species 14N14NO, 15N14NO, 14N15NO and 15
N15NO were investigated by ultra-violet (UV) absorption spectroscopy. High precision cross sections were obtained for the wavelength range 181 to 218 nm at temperatures of 233 and 283 K. These data are used to calculate photolytic isotopic fractionation
5
constants as a function of wavelength. The fractionation constants were used in a three-dimensional chemical transport model in order to simulate the actual fractionation of N2O in the stratosphere, and the results were found to be in good agreement with field studies.
1. Introduction
10
Nitrous oxide is a greenhouse gas (Yung et al., 1976) and the main source of ozone depleting stratospheric NOx(Crutzen, 1970). Through the last decades there has been an interest in the isotopic composition of atmospheric nitrous oxide. Sources of atmo-spheric N2O are mainly microbial nitrogen conversion processes in soils and oceans (Houghton et al., 2001) which generally produce isotopically light N2O compared to
15
atmospheric samples. The N2O emissions are balanced by the downflux of isotopically heavy N2O from the stratosphere (Kim and Craig, 1993; Yoshida and Matsuo, 1983).
The isotopic enrichment of N2O in the stratosphere is caused by its sink reactions: Stratospheric photolysis is the main sink of atmospheric N2O and the reaction with O(1D) also plays a role:
20
N2O+ hν → N2+ O(1D)(90%) (1)
N2O+ O(1D) → 2NO(6%) (2)
ACPD
4, 2333–2378, 2004
Ultra-violet absorption cross
sections
P. von Hessberg et al.
Title Page Abstract Introduction Conclusions References Tables Figures J I J I Back Close
Full Screen / Esc
Print Version
Interactive Discussion
© EGU 2004 Isotopic fractionation due to photolysis is quantified by the fractionation constant ε:
ε (λ)= Jheav y Jl i ght − 1= I (λ) σheav y(λ) I (λ) σl i ght(λ) − 1= σheav y(λ) σl i ght(λ) − 1 (4) where J are photolysis rates of the different isotopic species, σ are isotope specific absorption cross sections and I is the actinic flux. We employ the definition of most studies in the field of atmospheric N2O isotope measurements. The quantum yield for
5
photodissociation (1) is unity (DeMore et al., 1997).
Initial measurements of isotopic fractionation in N2O photolysis showed an isotopic enrichment in the residual N2O (Yoshida et al., 1990), but experiments at 185 nm (close to the UV absorption maximum) indicated near zero enrichments (Johnston et al., 1995). Therefore several authors suggested that non-standard atmospheric chemistry
10
was responsible for generating isotopically enriched N2O (McElroy and Jones, 1996; Prasad, 1997; Zipf and Prasad, 1998).
In 1997, Yung and Miller presented a model that used the difference in vibrational zero point energy of isotopically substituted molecules in order to explain shifts in their absorption spectrum and subsequently, ε(λ). This model approximates the UV
15
absorption spectra of isotopically heavy N2O by simply blue shifting the spectrum of 14
N14N16O by an amount corresponding to the difference in zero point energy, implying near zero isotopic fractionation at the absorption maximum at 182 nm (Yung and Miller, 1997). This model predicted enrichments of isotopically heavy species of N2O half as large as found by experiment (Rahn et al., 1998).
20
A flurry of field studies (Griffith et al., 2000; Rahn and Wahlen, 1997; R¨ockmann et al., 2001; Toyoda et al., 2001b; Yoshida and Toyoda, 2000) and laboratory experiments (Kaiser et al., 2002b; Kaiser et al., 2003c; Rahn et al., 1998; R ¨ockmann et al., 2000; R ¨ockmann et al., 2001; Toyoda et al., 2001a; Turatti et al., 2000; Umemoto, 1999; Zhang et al., 2000) have been carried out to investigate the isotopic composition of
25
N2O in the atmosphere and to determine the effect of stratospheric photolysis on the isotopic composition. Also new theoretical models of the absorption cross section and
ACPD
4, 2333–2378, 2004
Ultra-violet absorption cross
sections
P. von Hessberg et al.
Title Page Abstract Introduction Conclusions References Tables Figures J I J I Back Close
Full Screen / Esc
Print Version
Interactive Discussion
© EGU 2004 the resulting isotopic fractionation constants have been presented (Blake et al., 2003;
Johnson et al., 2001).
Laboratory data and theoretical models of the isotopomer and isotopologue fraction-ation constants have been used as input for atmospheric models in an effort to refine our knowledge of the emissions and chemical sources and sinks of this greenhouse
5
gas (Blake et al., 2003; Kaiser, 2002; Kaiser et al., 2001; McLinden et al., 2003). The most extensive information on the effects of stratospheric photolysis of N2O can be gathered by combining accurate high resolution UV absorption data with the solar irradiance spectrum in the relevant regions of the stratosphere. A chemistry and transport model (see Sect. 4) shows that over 99% of the stratospheric N2O photolysis
10
takes place within the wavelength range 181–218 nm. Knowledge of the photolytic fractionation combined with an understanding of atmospheric transport and mixing can lead to realistic models of the actual isotopic distributions.
The UV absorption spectra of the main isotopologues of 14N14NO are yet to be fully investigated. Selwyn and Johnston (1981) published data on
15
14
N14NO,15N14NO,14N15NO and15N15NO in the wavelength region 173–197 nm. As the wavelength region 200 to 210 nm is the most important in terms of stratospheric photolysis of nitrous oxide (Minschwaner et al., 1993; Yung and Miller, 1997), the data from Selwyn and Johnston are insufficient. Since the red shoulder of the N2O absorp-tion spectrum above about 188 nm has very little vibraabsorp-tional structure (Yoshino et al.,
20
1997), broadband photolysis and subsequent isotopic analysis appears to be a reason-able way of characterizing the magnitude of isotopic fractionation (Kaiser et al., 2002b; Kaiser et al., 2003c; R ¨ockmann et al., 2001). Kaiser et al. (2003c) used the collective results from broadband photolysis and “single wavelength” photolysis experiments to derive a linear fit of fractionation constant vs. wavelength for the range 190 to 220 nm.
25
We undertook the present study to extend the work of Selwyn and Johnston to strato-spherically relevant wavelengths, to obtain more detailed information than is available from broadband or single wavelength photolysis studies, and to validate the existing data. A secondary purpose is to help refine theoretical models of the effect of isotopic
ACPD
4, 2333–2378, 2004
Ultra-violet absorption cross
sections
P. von Hessberg et al.
Title Page Abstract Introduction Conclusions References Tables Figures J I J I Back Close
Full Screen / Esc
Print Version
Interactive Discussion
© EGU 2004 substitution on absorption cross sections (Blake et al., 2003; Johnson et al., 2001; Yung
and Miller, 1997). We report the absorption spectra of 14N14NO,14N15NO,15N14NO and15N15NO at 233 and 283 K over the wavelength range 181 to 218 nm.
2. Experimental
2.1. Spectrometer
5
The main requirement for the experimental setup was high precision of the result-ing cross sections in order to be able to determine fractionation constants in the ‰ range. In order to meet this requirement a custom-designed double beam/single de-tector setup was used.
The experiments were carried out at two locations:
10
a) One set of measurements at MAX-lab in Lund, Sweden using synchrotron radia-tion together with a 1 m vacuum monochromator.
b) A second set of measurements at the Department of Chemistry at the University of Copenhagen using a deuterium continuum lamp as light source and a UV/VIS monochromator (1 m). The double beam compartment was the same in both
15
systems.
The elements of the experimental setup are shown and described in Fig. 1 and Table 1. 2.1.1. Temperature controlled sample cell
The sample cell was a special double-walled design with a path length of 100 mm. Both front and end windows (UV grade fused silica) were double with an evacuated spacing
20
volume in between to provide thermal insulation. The sides of the cell were covered by 12 mm of foam insulating.
ACPD
4, 2333–2378, 2004
Ultra-violet absorption cross
sections
P. von Hessberg et al.
Title Page Abstract Introduction Conclusions References Tables Figures J I J I Back Close
Full Screen / Esc
Print Version
Interactive Discussion
© EGU 2004 Ethanol was used as cooling liquid and was flushed through the outer jacket of the
insulated sample cell. The temperature was monitored via thermistors located at the exit tube for ethanol from the double beam compartment and at the cooling unit. Later (at site b) the temperature monitoring was improved by increasing the ethanol flow and inserting a thermistor in the ethanol directly after the exit from the sample cell.
5
The cooling unit was a Neslab ULT-80 cryogenic cooler. It was able to stabilize the temperature to+/−0.1 K over a range of 193 K to 283 K. The recirculating cooling unit was connected to the sample cell via 2 insulated hoses of about 1.5 m length and 10 mm inner diameter.
At site a) the temperature of the sample could only be determined with some
uncer-10
tainty: +/−0.5 K for the “283 K” measurements and +/−2.5 K for the “233 K” measure-ments. With the improved design at site b) the temperature was determined with an uncertainty of+/−0.3 K.
2.1.2. Gases The gases used:
15
– Natural abundance N2O, 99% (manufacturer specified) chemical purity, Sigma Aldrich, cat.no.: 29,559-0, isotopic purity 99.3%14N14NO (this work)
– 15N15NO ICON 99.50% isotopic purity
– 14N15NO ICON 98.95% isotopic purity
– 15N14NO ICON 99.22% isotopic purity
20
The isotopic composition of the enriched samples was checked using isotope ratio mass spectrometry and Fourier transform infrared spectroscopy (FTIR). The quoted purities reflect these measurements. The small isotopic impurities are unimportant; for example: 1% isotopic impurity of isotopically different N2O with an σ(λ) differing by as
ACPD
4, 2333–2378, 2004
Ultra-violet absorption cross
sections
P. von Hessberg et al.
Title Page Abstract Introduction Conclusions References Tables Figures J I J I Back Close
Full Screen / Esc
Print Version
Interactive Discussion
© EGU 2004 much as 100‰ (from the main species in the sample) would lead to an error in ε of
only 1‰.
Before measurements the enriched samples underwent two freeze/pump/thaw cy-cles (using liquid N2as coolant) in order to remove chemical impurities. After finishing the experiments FTIR spectra of all the N2O samples were obtained in order to check
5
for impurities. All observed bands in the investigated infrared region (1500 cm−1– 4000 cm−1) could be attributed to N2O, H2O or CO2. The water concentration was found to be <1‰ and the CO2 concentration was <0.5‰ of the total. The CO2 and water content were estimated employing the HITRAN line parameters (Rothman et al., 2003) and the spectral fitting software NLM4 from D. Griffith (Feilberg et al., 2002).
10
For flushing the 30 L double beam compartment Nitrogen (99.998% purity) was used at a rate of ∼10 L/min.
2.2. Experimental procedure 2.2.1. Procedure at MAX-lab
The 1 m normal incidence monochromator was used with a 1200 line/mm spherical
15
grating. The slit width was set to 400 µm; this resulted in an effective photon bandwidth of about 0.7 nm.
The double beam setup comprising a beam splitter, a beam combiner and two mir-rors with the thermostatic sample cell in the sample channel (see Fig. 1) was aligned using the zero order light from the bending magnet source; the visible spot was quite
20
well defined which made alignment by sight straightforward. The goal of the alignment was to combine the split beam into a parallel single beam in order to have light from the same region of the source beam hitting the same spot on the detector no matter which path it may have followed. In this way we minimized the influence of any possible spatial variations in detector sensitivity.
25
The double beam compartment containing the sample cell and detector was con-nected to the evacuated beam line exit port through a sapphire window. The box itself
ACPD
4, 2333–2378, 2004
Ultra-violet absorption cross
sections
P. von Hessberg et al.
Title Page Abstract Introduction Conclusions References Tables Figures J I J I Back Close
Full Screen / Esc
Print Version
Interactive Discussion
© EGU 2004 was not evacuated but flushed with N2in order to avoid UV absorption by O2and H2O.
An optical chopper was mounted before the beam splitter. It was required in order to remove DC offset from for example detector dark current. The light and the electrical signal alternated with a frequency of 1000 Hz. The signal from the PMT was demodu-lated by a lock-in amplifier that generated a DC voltage proportional to the AC part of
5
the incoming signal. The DC voltage was fed into a 12-bit A/D converter and recorded by a computer.
The grating was moved in discrete wavelength steps and was stationary during mea-surement of the ratio of light intensity between the sample and reference light paths. At each step the sample light was measured for four seconds after which the shutters
10
switched the light path to the reference channel, and four seconds of reference signal were recorded.
The natural abundance N2O was taken directly from the lecture bottle. The enriched samples were stored in glass flasks and recollected after every spectrum. In order to reduce water entry into the measurement cell, the sample containers were kept
15
below 273 K while filling the cell. For testing purposes spectra with different pressures of nitrous oxide were collected (at p≈20 hPa and p≈40 hPa). The higher pressures resulted in better performance since precise cross sections could be obtained over a broader spectral range. The final measurements were carried out at p≈40 hPa.
A wavelength calibration was carried out after the N2O experiments employing a
20
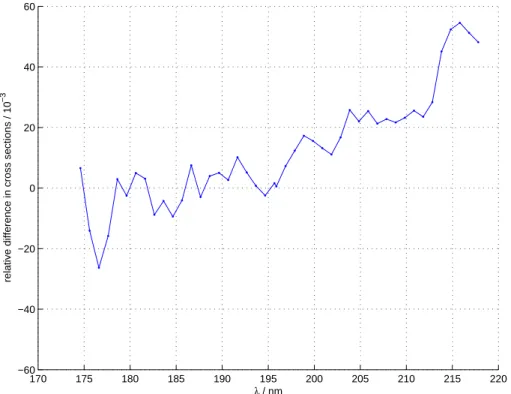
linear fit on the basis of oxygen absorption lines in the Schumann-Runge band at ∼180 nm, and the zero order light. After the calibration (which resulted in a wavelength shift of: λestimated=1.0034*λreading) a comparison of the natural abundance spectrum with the temperature-corrected high-resolution data from Yoshino et al. (1997) showed a good match (Fig. 2). The temperature correction was performed using the
parame-25
terisation of Selwyn et al. (1977).
Spectra of the four gases (natural abundance, 15N15NO,14N15NO and 15N14NO) were measured at 233 and 283 K. Reference spectra of the empty sample cell were recorded before and after every sample spectrum. The 233 K spectra were recorded
ACPD
4, 2333–2378, 2004
Ultra-violet absorption cross
sections
P. von Hessberg et al.
Title Page Abstract Introduction Conclusions References Tables Figures J I J I Back Close
Full Screen / Esc
Print Version
Interactive Discussion
© EGU 2004 with a step size of about 2 nm, whereas the 283 K spectra were recorded with a step
size of about 1 nm. The spectral region investigated was 166 to 230 nm. However, highly accurate cross sections could only be obtained for the wavelength range of ca. 181 nm to about 200 nm due to small impurities of water in the isotopically rare sam-ples absorbing strongly at shorter wavelengths and prohibitively small absorbances at
5
longer wavelengths.
While making measurements at MAX-lab during daytime, the reproducibility was sig-nificantly worse compared to night time measurements. The data presented here are solely based on night-time measurements. A simple test using liquid N2 to cool the detector housing suggested that elevated daytime detector temperatures were at least
10
partly responsible for this.
2.2.2. Procedure in Copenhagen
Overall the experimental setup and procedure were largely the same as those em-ployed at MAX-lab. The spectrometer room in Copenhagen was thermostatically sta-bilized to 295(+/−1) K using a mobile air conditioner. Before measuring spectra the
15
monochromator was calibrated using lines from an Hg discharge lamp. The alignment procedure for the double beam setup was similar to the one outlined above with the exception that a HeNe laser was the alignment light source. The data acquisition was slightly altered: A different lock-in amplifier was used allowing acquisition of the signal in digital form directly from the amplifier. The light source was an ultra stable deuterium
20
lamp. The short-term drift and noise of the complete system (light source, detector and amplifier) was found to be <0.2‰ (within >1 min). Convex lenses of fused silica were mounted between lamp and monochromator as well as between monochromator and double beam compartment in order to get a strong collimated beam through the double beam setup. The monochromator in Copenhagen was a standard UV/VIS instrument.
25
The grating was scored at 1200 grooves/mm. The instrument did not support nitro-gen flushing. The changing oxynitro-gen concentration and absorption made cross section measurements below 195 nm imprecise.
ACPD
4, 2333–2378, 2004
Ultra-violet absorption cross
sections
P. von Hessberg et al.
Title Page Abstract Introduction Conclusions References Tables Figures J I J I Back Close
Full Screen / Esc
Print Version
Interactive Discussion
© EGU 2004 In Copenhagen spectra were recorded at 233 K and 283 K at N2O pressures of ca.
95 hPa. The slit widths of the monochromator were set to 800 µm and the effective instrumental bandwidth (tested using an Hg line at 254 nm) was 1.10 nm. Four spectra were taken for every one of the four gas samples at both temperatures. The spectral range covered was 196–218 nm. The step width was 1 nm.
5
3. Results
3.1. Cross sections and fractionation constants
Fractionation constants for the isotopically rare species (14N15NO,15N14NO and 15
N15NO) were calculated from their cross sections relative to the natural abundance sample cross sections (which is regarded as 14N14NO). Cross sections were
calcu-10
lated from three consecutive spectra: empty cell/filled cell/empty cell. The average of the two empty cell spectra was employed to quantify the background absorbance. The final results constitute an average of 3 or 4 independent sets of spectra.
In general the cross sections obtained with setup (b) displayed a better reproducibility than the Lund data (a). However the Copenhagen experiments (b) were hampered by
15
O2in the light path. It was therefore decided to combine the Lund (a) and Copenhagen (b) results to one data set: The data for wavelengths shorter than 196.8 nm were taken from the Lund measurements (a) and the Copenhagen measurements (b) are used for the longer wavelengths. For all species and temperatures the ε values derived from the Lund and Copenhagen measurements coincide within the mutual experimental errors.
20
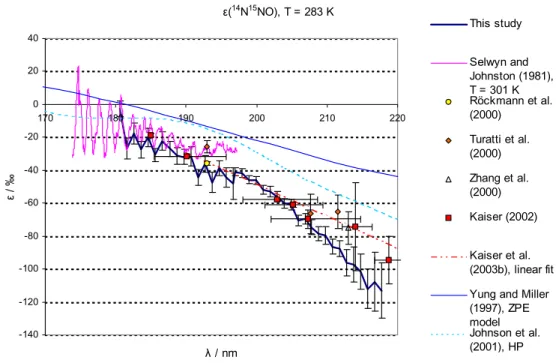
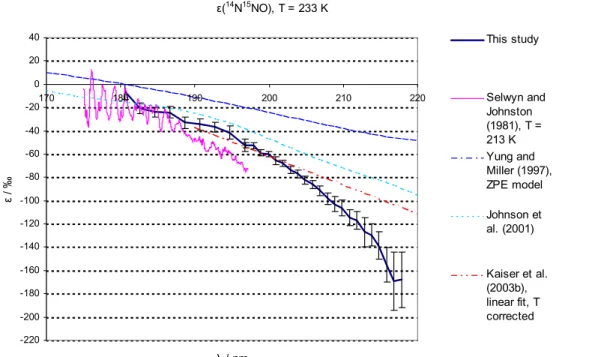
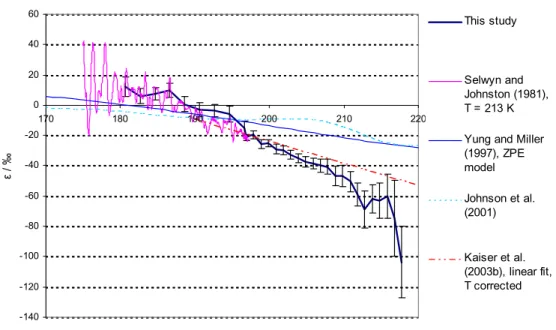
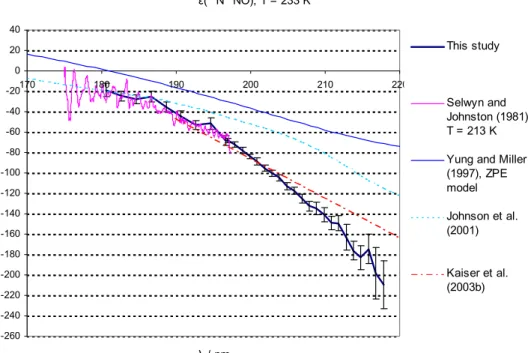
The fractionation constants are presented in Figs. 3 and 4 and Tables 2 and 3. The tables also show the measured absolute cross sections; in Fig. 2 the measured abso-lute cross section for natural abundance is compared with the dataset from (Yoshino et al., 1984).
ACPD
4, 2333–2378, 2004
Ultra-violet absorption cross
sections
P. von Hessberg et al.
Title Page Abstract Introduction Conclusions References Tables Figures J I J I Back Close
Full Screen / Esc
Print Version
Interactive Discussion
© EGU 2004 3.2. Uncertainties
Measurements of high precision absolute cross sections require a number of param-eters to be measured with great accuracy: path-length, pressure of the investigated species, sample temperature and absorbance. Accordingly typically quoted uncertain-ties for absolute cross sections are in the range of 2–4% (Merienne et al., 1990; Selwyn
5
and Johnston, 1981; Yoshino et al., 1984). Fractionation constants presented here are based on relative cross sections, therefore some sources of error are minimized. The main sources of errors are quantified in the following sections.
3.2.1. Pressure
The relative cross sections are based on measurements of both the isotopically rare
10
sample and natural abundance nitrous oxide with approximately equal pressures (for the Lund measurements (a) ca. 40 hPa and for the Copenhagen measurements (b) ca. 95 hPa). This approach minimizes detrimental effects from non-linear or otherwise inaccurate pressure gauges and contributions from pressure dependent effects on the absorption cross-section. The pressure of a given gas was measured using a
cali-15
brated high-precision capacitance pressure gauge with a nominal accuracy of 0.15%. For wavelengths above 196.8 nm no pressure dependence of cross sections was observed for pressures up to 95 hPa. Estimated relative pressure error: <1‰.
3.2.2. Purity of gas
The purity of the gas samples is crucial for the accuracy of the quoted fractionation
20
values. The purity of the isotopically rare gas samples was analysed before and after the experiments using FTIR spectroscopy: After the experiments the only de-tectable non-N2O impurities were CO2 and water at mixing ratios of <0.5 mmol/mol and <1 mmol/mol, respectively. For the Copenhagen experiments the reservoir gas was kept at T<170 K during filling of the spectrometer cell, thus the water content was
ACPD
4, 2333–2378, 2004
Ultra-violet absorption cross
sections
P. von Hessberg et al.
Title Page Abstract Introduction Conclusions References Tables Figures J I J I Back Close
Full Screen / Esc
Print Version
Interactive Discussion
© EGU 2004 essentially zero. The natural abundance N2O sample was analysed using FTIR
spec-troscopy; no infrared active compounds were present above the detection limit; we estimate the chemical purity to be >99.9% (the manufacturer’s specification is only 99% chemical purity). The total estimated error due to impurities of the gas is: <1.5‰ (Lund) and <1‰ (Copenhagen).
5
3.2.3. Noise and drift
The instrumental noise is made up of random fluctuations of light source intensity, detector sensitivity and changing amplification in the data acquisition path in addition to photon counting noise. Problems with long-term drift were minimized by the double beam design; after proper alignment only a minimal drift due to changing beam position
10
of the synchrotron radiation in Lund was encountered. The magnitude of noise was es-timated from comparison of consecutive absorbance measurements of the evacuated sample cell. The deviations in calculated cross sections between individual measure-ments reflected on average the estimated errors due to noise; this makes us confident that no significant additional sources of random error are present.
15
3.2.4. Temperature
For all sets of experiments the spectra of natural abundance nitrous oxide measured at the start and end of the corresponding measurement session showed no significant change in cross sections that could be attributed to temperature drift.
3.2.5. Total uncertainty of fractionation constants
20
The total error estimate constitutes the sum of random error (95% confidence intervals) and an estimated 1‰ (Copenhagen) or 1.5‰(Lund) systematic contribution due to possible impurities in the samples. Pressure, temperature, noise and drift contributions to the error were regarded as being of random nature.
ACPD
4, 2333–2378, 2004
Ultra-violet absorption cross
sections
P. von Hessberg et al.
Title Page Abstract Introduction Conclusions References Tables Figures J I J I Back Close
Full Screen / Esc
Print Version
Interactive Discussion
© EGU 2004 3.3. Instrumental bandwidth
The monochromator slit widths in the Lund experiments were 400 µm which resulted in an instrumental bandwidth of ca. 0.7 nm. The step size during the scan was 2 nm (T=233 K) and 1 nm (T=283 K) – larger than the instrumental bandwidth. This was a mistake: To obtain valid average values for the cross section over the complete
5
spectral range, the instrumental bandwidth should be larger than the step size. The high resolution UV spectrum of nitrous oxide by Yoshino et al. (1984) shows that there is little vibrational fine structure for λ<185 nm. The features measured in our spectra are therefore representative of the spectra which could be obtained with a smaller step size. It can thus be concluded that the potential error due to inconsistent bandwidths
10
and step sizes is limited.
For the Copenhagen experiments (λ>196.8 nm) the instrumental bandwidth was 1.1 nm and the step size 1 nm.
3.4. Comparison with other data
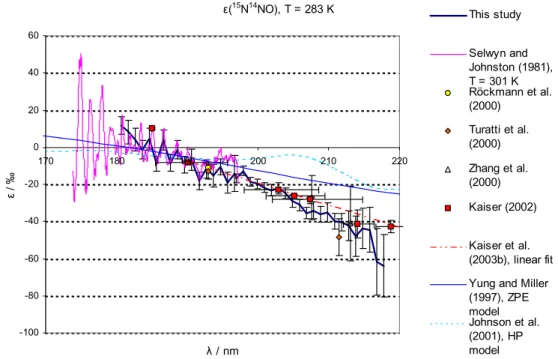
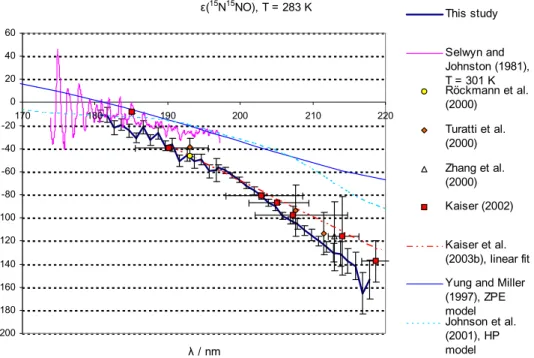
Figures 3 and 4 compare the fractionation constants found in this study with the
exist-15
ing data from single wavelength photolysis experiments, a linear fit on the basis of all available broadband and “single wavelength” photolysis experiments, and results from theoretical studies. For 14N15NO and 15N14NO at room temperature a lot of experi-mental information is available: single wavelength experiments in the range from 185 to 213 nm (Kaiser et al., 2002b; Kaiser et al., 2003c; Rahn et al., 1998; R ¨ockmann et
20
al., 2000; R ¨ockmann et al., 2001; Toyoda et al., 2001a; Turatti et al., 2000; Umemoto, 1999; Zhang et al., 2000), broadband photolysis experiments (Kaiser et al., 2003c; R ¨ockmann et al., 2001) as well as spectroscopic data from 173 nm to 197 nm (Sel-wyn and Johnston, 1981). For the low temperatures the only existing wavelength re-solved experimental data is that from Selwyn and Johnston (1981) from 173 nm to
25
197 nm; however a temperature dependence study based on broadband photolysis ex-ists (Kaiser et al., 2002b). For15N15NO the only existing data are those from Selwyn
ACPD
4, 2333–2378, 2004
Ultra-violet absorption cross
sections
P. von Hessberg et al.
Title Page Abstract Introduction Conclusions References Tables Figures J I J I Back Close
Full Screen / Esc
Print Version
Interactive Discussion
© EGU 2004 and Johnston and one broadband photolysis study (Kaiser et al., 2003a).
The standard error for the linear fit (Kaiser et al., 2003a) is not shown in Figs. 3 to 5 because it is very small (error (dε/dλ)=0.02 to 0.25‰nm, error (ε200 nm)=0.1‰). This error estimate relies on the validity of the underlying assumption that ε can be represented by a linear function of λ.
5
The magnitude of error on the ε data from the previous spectroscopic study by Sel-wyn and Johnston (1981) is not well known, but apparently quite substantial: The authors write: “at low energies the isotope shift and the random experimental error are about equal”.
Most of the single wavelength photolysis experiments were carried out at mixing
ra-10
tios of ≥4 mmol/mol (Zhang et al., 2000): ca. 10 mmol/mol, (Turatti et al., 2000): ca. 7 mmol/mol, (R ¨ockmann et al., 2000): ca. 4 mmol/mol); for a mixing ratio of 4 mmol/mol, Kaiser et al. (2002b) found a significantly non-linear relationship between ε ln (f) and ln(1+∆δ) at mixing ratios of 4 mmol/mol (probably due to reaction between O(1D) and N2O), while mixing ratios of 1 mmol/mol produced essentially linear results. The
pub-15
lished ε values are based on the assumption of a linear relationship between ε ln (f) and ln(1+∆δ), therefore the values may be (slightly) erroneous.
3.4.1. Comparison with previous experiments
The temperature dependence of ε is only slight, therefore the data from this study (T=283 K) may be directly compared to room temperature measurements.
20
The agreement with the linear fit from Kaiser et al. (2003a) is largely within the range of error in the wavelength range 190–205 nm for both15N14NO and 14N15NO. For 15N14NO the disagreement in the wavelength range further up to 218 nm is only slightly larger than the estimated error of this study. For15N14NO the data from this study are in reasonable agreement with the rest of the experimental data (based on
25
single wavelength photolysis and spectroscopy). For14N15NO the disagreement with the linear fit grows for λ>205 nm. The data from this study are in good agreement with the single wavelength results for 185 nm (Kaiser et al., 2003c), 193 nm (R ¨ockmann et
ACPD
4, 2333–2378, 2004
Ultra-violet absorption cross
sections
P. von Hessberg et al.
Title Page Abstract Introduction Conclusions References Tables Figures J I J I Back Close
Full Screen / Esc
Print Version
Interactive Discussion
© EGU 2004 al., 2000) and 207.6 nm (Turatti et al., 2000); whereas this study is not in agreement
with the 193 nm and 211.5 nm experiments by Turatti et al. (2000) as well as the 213 nm experiment by Zhang et al. (2000). The disagreement for ε(14N15NO) at λ>205 nm with the existing data is a matter of concern. However, it is noted that the results from the 207.6 nm and 211.5 nm experiments by Turatti seem to be in mutual disagreement as
5
all other studies and models point at a significantly negative value of ∂ε/∂λ at these wavelengths.
The disagreement with the linear fit is not so worrying since a closer look at the underlying broadband photolysis results (Kaiser et al., 2002a) reveals that the 95% confidence intervals of our data overlap with the results from broadband experiments
10
at median wavelengths of ca. 204, 214 and 219 nm (Kaiser et al., 2003). However considering the better precision and higher wavelength resolution of the present data-set, it seems likely that the ε(λ) has some negative curvature and the linear fit applied by Kaiser et al. (2003c) is most probably not appropriate. This is also in line with the qualitative results from most recent theoretical models (ab initio HP model, Johnson et
15
al., 2001, and analytical Born Oppenheimer (BO) model, Blake et al., 2003) the present findings point to a negative curvature of the function representing ε(λ). The agreement with the previous spectroscopic study (Selwyn and Johnston, 1981) is quite good for all species and temperatures at λ<187 nm. The disagreement at longer wavelengths is probably due to the insufficient accuracy of the old data.
20
3.4.2. Comparison with models
The model results from the HP and ZPE models are in quantitative disagreement with this study. For 283 K both the HP and ZPE model underestimate the magnitude of isotopic fractionation roughly by a factor of two (around 200 nm); at 233 K the HP model is in better agreement with the measured values in the case of14N15NO and15N15NO
25
(a factor of 1.3 difference for14N15NO and 1.5 for15N15NO). The ZPE model clearly is a very crude model – only one mass dependent term (the vibrational zero point energy in the electronic ground state) in the complex function representing the photodissociation
ACPD
4, 2333–2378, 2004
Ultra-violet absorption cross
sections
P. von Hessberg et al.
Title Page Abstract Introduction Conclusions References Tables Figures J I J I Back Close
Full Screen / Esc
Print Version
Interactive Discussion
© EGU 2004 cross section is considered. As shown in Johnson et al. (2001) a whole suite of mass
dependent effects are of importance for the photodissociation cross sections. The disagreement with the HP model results may be explained by the deficiencies of the employed potential energy surface (PES) in the model, which does not incorporate the N-N stretching motion.
5
Morgan et al. (2003) have developed a semi-empirical model for the isotope effects. The detailed description of the employed method and formulae is yet to be published – therefore the model results have not been compared in detail (not shown in Figs. 3 and 4). However, a rough comparison shows that their model is in agreement with the new15N14NO 283 K data presented here. Both the14N15NO and15N15NO predictions
10
are shifted towards higher fractionation constants by 15–20‰ compared with the ex-periments, though. This leads to an erroneous fractionation factor at the absorption peak wavelength and may be related to the lack of some types of molecular dynamics in their model as discussed in Sect. 5.
4. Modelling
15
One way of evaluating these data is to use them in the prediction of stratospheric abun-dances of the isotopically rare species of nitrous oxide in a global atmospheric model and then compare these predictions with field studies. Two-dimensional (Kaiser et al., 2001; Kaiser 2002; Miller and Yung, 2000; Morgan et al., 2003; Yung and Miller, 1997) and three-dimensional (McLinden et al., 2003) models have been used previously to
20
simulate the distribution of the isotopically rare species of N2O; however, each of these model studies relied on theoretical values for the cross section fractionation constants. In this work we have the advantage of using detailed laboratory data to model the photolysis.
The simulation of isotopically rare species has been done using the University of
Cal-25
ifornia at Irvine (UCI) three dimensional chemistry-transport model (CTM) (McLinden et al., 2000; McLinden et al., 2003; Olsen et al., 2001). The source of meteorological
ACPD
4, 2333–2378, 2004
Ultra-violet absorption cross
sections
P. von Hessberg et al.
Title Page Abstract Introduction Conclusions References Tables Figures J I J I Back Close
Full Screen / Esc
Print Version
Interactive Discussion
© EGU 2004 fields is the GISS II general circulation model (GCM) (Rind et al., 1988) run at a
resolu-tion of 7.8◦latitude × 10◦longitude × 23 layers with the top three GCM layers combined into a single CTM layer. This model is able to simulate realistic N2O distributions with a lifetime of about 115 years (Olsen et al., 2001). It has been used previously to model isotopologues of 14N14N16O by treating each as an independent tracer (McLinden et
5
al., 2003).
In the CTM, chemical loss is implemented using a pre-calculated loss frequency (J+k[O(1D)], see Eqs. 1–3) table for each N2O isotopologue. Each table is calculated in a photochemical box model (McLinden et al., 2000) as a function of latitude, altitude, and time of year and is based on climatological atmospheres and standard
chemi-10
cal rate data and cross sections (Sander et al., 2000). Photolysis rates (J) for the isotopically rare species (14N15NO, 15N14NO, and15N15NO) are calculated using the standard14N14NO absorption cross sections modified by the cross section fractiona-tion constants in Tables 2 and 3, analogous to the procedure in (McLinden et al., 2003). Loss of the isotopically rare species through the reactions with O(1D) is modelled using
15
reaction rate coefficients for14N14NO (Sander et al., 2000) modified by a constant frac-tionation constant as measured by Kaiser et al. (2002a). To simulate the distributions in the CTM, each of the isotopic species is run to an annually repeating steady state using an arbitrary lower boundary condition of 310 nmol/mol. The isotopic composition of14N15NO, 15N14NO, and 15N15NO relative to the mean tropospheric abundance is
20
easily calculated from their abundances relative to that of14N14NO. In a comparison with observations, the modelled delta values must be shifted by the value of the bulk troposphere (in essence, the model troposphere has a delta value of 0‰). Using atmo-spheric N2 as a reference material, typical tropospheric δ values have been found to be 30‰ for14N15N16O and −16‰ for15N14N16O by Kaiser et al. (2003d), or 16‰ for
25
14
N15N16O and −2‰ for15N14N16O by Yoshida and Toyoda (2000).
The resultant model delta values are evaluated through a comparison with ob-served (apparent) stratospheric fractionation constants. These are derived assuming
ACPD
4, 2333–2378, 2004
Ultra-violet absorption cross
sections
P. von Hessberg et al.
Title Page Abstract Introduction Conclusions References Tables Figures J I J I Back Close
Full Screen / Esc
Print Version
Interactive Discussion
© EGU 2004 a Rayleigh distillation process (Johnson et al., 2002):
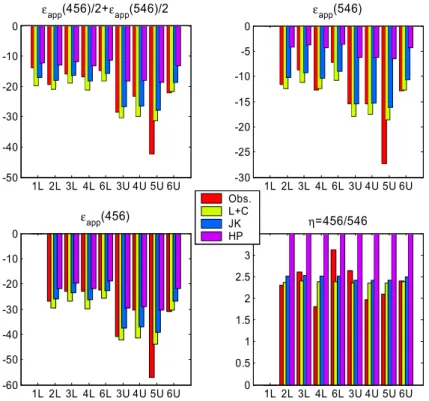
ln(1+ δ) = ln(1 + δ0)+ εappln f (5)
where f is the ratio of stratospheric to tropospheric 14N14N16O mixing ratios and
δ=R/R0 − 1 is the isotopic composition (or delta value) and denotes the heavy-to-light isotope ratio (R) of a given isotopomer relative to some standard (R0).
Compar-5
isons of model apparent stratospheric fractionation constants (εapp) are made with five in-situ datasets (Park et al., 2004; Rahn and Wahlen, 1997; R ¨ockmann et al., 2001; Toyoda et al., 2001b; Yoshida and Toyoda, 2000) and one remotely sensed dataset an improved version of the data presented in Griffith et al. (2000) and McLinden at al. (2003). Stratospheric fractionation constants (εapp) were derived by fitting the
en-10
richment data to expression (5). Each of these datasets, where necessary, has been re-evaluated so that the fractionation constant has been calculated using Eq. (5), as opposed to commonly used approximations (Kaiser, 2002). Also, separate constants have been derived for the lower stratosphere, LS (− ln f >0.6) and middle stratosphere, MS (− ln f <0.6). This type of comparison has the advantage over a direct comparison
15
of δ in that a somewhat arbitrary tropospheric offset does not need to be applied to the model data and the measured εappwill have a higher signal to noise ratio than individ-ual δ values. A least squares fit for εappis performed restricting the model values used to the month, latitude and [N2O] range of the observations. The observations used in this comparison are summarised in Table 5.
20
The model-observation comparisons are presented in Fig. 6. Shown are CTM results based on the photolysis fractionation constants of this work and the Hermite Propaga-tion model (Johnson et al., 2001) as shown in McLinden et al. (2003) but using O(1D) fractionation factors from Kaiser et al. (2002a). Also included is a CTM simulation us-ing the linear wavelength and temperature parameterisations of the fractionation
con-25
stants (Kaiser et al., 2002b, c) which were derived from a collection of experimental data. These individual expressions were combined and the following parameterisation
ACPD
4, 2333–2378, 2004
Ultra-violet absorption cross
sections
P. von Hessberg et al.
Title Page Abstract Introduction Conclusions References Tables Figures J I J I Back Close
Full Screen / Esc
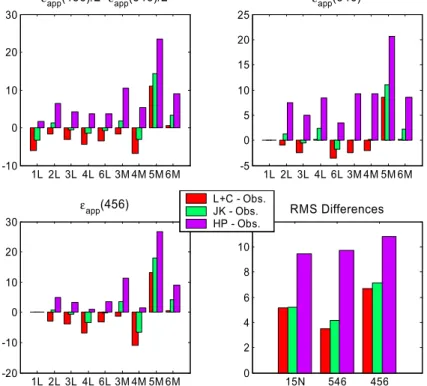
Print Version Interactive Discussion © EGU 2004 resulted: ε(λ, T )= ε0+ a∆λ + b∆T + c∆λ∆T (6) where ∆λ=λ−200 nm, ∆T =T −273.15 K and ε0=−51.5/−20.3‰, a=−2.08/−1.25‰/nm, b=0.155/0.051‰/K, and c=6.23×10⁻³/3.16×10−3‰ nm−1K−1 for 14N15NO /15N14NO). Differences between each model and the observations are
5
shown in Fig. 7. The last panel shows the root-mean-square (RMS) differences for each model over all comparisons except the occultation data (dataset 5). The occultation data are in obvious disagreement with all the other field studies in that they imply an isotopic fractionation significantly larger in magnitude than the other data at corresponding altitudes.
10
Overall the comparison between the combined Lund/Copenhagen (L+C in Figs. 6 and 7) modelled apparent fractionation constants (Fig. 7) and the observations is very good: root-mean-square (RMS) differences are about 3 to 7‰. There does appear to be a slight bias in both 14N15NO and 15N14NO as the L+C values were gener-ally smaller (more negative) than the observations. The comparison with the Kaiser et
15
al. (JK in Figs. 6 and 7) parameterisations is favorable with no obvious bias. Also shown are the HP model results. (Note that the overall impact of the new O(1D) fractionation constants on the apparent fractionation is small, <0.4‰). This model systematically under-predicts the apparent fractionation constants, particularly for 15N14NO as dis-cussed in McLinden et al. (2003) although we note that for14N14N18O, not considered
20
in this study, the agreement between the HP model with observations is much better. Results from the Caltech/JPL two-dimensional model which employs a semi-analytical photolysis model based on the Born-Oppenheimer approximation (Morgan et al., 2003) also appear to be in good agreement with these model results. The good agreement between the L+C (and JK) modelled apparent fractionation factors (RMS
25
differences of 3–7‰) with the observed values strongly suggests there are no uncon-ventional processes involved in fractionating stratospheric N2O.
The expanded wavelength coverage of these measurements spans the entire range important for atmospheric photolysis and confirms there are no anomalous spectral
ACPD
4, 2333–2378, 2004
Ultra-violet absorption cross
sections
P. von Hessberg et al.
Title Page Abstract Introduction Conclusions References Tables Figures J I J I Back Close
Full Screen / Esc
Print Version
Interactive Discussion
© EGU 2004 enrichment features and that the fractionation constant becomes more negative with
increasing wavelength, as predicted by theory.
Using the global, annual chemical loss from the model budgets, the stratospheric loss fractionation constants can be calculated: −26.1/−11.1‰ (456/546) for the model using the L+C photolysis data and −22.9/−9.1‰ for the JK model and −19.0/−4.2 for
5
the HP model.
Compared to an earlier model for the isotopic fractionation due to stratospheric pho-tolysis and chemistry, the experimental fractionation constants predict a smaller annual trend in tropospheric15N. As derived in McLinden et al. (2003) with the HP model the annual trend in15N i.e. (δ15N14NO+δ15N14NO)/2 is ca. −0.04‰/a; using the JK data
10
set the estimated trend is −0.035‰/a and the estimate using the L+C data set gives a trend of −0.012‰/a – all of these values with large uncertainties. These may be compared to the recent analysis of Antarctic firn air showing a trend of −0.041‰/a (R ¨ockmann et al., 2003). This trend has a significant uncertainty. In addition, the budget of McLinden et al. does not employ the most recent results regarding isotope
15
distributions in the various source terms. Nonetheless, we report these results in order to show the effect of the new laboratory data.
5. Discussion
Nitrous oxide is an important test system for developing theories of the effect of isotopic substitution on the photolysis cross section of small molecules. It has been known for
20
a long time that electronic excitation spectra change with isotopic substitution, since this will change the position of the rovibrational levels in the ground and excited states. The change in the excited state rovibrational levels is especially important for predis-sociative spectra and/or systems in which the excited state has a long enough lifetime to result in a structured absorption (Herzberg, 1950). In their 1997 paper, Yung and
25
Miller described a method for estimating the effect of isotopic substitution on the po-sition (energy) of the electronic absorption band in a system with a repulsive excited
ACPD
4, 2333–2378, 2004
Ultra-violet absorption cross
sections
P. von Hessberg et al.
Title Page Abstract Introduction Conclusions References Tables Figures J I J I Back Close
Full Screen / Esc
Print Version
Interactive Discussion
© EGU 2004 state. They observed that, due to the Born-Oppenheimer approximation, the excited
state potential will be the same for the various isotopically distinct systems, but that slightly different vertical excitation energies will arise from the system’s different zero point vibrational energies (ZPE). Thus the absorption spectra of for example a heavy isotopologue would be blue shifted by an amount of energy corresponding to the shift
5
in the ZPE of the heavy isotopologue relative to the isotopically unsubstituted species. This model predicted that heavy isotopic species of nitrous oxide would be photolysed more slowly in the stratospheric UV window than the light parent species 14N14NO, potentially balancing the isotopic budget and confirming the observation of Kim and Craig (1993).
10
Subsequent experiments showed isotopic fractionation constants twice as large as predicted by the ZPE theory. Therefore, a study was undertaken using the Hermite Propagator (HP) method to examine factors not included in the ZPE theory, for exam-ple the degree of bending excitation in the ground state molecule, and the role of dy-namics on the upper state potential energy surface (Johnson et al., 2001). The nitrous
15
oxide molecule has a linear equilibrium geometry. All but about 3% of the transition intensity in the first UV system of NNO results from a transition1∆←1Σ+, that is forbid-den since it involves a change in angular momentum quantum number of two, while a photon only carries a single unit of angular momentum. However, the symmetry of the transition changes to 21A0 ← X11A0 when the molecule bends, resulting in a weakly
20
allowed transition. Even in the lowest bending vibrational state nitrous oxide bends, due to half a quantum of bending vibrational ‘zero point’ excitation. But, the transition intensity increases with bending vibrational excitation; the ground, first and second ex-cited bending states have an intensity ratio of ca. 1 : 3 : 6 (Johnson et al., 2001). Thus the population in the excited bending states makes a significant contribution to the
ab-25
sorption cross-section. The hot bands are especially important to the low energy side of the transition maximum, and result in a relatively large temperature dependence of the absorption cross section in the region of the stratospheric UV window (ca. 200 to 210 nm; Yung and Miller, 1997). The relative population of the excited bending states
ACPD
4, 2333–2378, 2004
Ultra-violet absorption cross
sections
P. von Hessberg et al.
Title Page Abstract Introduction Conclusions References Tables Figures J I J I Back Close
Full Screen / Esc
Print Version
Interactive Discussion
© EGU 2004 is given by the familiar Boltzmann expression:
nν i P i nν i = e −giβεi P j e−gjβεj (7)
where β=1/kT , εi is the energy (ε=hc¯ν) and gk is the degeneracy of the state in question.
While nitrous oxide is not the only molecule that has a “forbidden” transition that
5
becomes allowed due to vibronic interaction (examples include the isoelectronic CO2 and OCS), it is not uncommon to assume that the transition dipole moment does not change very much with the nuclear coordinates of a molecule. This approximation is used for example when Franck-Condon factors are calculated. Brown et al. (1999) have calculated the transition dipole surface for N2O and find that it slopes upward from a
10
minimum for a linear geometry. Since isotopically lighter systems will have a slightly larger bending vibrational amplitude than heavy systems (they sit higher in energy in the potential well), they will also have a larger cross section. So, while the ZPE theory predicts a shift along the energy scale, a consideration of the transition dipole surface demands, in addition, a shift in the absorption intensity scale. The ZPE theory predicts
15
that a plot of the fractionation constant versus wavelength will pass through zero at the position of the absorption maximum, about 182 nm for N2O. However the plots of the fractionation constants for14N15NO and15N15NO always remain negative, at 283 K (Figs. 3a and c) and 233 K (Figs. 4a and c). In contrast, ε(15N14NO) becomes positive for λ shorter than ca. 186 nm (Fig. 3b) and 188 nm (Fig. 4b). This dynamical effect,
20
predicted by the HP theory, is discussed below.
As discussed, the amplitude of bending vibration is smaller for heavier systems, re-sulting in a smaller cross section. This effect will increase as the number of bending vibrational quanta increases. In addition, there is an interesting, simultaneous inter-action with the Boltzmann population of the excited levels (Eq. 7). On the low energy
25
ACPD
4, 2333–2378, 2004
Ultra-violet absorption cross
sections
P. von Hessberg et al.
Title Page Abstract Introduction Conclusions References Tables Figures J I J I Back Close
Full Screen / Esc
Print Version
Interactive Discussion
© EGU 2004 heavy isotopic species have a lower absorption cross section and thus a negative
frac-tionation constant. Heavy systems also have slower vibrational frequencies, and thus a greater fraction of the heavy systems are in vibrationally excited states at a given temperature. As temperature decreases, there is a larger relative decrease in the pop-ulation in excited vibrational states (which have a higher intrinsic cross section) for
5
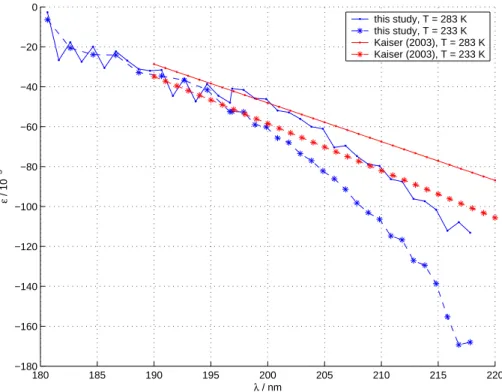
heavy systems than for light. The direction of the Boltzmann/statistical mechanics ef-fect on the cross section is thus opposite to the trend of heavy isotopic species having a smaller cross section than light species for a given number of quanta of bending ex-citation. Overall, more negative (and larger in magnitude) fractionation constants are observed for heavy isotopic systems as temperature decreases in the hot band region.
10
This may be seen by comparing Figs. 3a and 4a for14N15NO, 3b and 4b for15N14NO 546 and 3c and 4c for15N15NO.
The absorption cross section of a given molecule may be calculated using Heller’s equation σ(ω)= Cω ∞ Z −∞ d t exp(i E t/ħ)hφ0| exp(−i ħH t)|φ0i , (8) 15
(Heller, 1978). This states that the cross section depends on the (Fourier transform with respect to energy of the) correlation function between the original system wave-function and the time-propagated wavewave-function on the excited state potential energy surface (hφ0| exp(−i
ħH t)|φ0i). A system which falls apart quickly after photoexcitation will have a smaller absorption cross section than one which has a higher correlation
20
to the original vibrational wavefunction. One of the unique features of the photolysis of nitrous oxide is that the N2 fragment is produced with virtually no vibrational exci-tation (Hanisco and Kummel, 1993; Neyer et al., 1999a; Neyer et al., 1999b). Thus all of the transition energy is ultimately partitioned between electronic energy of the O(1D) fragment, rotation of the N2 fragment and translational motion. The amount of
25
rotational excitation is extreme; the rotational distribution of the N2 fragment peaks at over 80 quanta, corresponding to about 1.4 eV of energy. If there were a dynamical
ACPD
4, 2333–2378, 2004
Ultra-violet absorption cross
sections
P. von Hessberg et al.
Title Page Abstract Introduction Conclusions References Tables Figures J I J I Back Close
Full Screen / Esc
Print Version
Interactive Discussion
© EGU 2004 effect on the cross section, one would expect it to produce a simultaneous change in
the cross section and the partitioning of energy between rotation and translation. The change in zero point energy of14N15N16O is 39 cm−1, and for15N14N16O, 22 cm−1 (fre-quencies may be found in Johnson et al., 2001). Thus the ZPE theory predicts that the fractionation constant for15N14NO should be about 22/39=56% that of14N15NO.
5
Inspection of Figs. 3b and 4b and analysis of the data in Tables 2 and 3 shows that instead of being greater than half, the fractionation constant of 15N14NO is less than half of that of 14N15NO (less than 46%, to be precise) for wavelengths shorter than 210 nm, at 233 and 283 K. This means that the absorption cross-section of15N14NO is anomalously high (or that of14N15NO is anomalously low), relative to14N2O. Moreover,
10
the absorption cross section of14N15NO is always less than that of14N14NO (negative fractionation constants) at all wavelengths reported in this study, whereas the absorp-tion cross secabsorp-tion of15N14NO becomes larger than that of14N14NO already at 189 nm (233 K). It is difficult to explain the experimental results using a theory based only on the ground state potential energy surface (e.g. Blake et al., 2003; Yung and Miller,
15
1997), that does not include dynamics in the excited state. One example is provided by the difference in the photodissociation dynamics of the14N15NO and15N14NO iso-topomers. For15N14NO, the impulse from the broken bond is pushing against the light end of the N2fragment, and for14N15NO, against the heavy end. An additional dynamic effect is the influence of the spatial extent of the initial bending vibrational wavefunction
20
on the rotational distribution. The full dynamics on the three dimensional potential en-ergy surface have been calculated. The anomalously large cross section of15N14NO is a dynamical effect that first appeared in the HP model calculations (Johnson et al., 2001), as shown in Figs. 3b and 4b, albeit in a slightly exaggerated form. The clearly different pattern of enrichment for 14N15NO and 15N14NO is an isotope effect that is
25
independent of molecular mass, but arises solely from the mass distribution within the N2O molecule.
ACPD
4, 2333–2378, 2004
Ultra-violet absorption cross
sections
P. von Hessberg et al.
Title Page Abstract Introduction Conclusions References Tables Figures J I J I Back Close
Full Screen / Esc
Print Version
Interactive Discussion
© EGU 2004
6. Conclusions
Wavelength dependent fractionation constants for 14N15NO, 15N14NO and 15N15NO were obtained for the wavelength range 181–218 nm at 233 and 283 K on basis of UV spectroscopy. The first comprehensive low temperature laboratory dataset on pho-todissociative isotopic fractionation of nitrous oxide is now available. The new data
5
were used as input to a three dimensional general chemistry-transport model and the modelled stratospheric enrichment in isotopically heavy nitrous oxide was compared to stratospheric measurements showing a very good agreement. The standard model for atmospheric chemistry thus seems to be completely in line with experimental data; no unconventional sources of stratospheric nitrous oxide are needed to explain the
10
observed stratospheric isotope distribution of15N in N2O.
The distribution of15N in atmospheric nitrous oxide is not statistical, but a function of the vagaries of this trace gas’ biological sources and the linked photochemical/transport sink. Much work remains in the area of understanding these processes, especially in the area of emission sources.
15
Acknowledgements. Thanks to: C. Brenninkmeijer and J. Crowley at the Max Planck Institute
for Chemistry, Mainz, Germany for providing gas samples of 14N15NO, 15N14NO and 15N2O and the temperature controlled gas cell; the staff at MAX-lab for extensive on-site support; G. Somesfalean from the Physics Department of Lund University for providing us with a lock-in amplifier; For financial support: The Danish Natural Science Research Council, The Nordic
20
Academy for Advanced Study (NorFA) and the Access to Research Infrastructure Programme of the EU; S. Betak for transportation of equipment; F. Nicolaisen and K. Feilberg for providing us with pressure gauges and help with analysing FTIR spectra; I. Trabjerg for the PMT housing and base; A. von Hessberg for valuable discussions regarding the double beam design.
References
25
Blake, G. A., Liang, M.-C., Morgan, C. G., and Yung, Y. L.: A Born-Oppenheimer photolysis model and its application to N2O isotopic fractionation, Geophys. Res. Lett., 30, (A6), 1–5,
ACPD
4, 2333–2378, 2004
Ultra-violet absorption cross
sections
P. von Hessberg et al.
Title Page Abstract Introduction Conclusions References Tables Figures J I J I Back Close
Full Screen / Esc
Print Version
Interactive Discussion
© EGU 2004
2003.
Brown, A., Jimeno, P., and Balint-Kurti, G. G.: Photodissociation of N2O, Ab initio potential energy surfaces for the low lying electronic states X1A0, 21A0, and 11A00, J. Phys. Chem. A, 103, 11 089–11 095, 1999.
Crutzen, P. J.: The influence of nitrogen oxides on the atmospheric ozone content, Q. J. R.
5
Meteorol. Soc., 96, 320–325, 1970.
DeMore, W. B., Sander, S. P., Golden, D. M., Hampson, R. F., Kurylo, M. J., Howard, C. J., Ravishankara, A. R., Kolb, C. E., and Molina, M. J.: Chemical kinetics and photochemical data for use in stratospheric modelling, JPL Publication, 97-4, 163–164, 1997.
Feilberg, K. L., Sellevag, S. R., Nielsen, C. J., Griffith, D. W. T., and Johnson, M. S.: CO+OH−>
10
CO2+H: The relative reaction rate of five CO isotopologues, Physical Chemistry Chemical Physics, 4, (19), 4687–4693, 2002.
Griffith, D. W. T., Toon, G. C., Sen, B., Balvier, J.-F., and Toth, R. A.: Vertical profiles of nitrous oxide isotopomer fractionation measured in the stratosphere, Geophys. Res. Lett., 27, 2485– 2488, 2000.
15
Hanisco, T. F. and Kummel, A. C.: State-resolved photodissociation of N2O, J. Phys. Chem., 97, (28), 7242–7246, 1993.
Heller, E. J.: Quantum corrections to classical photo-dissociation models, J. Chem. Phys., 68, (5), 2066–2075, 1978.
Herzberg, G.: Spectra of Diatomic Molecules, D. van Nostrand Company Inc., 1950.
20
Houghton, J. T., Ding, Y., Griggs, D. J., Noguer, M., van der Linden, P. J., Dai, X., Maskell, K., and Johnson, C. A.: Climate Change 2001: The Scientfic Basis, Cambridge University Press, 2001.
Johnson, M. S., Billing, G. D., Gruodis, A., and Janssen, M. H. M.: Photolysis of nitrous oxide isotopomers studied by time-dependent Hermite propagation, J. Phys. Chem. A, 105, 8672–
25
8680, 2001.
Johnson, M. S., Feilberg, K. L., von Hessberg, P., and Nielsen, O. J.: Isotopic processes in atmospheric chemistry, Chem. Soc. Rev., 31, (6), 313–323, 2002.
Johnston, J. C., Cliff, S. S., and Thiemens, M. H.: Measurement of multioxygen isotopic (delta 18
O and delta17O) fractionation factors in the stratospheric sink reactions of nitrous oxide, J.
30
Geophys. Res., 100, (D8), 16 801–16 804, 1995.
Kaiser, J.: Stable isotope investigations of atmospheric nitrous oxide, Ph.D. Thesis, Johannes Gutenberg Universit ¨at, Mainz, 2002.
ACPD
4, 2333–2378, 2004
Ultra-violet absorption cross
sections
P. von Hessberg et al.
Title Page Abstract Introduction Conclusions References Tables Figures J I J I Back Close
Full Screen / Esc
Print Version
Interactive Discussion
© EGU 2004
Kaiser, J., Brenninkmeijer, C. A. M., and R ¨ockmann, T.: Intramolecular15N and 18O fractiona-tion in the reacfractiona-tion of N2O with O(1D) and its implications for the stratospheric N2O isotope signature, J. Geophys. Res., 107, (D14), 4214, 2002a.
Kaiser, J., R ¨ockmann, T., and Brenninkmeijer, C. A. M.: Temperature dependence of isotope fractionation in N2O photolysis, Physical Chemistry Chemical Physics, 4, (18), 4420–4430,
5
2002b.
Kaiser, J., R ¨ockmann, T., and Brenninkmeijer, C. A. M.: Assessment of15N15N16O as a tracer of stratospheric processes, Geophys. Res. Lett., 30, (2), 2003a.
Kaiser, J., R ¨ockmann, T., and Brenninkmeijer, C. A. M.: Complete and accurate mass spectro-metric isotope analysis of tropospheric nitrous oxide, J. Geophys. Res., 108, (D15), 4476,
10
2003b.
Kaiser, J., R ¨ockmann, T., Brenninkmeijer, C. A. M., and Crutzen, P. J.: Wavelength dependence of isotope fractionation in N2O photolysis, Atmos. Chem. Phys., 3, 303–313, 2003c.
Kaiser, J., Park, S., Boering, K. A., Brenninkmeijer, C. A. M., Hilkert, A., and R ¨ockmann, T.: Mass-spectrometric method for the absolute calibration of the intramolecular nitrogen isotope
15
distribution in nitrous oxide, Anal. Bioanal. Chem., 2003d.
Kaiser, J., R ¨ockmann, T., Br ¨uhl, C., and Brenninkmeijer, C. A. M.: Isotopic enrichment in strato-spheric N2O: 2-D model results linked to laboratory measurements of N2O photochemistry, Geophys. Res. Abs., 3, 5784, 2001.
Kim, K.-R. and Craig, H.: Nitrogen-15 and oxygen-18 characteristics of nitrous oxide: A global
20
perspective, Science, 262, 1855–1857, 1993.
McElroy, M. B. and Jones, D. B. A.: Evidence for an additional source of atmospheric N2O, Global Biogeochemical Cycles, 10, (4), 651–659, 1996.
McLinden, C. A., Olsen, S., Hannegan, B., Wild, O., Prather, M. J., and Sundet, J.: Strato-spheric ozone in 3-D models: A simple chemistry and the cross-tropopause flux, J. Geophys.
25
Res., 105, 14 653–14 665, 2000.
McLinden, C. A., Prather, M. J., and Johnson, M. S.: Global modeling of the isotopic analogues of N2O: Stratospheric distributions, budgets, and the17O−18O mass-independent anomaly, J. Geophys. Res., 108, (D8), 4233, 2003.
Merienne, M. F., Coquart, B., and Jenouvrier, A.: Temperature effect on the ultraviolet
absorp-30
tion of CFCl3, CFCl2and N2O, Planetary Space Science, 38, (5), 617–625, 1990.
Miller, C. E. and Yung, Y. L.: Photo-induced isotopic fractionation of stratospheric N2O, Chemo-sphere, 2, 255–266, 2000.
ACPD
4, 2333–2378, 2004
Ultra-violet absorption cross
sections
P. von Hessberg et al.
Title Page Abstract Introduction Conclusions References Tables Figures J I J I Back Close
Full Screen / Esc
Print Version
Interactive Discussion
© EGU 2004
Minschwaner, K., Salawitch, R. J., and McElroy, M. B.: Absorption of solar radiation by O2 – implications for O3 and lifetimes of N2O, CFCl3, and CF2Cl2, J. Geophys. Res. Atmos., 98, (D6), 10 543–10 561, 1993.
Morgan, G. C., Allen, M., Liang, M. C., Shia, R. L., Blake, G. A., and Yung, Y. L.: Isotopic fractionation of atmospheric nitrous oxide, J. Geophys. Res., 109, D04305,
5
doi:10.1029/2003JD003402, 2003.
Neyer, D. W., Heck, A. J. R., and Chandler, D. W.: Photodissociation of N2O: J-dependent anisotropy revealed in N2 photofragment images, J. Chem. Phys., 110, (7), 3411–3417, 1999a.
Neyer, D. W., Heck, A. J. R., and Chandler, D. W.: Speed-dependent alignment and angular
10
distributions of O(D-1(2))from the ultraviolet photodissociation of N2O, J. Phys. Chem. A, 103, (49), 10 388–10 397, 1999b.
Olsen, S., McLinden, C. A., and Prather, M. J.: Stratospheric N2O-NOysystem: Testing uncer-tainties in a 3-D framework, J. Geophys. Res., 106, (28), 28 771–28 784, 2001.
Park, S., Atlas, E. L., and Boering, K. A.: Measurements of N2O isotopologues in the
strato-15
sphere: Influence of transport on the apparent enrichment factors and the isotopologue fluxes to the troposphere, J. Geophys. R., 109, D01305, doi:10.1029/2003JD003731, 2004. Prasad, S. S.: Potential atmospheric sources and sinks of nitrous oxide 2. Possibilities from
excited O2, “embryonic” O3, and optically pumped excited O3, J. Geophys. Res., 102, (D17), 21 527–21 536, 1997.
20
Rahn, T. and Wahlen, M.: Stable isotope enrichment in stratospheric nitrous oxide, Science, 278, 1776–1778, 1997.
Rahn, T., Zhang, H., Wahlen, M., and Blake, G. A.: Stable isotope fractionation during ultraviolet photolysis of N2O, Geophys. Res. Lett., 25, (24), 4489–4492, 1998.
Rind, D., Suozzo, R., Balachandran, N. K., Lacis, A., and Russell, G.: The GISS global
cli-25
mate/middle atmosphere model, I, Model structure and climatology, J. Atmos. Science, 45, 329–370, 1988.
Rothman, L. S., Barbe, A., Benner, D. C., Brown, L. R., Camy-Peyret, C., Carleer, M. R., Chance, K., Clerbaux, C., Dana, V., Devi, V. M., Fayt, A., Flaud, J. M., Gamache, R. R., Goldman, A., Jacquemart, D., Jucks, K. W., Lafferty, W. J., Mandin, J. Y., Massie, S. T.,
30
Nemtchinov, V., Newnham, D. A., Perrin, A., Rinsland, C. P., Schroeder, J., Smith, K. M., Smith, M. A. H., Tang, K., Toth, R. A., Vander Auwera, J., Varanasi, P., Yoshino, K.: The HITRAN molecular spectroscopic database: edition of 2000 including updates through 2001,